[163 Pages Report] The market size for plastic additives was USD 38.31 billion in 2015 and is projected to reach USD 50.86 billion by 2021, registering a CAGR of 4.9% between 2016 and 2021. Plastic additives are ingredients that are added in polymers to improve their strength, durability, and heat sensitivity. The day-to-day activity of an individual involves plastic goods that are made from polymer mixed with a complex blend of materials known as additives. Plastic additives are added to enhance process-ability, performance, or appearance of the polymer. Plastic additives have found widespread applications in construction, packaging, automotive, consumer goods, and other applications such as pharmaceutical, furniture, sports, and agriculture. The demand for plastic additives is estimated to grow on account of the increasing consumption of plastic and rising disposable income of consumers. In this report, 2015 is considered as the base year and forecast period is between 2016 and 2021.
Plastic additives have a large number of applications such as packaging, construction, automotive, consumer goods, textile, agriculture, and medical, among others. Growth in market size of plastic additives is anticipated to be partly driven by a turnaround in these key market segments and the increasing need for additives in polymers for applications in these segments.
Plastics, especially engineering plastics, possess superior mechanical and electrical properties, superior abrasion resistance, superior chemical resistance, and other properties compared to conventional materials such as metals, glass, paper, and ceramic. Continuous innovation and need for lighter material in several applications is encouraging the replacement of these conventional materials by plastic in several applications.
In the automotive sector, plastics have contributed to a multitude of innovations regarding safety, performance, and fuel efficiency. Seat belts made from durable strands of polyester fiber have apparently helped save many lives in car accidents. In addition, airbags made from high-strength nylon fabric can reduce the risk of fatal injury in a direct, frontal car crash. Child safety seats made through numerous advancements in polymer science help protect our kids at every turn. Traditionally papers and leaves were used in food packaging. With the advent of plastic materials, the preference of consumers started shifting towards plastic packaging due to ease and convenience provided by plastics over traditional packaging methods.
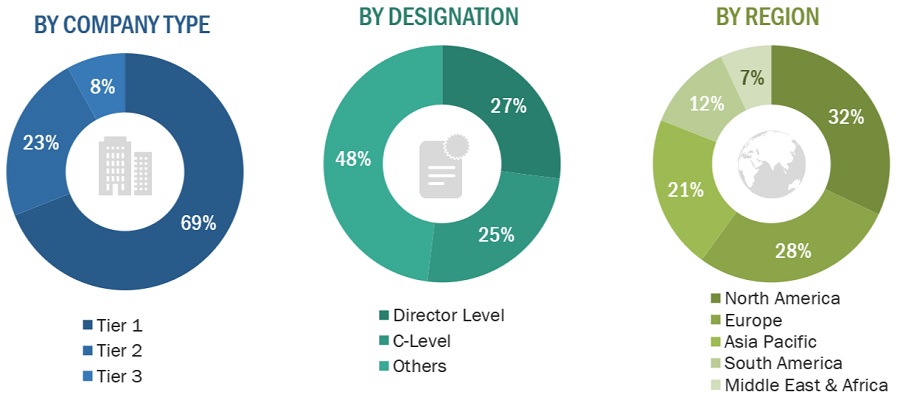
This research study involves the extensive use of secondary sources, directories, and databases (such as Hoovers, Bloomberg BusinessWeek, and Factiva) to identify and collect information useful for this technical, market-oriented, and commercial study of the plastic additives market. The primary sources mainly include several industry experts from core and related industries and preferred suppliers, manufacturers, distributors, service providers, and organizations related to all segments of the industrys supply chain. After arriving at the overall market size, the total market has been split into several segments and subsegments. The figure below illustrates the breakdown of the primary interviews based on company type, designation, and region conducted during the research study:
To know about the assumptions considered for the study, download the pdf brochure
The value chain of plastic additives starts with the procurement of raw materials. The key components of any type of plastics additives are additives and polymer. The raw materials are chemically synthesized to form a typical concentrate, which is then compounded by plastic additives producers. Compounding is a two-stage process; gathering ingredients and then mixing them together by applying heat and shear stress to produce a homogenized pellet. Compounders improve the properties of thermoplastic polymers by incorporating additives in molten state. A great amount of effort and expertise is required to manufacture plastic additives suitable for different end-use application. The major applications where these plastic additives are used include packaging, construction, consumer goods, automotive, and others. Some of the major players in the plastic additive market are Songwon Industrial Co. Ltd. (South Korea), Albemarle Corporation (U.S.), Clariant AG (Switzerland), BASF SE (Germany), The Dow Chemical Company (U.S.), Bayer AG (Germany), Evonik Industries AG (Germany), Kaneka Corporation (Japan), Lanxess AG (Germany), and others.
This report categorizes the global market of plastic additives on the basis of type, plastic, application, and region.
The market size of plastic additives is projected to reach USD 50.86 billion by 2021, registering a CAGR of 4.9% between 2016 and 2021. The rapid growth in the packaging industry in Asia-Pacific is a key driver of the plastic additives market.
Plastics additives are used in a variety of applications ranging from construction, packaging containers to consumer & electronics appliances, business machines, and automotive parts. Plastic additives improves impact strength, chemical & heat resistance, clarity, weather resistance, and color preservation properties to base polymers. It also helps in the processing of plastics by increasing heat stability, increasing melting point, and lubrication which enables plastics manufacturers to achieve higher output rates and increased efficiency without reducing the quality of the final product.
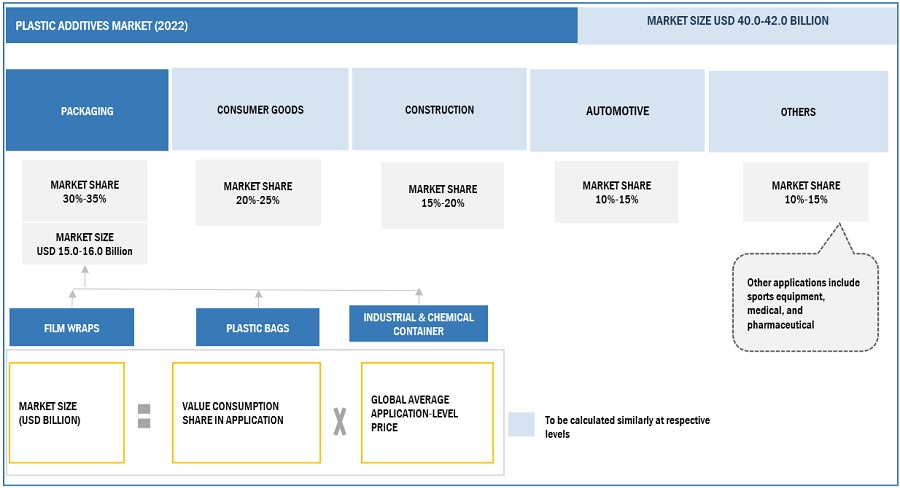
Packaging is the dominating application segment of the plastic additives market. It is widely used for industrial and household purposes. Change in lifestyle and globalization have triggered the demand plastic additives from the packaging industry. The automotive and packaging application segments are estimated to witness strong growth during the forecast period. Some of the common end-use applications of plastic additives are roofing, storage containers, pipes, cables, electronics, toys, kitchenware, safety gear, cosmetic articles, household products, seat belts, door panels, greenhouse films, and silage sheet.
On the basis of type, plasticizers account for a major share of the plastic additives market as it is extensively used to process polymers and are less expensive than other additives. They are usually combined with PVC or other polymers to impart unique physical and technological properties for use in various applications such as cable jacketing, floor & wall coverings, and coating fabrics.
On the basis of types of plastic, commodity plastic dominates the consumption of plastic additives. Commodity plastics include polyethylene, polypropylene, polystyrene, polyvinyl chloride, polymethyl methacrylate, and others. These are used to impart specific resin properties to processed polymers. Polyethylene products are mostly used in various end-use applications such as packaging bags, general plastic films, medical packaging, mulch films, green house & tunnel films, and pipes
On the basis of region, Asia-Pacific is the largest market for plastic additives. The growing packaging industry coupled with the increased demand from the retail industry drives the market of plastic additives in the region. Polymer industries are witnessing high growth in developing nations such as India and Brazil due to their growing economies. The Middle East & Africa is projected to be the second-fastest growing market for plastic additives between 2016 and 2021. This growth is attributed to rising packaging and automotive sectors in the region.
Packaging is a process to preserve and protect the quality and shelf-life of different products, such as electronic goods, medicines & drugs, processed & semi-processed foods, and hardware items. The major drivers that aid the growth of the packaging industry are rapid urbanization, changing consumer lifestyle, economic trends, rising health awareness among different classes of consumers, and development in packaging material & technology. The various properties of plastics, such as durability; low cost; resistance to corrosion and water & chemicals; low thermal conductivity; and others make it suitable for use in various applications. The rise in the use of plastics in heavy and light packing drives the demand for plastic additives. The demand for plasticizers, flame-retardant, and stabilizers is growing with the increasing demand for plastics in packaging.
Consumer goods include home appliances, electronics, sports equipment, firearms, toys, footwear, kitchenware, cosmetics, furniture, and others. The different variants of plastics that are used in manufacturing consumer goods include high density polyethylene (HDPE), polypropylene (PP) fibers & filaments, and others. These plastics are used with plastic additives to enhance the chemical and physical properties of plastic products.
Plastics play a key role in the construction sector. The demand for plastics for this segment is expected to increase on account of its increasing use in several applications, including pipes, cables, flooring, domes, roofing, windows & doors, storage tanks, hardware containers, insulation materials, and others. Plastics are used in the construction industry due to their physical characteristics such as durability, cost effectiveness, recyclability, safety, light weight, easy-to-install, and corrosion resistance, among others. The various types of plastics used in manufacturing building & construction goods are acrylic (PMMA), polystyrene (PS), polycarbonate (PC), polyethylene (PE), polypropylene (PP), and polyvinylchloride (PVC). The increasing usage of plastics drives the market for plastic additives in the construction industry.
The major factor restraining the growth of the plastic additives market is stringent government regulations against the use of environmentally harmful products. The use of innovative technology to reduce the environmental issues is expected to offer opportunities for players in the market.
Some of the key players of the plastic additives market are Songwon Industrial Co. Ltd. (South Korea), Albemarle Corporation (U.S.), Clariant AG (Switzerland), BASF SE (Germany), The Dow Chemical Company (U.S.), and others. These players offer wide range of products to meet the market requirements and compete with each other with respect to prices.
To speak to our analyst for a discussion on the above findings, click Speak to Analyst
Table of Contents
1 Introduction (Page No. - 18)
1.1 Objectives of the Study
1.2 Market Definition
1.3 Market Scope
1.3.1 Years Considered for the Study
1.4 Currency
1.5 Package Size
1.6 Limitation
1.7 Stakeholders
2 Research Methodology (Page No. - 22)
2.1 Research Data
2.1.1 Secondary Data
2.1.1.1 Key Data From Secondary Sources
2.1.2 Primary Data
2.1.2.1 Key Data From Primary Sources
2.1.2.2 Key Industry Insights
2.1.2.3 Breakdown of Primary Interviews
2.2 Market Size Estimation
2.2.1 Bottom-Up Approach
2.2.2 Top-Down Approach
2.3 Data Triangulation
2.4 Research Assumptions
3 Executive Summary (Page No. - 30)
4 Premium Insights (Page No. - 35)
4.1 Significant Opportunities in Plastic Additives Market (20162021)
4.3 Plastic Additives Market Share in Asia-Pacific
4.4 Plastic Additive Market Attractiveness
4.5 Plastic Additives Market Size, By Application, 2015
4.6 Plastic Additive Market Size: Developed vs Developing Nations
4.7 Lifecycle Analysis, By Region
5 Market Overview (Page No. - 41)
5.1 Introduction
5.2 Market Segmentation
5.2.1 Plastic Additives Market, By Region
5.3 Market Dynamics
5.3.1 Drivers
5.3.1.1 Replacement of Conventional Materials By Plastics in Several Applications
5.3.1.2 Increasing Disposable Income and Rapid Urbanization
5.3.1.3 Rising Demand From Asia-Pacific Region
5.3.2 Restraints
5.3.2.1 Stringent Governmental Regulations Governing the Plastic Additives Market
5.3.3 Opportunities
5.3.3.1 Untapped Opportunities in Emerging Markets for Packaging
5.3.3.2 Increasing Demand From Agriculture and Pharmaceutical Applications
5.3.4 Challenges
5.3.4.1 Uncertain Low Phthalate Plasticizer Demand in Asia-Pacific Region
5.3.4.2 Recycling of Non-Degradable Plastics Waste
5.3.5 Burning Issue
5.3.5.1 Emergence of Bio-Plasticizers
6 Industry Trends (Page No. - 53)
6.1 Value Chain
6.2 Porters Five Forces Analysis
6.2.1 Threat of Substitutes
6.2.2 Bargaining Power of Suppliers
6.2.3 Bargaining Power of Buyers
6.2.4 Threat of New Entrants
6.2.5 Intensity of Rivalry
6.3 Regulatory Framework
6.4 Economic Indicators
6.4.1 Industry Outlook
6.4.1.1 Packaging
6.4.1.2 Automotive
6.4.1.3 Construction
7 Plastic Additives Market, By Type (Page No. - 64)
7.1 Introduction
7.1.1 Plasticizers
7.1.1.1 Phthalates
7.1.1.1.1 Low Phthalates
7.1.1.1.2 High Phthalates
7.1.1.2 Non-Phthalates
7.1.2 Stabilizers
7.1.2.1 Antioxidants
7.1.2.2 Heat Stabilizers
7.1.2.3 Light Stabilizers
7.1.3 Flame Retardants
7.1.3.1 Brominated
7.1.3.2 Phosphorus
7.1.3.3 Aluminum Trihydroxide (ATH)
7.1.3.4 Nitrogen
7.1.3.5 Other Flame Retardants
7.1.4 Impact Modifiers
7.1.5 Other Plastic Additives
7.1.5.1 Anti-Microbial
7.1.5.2 Antistatic Agents
7.1.5.3 Blowing Agent
7.1.5.4 Fillers
7.1.5.5 Nucleating Agents
8 Plastic Additives Market, By Plastic (Page No. - 71)
8.1 Introduction
8.2 Commodity Plastics
8.2.1 Polyethylene (PE)
8.2.2 Polystyrene (PS)
8.2.3 Polyphenylene Ethers (PPE)
8.3 Engineering Plastic
8.3.1 Polyamides (PA)
8.3.2 Polyethylene Terephthalate (PET)
8.3.3 Polybutylene Terephthalate (PBT)
8.3.4 Polycarbonate (PC)
8.4 High Performance Plastics
8.4.1 Polyether Ether Ketone (PEEK)
8.4.2 Polyimide (PI)
8.4.3 Polytetrafluoroethylene (PTFE)
9 Plastic Additives Market, By Application (Page No. - 77)
9.1 Introduction
9.2 Packaging
9.3 Consumer Goods
9.4 Construction
9.5 Automotive
9.6 Others
10 Plastic Additives Market, By Region (Page No. - 82)
10.1 Introduction
10.2 Asia-Pacific
10.2.1 China
10.2.2 Japan
10.2.3 India
10.2.4 South Korea
10.2.5 Australia & New Zealand
10.2.6 Rest of Asia-Pacific
10.3 Europe
10.3.2 Italy
10.3.3 France
10.3.4 U.K.
10.3.5 Spain
10.3.6 Rest of Europe
10.4 North America
10.4.1 U.S.
10.4.2 Mexico
10.4.3 Canada
10.5 Middle East & Africa
10.5.1 Saudi Arabia
10.5.2 Iran
10.5.3 South Africa
10.5.4 Rest of the Middle East & Africa
10.6 South America
10.6.1 Brazil
10.6.2 Argentina
10.6.3 Rest of South America
11 Competitive Landscape (Page No. - 120)
11.1 Overview
11.2 Competitive Benchmarking
11.3 Market Share Analysis
11.4 Competitive Situation and Trends
11.4.1 New Product Launches
11.4.2 Mergers & Acquisitions
11.4.3 Agreements
11.4.4 Expansions
11.4.5 Joint Ventures
12 Company Profiles (Page No. - 127)
(Overview, Financial*, Products & Services, Strategy, and Developments)
12.1 Songwon Industrial Co., Ltd.
12.2 Albemarle Corporation
12.3 BASF SE
12.4 Clariant AG
12.5 The DOW Chemical Company
12.6 Akzonobel NV
12.7 Bayer AG
12.8 Chemtura Corporation
12.9 Evonik Industries AG
12.10 Kaneka Corporation
12.11 Lanxess AG
12.12 Other Market Players
12.12.1 Adeka Corporation
12.12.2 Polymers Compounding Co. Ltd.
12.12.3 Baerlocher Group
12.12.4 Emerald Performance Materials
12.12.5 Grafe Advanced Polymers GmbH
12.12.6 Milliken & Company
12.12.7 Plastics United Group
12.12.8 Polyone
12.12.9 Sabo S.P.A.
12.12.10 Sakai Chemical Industry Co., Ltd.
*Details Might Not Be Captured in Case of Unlisted Companies
13 Appendix (Page No. - 155)
13.1 Insights From Industry Experts
13.2 Discussion Guide
13.3 Introducing RT: Real-Time Market Intelligence
13.4 Knowledge Store: Marketsandmarkets Subscription Portal
13.5 Available Customizations
13.6 Related Reports
List of Tables (90 Tables)
Table 1 Major Plastic Additives and Their Functions
Table 2 Plastic Additive Market, By Type
Table 3 Plastic Additives Market, By Plastic
Table 4 Plastic Additive Market, By Application
Table 5 GDP of the Top Ten Largest Economies, in Terms of Ppp, 2020
Table 6 Regulations Against Plastic Waste, 20112013
Table 7 Packaging Laws in Europe, 2016-2021
Table 8 Bio-Based Plasticizers Producers for PVC
Table 9 List of Top Plastic Additives Manufactures, By Region
Table 10 Regulatory Authorities Governing Plastic Additives
Table 11 Plastic Additives Market Size, By Type, 20142021 (Kiloton)
Table 12 Plastic Additive Market Size, By Type, 20142021 (USD Million)
Table 13 Plastic Mapping
Table 14 Plastic Additives Market Size, By Plastic Type, 20142021 (Kiloton)
Table 15 Plastic Additive Market Size, By Plastic Type, 20142021 (USD Million)
Table 16 Plastic Additives Market Mapping By Application
Table 17 Plastic Additive Market Size, By Application, 20142021 (Kiloton)
Table 18 Plastic Additives Market Size, By Application, 20142021 (USD Million)
Table 19 Plastic Additive Market Size, By Region, 20142021 (Kiloton)
Table 20 Plastic Additives Market Size, By Region, 20142021 (USD Million)
Table 21 Asia-Pacific: Plastic Additives Market Size, By Country, 20142021 (Kiloton)
Table 22 Asia-Pacific: Market Size, By Country, 20142021 (USD Million)
Table 23 Asia-Pacific: Market Size, By Application, 20142021 (Kiloton)
Table 24 Asia-Pacific: Market Size, By Application, 20142021 (USD Million)
Table 25 China: Plastic Additives Market Size, By Application, 20142021 (Kiloton)
Table 26 China: Market Size, By Application, 20142021 (USD Million)
Table 27 Japan: Plastic Additives Market Size, By Application, 20142021 (Kiloton)
Table 28 Japan: Market Size, By Application, 20142021 (USD Million)
Table 29 India: Plastic Additives Market Size, By Application, 20142021 (Kiloton)
Table 30 India: Market Size, By Application, 20142021 (USD Million)
Table 31 South Korea: Plastic Additives Market Size, By Application, 20142021 (Kiloton)
Table 32 South Korea: Market Size, By Application, 20142021 (USD Million)
Table 33 Australia & New Zealand: Plastic Additives Market Size, By Application, 20142021 (Kiloton)
Table 34 Australia & New Zealand: Market Size, By Application, 20142021 (USD Million)
Table 35 Rest of Asia-Pacific: Plastic Additives Market Size, By Application, 20142021 (Kiloton)
Table 36 Rest of Asia-Pacific: Market Size, By Application, 20142021 (USD Million)
Table 37 Europe: Plastic Additives Market Size, By Country, 20142021 (Kiloton)
Table 38 Europe: Market Size, By Country, 20142021 (USD Million)
Table 39 Europe: Market Size, By Application, 20142021 (Kiloton)
Table 40 Europe: Market Size, By Application, 20142021 (USD Million)
Table 41 Germany: Plastic Additives Market Size, By Application, 20142021 (Kiloton)
Table 42 Germany: Market Size, By Application, 20142021 (USD Million)
Table 43 Italy: Plastic Additives Market Size, By Application, 20142021 (Kiloton)
Table 44 Italy: Market Size, By Application, 20142021 (USD Million)
Table 45 France: Plastic Additives Market Size, By Application, 20142021 (Kiloton)
Table 46 France: Market Size, By Application, 20142021 (USD Million)
Table 47 U.K.: Plastic Additives Market Size, By Application, 20142021 (Kiloton)
Table 48 U.K.: Market Size, By Application, 20142021 (USD Million)
Table 49 Spain: Plastic Additives Market Size, By Application, 20142021 (Kiloton)
Table 50 Spain: Market Size, By Application, 20142021 (USD Million)
Table 51 Rest of Europe: Plastic Additives Market Size, By Application, 20142021 (Kiloton)
Table 52 Rest of Europe: Market Size, By Application, 20142021 (USD Million)
Table 53 North America: Market Size, By Country, 20142021 (Kiloton)
Table 54 North America: Market Size, By Country, 20142021 (USD Million)
Table 55 North America: Market Size, By Application, 20142021 (Kiloton)
Table 56 North America: Market Size, By Application, 20142021 (USD Million)
Table 57 U.S.: Plastic Additives Market Size, By Application, 20142021 (Kiloton)
Table 58 U.S.: Market Size, By Application, 20142021 (USD Million)
Table 59 Mexico: Plastic Additives Market Size, By Application, 20142021 (Kiloton)
Table 60 Mexico: Market Size, By Application, 20142021 (USD Million)
Table 61 Canada: Plastic Additives Market Size, By Application, 20142021 (Kiloton)
Table 62 Canada: Market Size, By Application, 20142021 (USD Million)
Table 63 Middle East & Africa: Plastic Additives Market Size, By Country, 20142021 (Kiloton)
Table 64 Middle East & Africa: Market Size, By Country, 20142021 (USD Million)
Table 65 Middle East & Africa: Market Size, By Application, 20142021 (Kiloton)
Table 66 Middle East & Africa: Market Size, By Application, 20142021 (USD Million)
Table 67 Saudi Arabia: Plastic Additives Market Size, By Application, 20142021 (Kiloton)
Table 68 Saudi Arabia: Market Size, By Application, 20142021 (USD Million)
Table 69 Iran: Plastic Additives Market Size, By Application, 20142021 (Kiloton)
Table 70 Iran: Market Size, By Application, 20142021 (USD Million)
Table 71 South Africa: Plastic Additives Market Size, By Application, 20142021 (Kiloton)
Table 72 South Africa: Market Size, By Application, 20142021 (USD Million)
Table 73 Rest of the Middle East & Africa: Plastic Additives Market Size, By Application, 20142021 (Kiloton)
Table 74 Rest of the Middle East & Africa: Market Size, By Application, 20142021 (USD Million)
Table 75 South America: Plastic Additives Market Size, By Country, 20142021 (Kiloton)
Table 76 South America: Market Size, By Country, 20142021 (USD Million)
Table 77 South America: Market Size, By Application, 20142021 (Kiloton)
Table 78 South America: Market Size, By Application, 20142021 (USD Million)
Table 79 Brazil: Plastic Additives Market Size, By Application, 20142021 (Kiloton)
Table 80 Brazil: Market Size, By Application, 20142021 (USD Million)
Table 81 Argentina: Plastic Additives Market Size, By Application, 20142021 (Kiloton)
Table 82 Argentina: Market Size, By Application, 20142021 (USD Million)
Table 83 Rest of South America: Plastic Additives Market Size, By Application, 20142021 (Kiloton)
Table 84 Rest of South America: Market Size, By Application, 20142021 (USD Million)
Table 85 Brand Influence on the Plastic Additives Market
Table 86 New Product Launches, 20142016
Table 87 Mergers & Acquisitions, 20142016
Table 88 Agreements, 20142016
Table 89 Expansions, 20142016
Table 90 Joint Ventures, 20142016
List of Figures (52 Figures)
Figure 1 Plastic Additives Market: Research Design
Figure 2 Market Size Estimation: Bottom-Up Approach
Figure 3 Market Size Estimation: Top-Down Approach
Figure 4 Plastic Additive Market: Data Triangulation
Figure 5 Plasticizers Dominates the Plastic Additives Market During Forecast Period
Figure 6 Packaging Segment to Register Highest CAGR During Forecast Period
Figure 7 Commodity Plastics is the Largest Segment of Plastic Additive Market During Forecast Period
Figure 8 Asia-Pacific to Register Highest CAGR During Forecast Period
Figure 9 Plastic Additives Market to Witness Moderate Growth Between 2016 and 2021
Figure 10 Asia-Pacific to Witness Highest CAGR Between 2016 and 2021
Figure 11 China Accounted for Largest Share of Plastic Additives Market in Asia-Pacific, 2015
Figure 12 Asia-Pacific to Be the Fastest-Growing Market for Plastic Additives Between 2016 and 2021
Figure 13 Packaging Accounted for the Largest Market Share in 2015
Figure 14 China and India to Emerge as Lucrative Markets Between 2016 and 2021
Figure 15 Asia-Pacific Plastic Additive Market Experiencing High Growth Phase
Figure 16 Plastic Additives Market, By Region
Figure 17 Overview of the Factors Governing the Plastic Additives Market
Figure 18 Value Chain Analysis for Plastic Additives
Figure 19 Porters Five Forces Analysis
Figure 20 Global Packaging Industry, By Region, 2014
Figure 21 Global Packaging Industry, By End User, 2014
Figure 22 Vehicles in Use, By Region, 201
Figure 23 Construction Industry Growth Rate, 2014
Figure 24 Flame Retardant Segment to Witness Significant Growth
Figure 25 Type of Plasticizers
Figure 26 Commodity Plastic to Account for Largest Share of Plastic Additives Market During Forecast Period
Figure 27 Packaging Segment is the Largest Application for Plastic Additives
Figure 28 Regional Snapshot(20162021): China and India Emerging as Strategic Locations
Figure 29 China and India to Be the Fastest-Growing Plastic Additive Market Between 2016 and 2021
Figure 30 Asia-Pacific Marketsnapshot: Packaging Industry to Dominate the Plastic Additives Market
Figure 31 Plastic Additives Market in Europe Snapshot: Germany Projected to Dominate the Market During Forecast Period
Figure 32 North American Marketsnapshot: U.S. to Register High Growth During Forecast Period
Figure 33 Plastic Additivesmarket in the Middle East & Africa Snapshot: Saudi Arabia to Register the Highest CAGR During Forecast Period
Figure 34 Brazil to Dominate the Plastic Additives Market in South America
Figure 35 Companies Adopted New Product Launches as the Key Growth Strategy Between 2014 and 2016
Figure 36 Plastic Additives Market Share, By Company, 2015
Figure 37 Songwon Industrial Co. Ltd.: Company Snapshot
Figure 38 Songwon Industrial Co. Ltd.: SWOT Analysis
Figure 39 Albemarle Corporation: Company Snapshot
Figure 40 Albemarle Corporation: SWOT Analysis
Figure 41 BASF SE: Company Snapshot
Figure 42 BASF SE: SWOT Analysis
Figure 43 Clariant AG: Company Snapshot
Figure 44 Clariant AG: SWOT Analysis
Figure 45 The DOW Chemical Company: Company Snapshot
Figure 46 The DOW Chemical Co.: SWOT Analysis
Figure 47 Akzonobel NV: Company Snapshot
Figure 48 Bayer AG: Company at A Glance
Figure 49 Chemtura Corporation: Company Snapshot
Figure 50 Evonik Industries AG: Company Snapshot
Figure 51 Kaneka Corporation: Company Snapshot
Figure 52 Lanxess AG: Company Snapshot
Benchmarking the rapid strategy shifts of the Top 100 companies in the Plastic Additives Market
Request For Special Pricing
Growth opportunities and latent adjacency in Plastic Additives Market
Market scenario of polymer and plastic
polymer additives market
Specific information on Plastic Additives Market for each country and product type
Specific Information on the plastic additives market report
Interested in plastic additive market report
Plastic additives global study.