Plastic Fasteners Market by Product Type (Rivets & Push-In Clips, Cable Clips & Ties, Threaded Fasteners, Washers & Spacers), End User (Automotive, Electrical & Electronics, Building & Construction, Supermarkets), and Region - Global Forecast to 2022


Global Plastic Fasteners Market is projected to grow from an estimated USD 4.19 Billion in 2016 to USD 6.04 Billion by 2022, at a CAGR of 6.3% from 2017 to 2022.
The objectives of this study are:
- To estimate and forecast the plastic fasteners market, in terms of value
- To provide a detailed segmentation of the plastic fasteners market on the basis of product type, end user, and region
- To analyze and forecast the segments of the plastic fasteners market and present an overall view of the market
- To identify emerging trends and opportunities in the plastic fasteners market
- To analyze the market with focus on high growth applications and fastest-growing segments
- To analyze the factors that drive and restrain the growth of the plastic fasteners market
- To provide a comprehensive competitive landscape of the market and profile key market players with respect to their market shares/ranking
The years considered for the study are:
- Base Year � 2016
- Estimated Year � 2017
- Projected Year � 2022
- Forecast Period � 2017 to 2022
For company profiles in the report, 2016 has been considered as the base year. In cases wherein information is unavailable for the base year, the years prior to it have been considered.
Research Methodology
The research methodology used to estimate and forecast the global plastic fasteners market began with capturing data on key vendor revenues through secondary sources, such as Hoovers, Bloomberg, Chemical Weekly, Factiva, and various other government and private websites. Vendor offerings have also been taken into consideration to determine the market segmentation. After arriving at the overall market size, the total market was split into several segments and subsegments, which were later verified through primary research by conducting extensive interviews with key personnel, such as CEOs, VPs, directors, and executives. Data triangulation and market breakdown procedures were employed to complete the overall market engineering process and arrive at the exact statistics for all segments and subsegments of the market. The breakdown of profiles of primaries is depicted in the figure below.
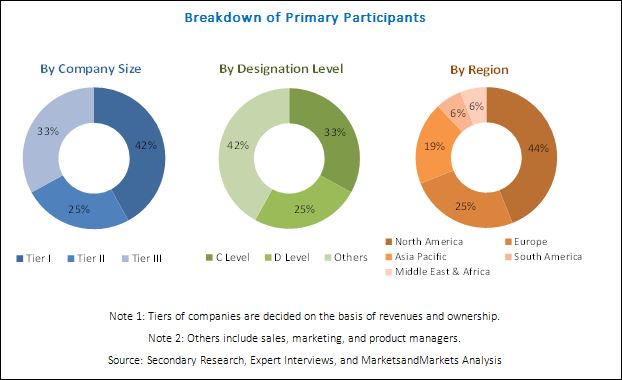
To know about the assumptions considered for the study, download the pdf brochure
The plastic fasteners market has a diversified ecosystem of upstream players, including raw material suppliers, along with downstream stakeholders, vendors, and government organizations. Companies operating in the plastic fasteners market include Illinois Tool Works (US), ARaymond (France), Nifco (Japan), Stanley Black & Decker (US), and Bossard Group (Switzerland), among others.
Target Audience
- Manufacturers, Dealers, and Suppliers of Plastic fasteners
- End Users of Plastic fasteners
- Government and Research Organizations
- Companies Operational in Material R&D
- Associations and Industrial Bodies
- Investment Banks
- Consulting Companies/Consultants in Chemical and Material Sectors
�This study answers several questions for stakeholders, primarily the market segments which they need to focus upon during the next two to five years so that they may prioritize their efforts and investments accordingly.�
Scope of the Report: This research report categorizes the plastic fasteners market based on product type, end user, and region, and forecasts revenues as well as analyzes trends in each of the submarkets.
On the Basis of Product Type:
- Rivets & Push-in Clips
- Cable Clips & Ties
- Threaded Fasteners
- Washers & Spacers
- Grommets & Bushings
- Wall Plugs
- Others
On the Basis of End User:
- Automotive
- Electrical & Electronics
- Building & Construction
- Supermarkets
- Others
On the Basis of Region:
- Asia Pacific
- North America
- Europe
- South America
- Middle East & Africa
The following customization options are available for the report:
Along with the given market data, MarketsandMarkets offers customizations as per the company�s specific needs. The following customization options are available for the report:
Product Analysis
- Product matrix, which provides a detailed comparison of the product portfolio of each company
Geographic Analysis
- Further breakdown of the Rest of Asia Pacific, Rest of the Middle East & Africa, Rest of Europe, and Rest of South America plastic fasteners markets
Company Information
- Detailed analysis and profiles of additional market players (up to five companies)
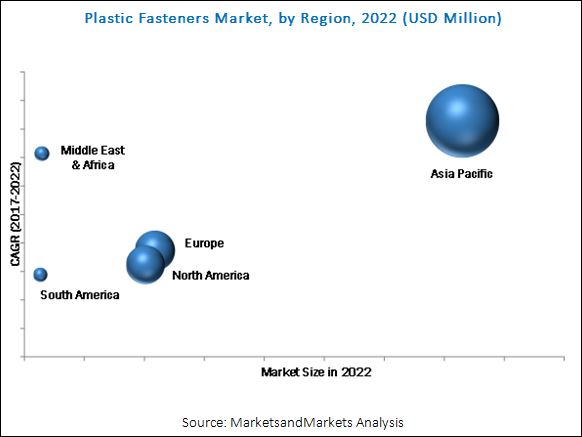
The global plastic fasteners market is projected to grow from an estimated USD 4.45 Billion in 2017 to USD 6.04 Billion by 2022, at a CAGR of 6.3% from 2017 to 2022. Growth in the Asia Pacific automotive industry is a major driver for the plastic fasteners market. The support of governments of the Asian countries has led to a favorable environment for local and foreign producers of automobiles to increase production. Increasing investments in residential and non-residential construction sectors in Asia Pacific and North American regions have also created a demand for plastic fasteners.
The rivets & push-in clips segment is projected to be the largest product type segment of the plastic fasteners market from 2017 to 2022. Rivets and push-in clips are increasingly used in automobiles and electrical & electronics. Push-in clips are used to connect plastic parts, light sheet metals, and insulating materials. They are also used as bumpers and hole plugs. Push-in clips are used with nylon washers to fasten flimsy materials. A subtype of push-in clips, known as belly buttons, are resistant to vibration, abrasion, and corrosion.
The automotive segment is estimated to be the largest end-user segment of the plastic fasteners market in 2017. The rising demand for electric vehicles is expected to drive the growth of the automotive segment of the plastic fasteners market. Environmental regulations formulated by various government bodies have propelled the development of lightweight and fuel-efficient automobiles, which, in turn, has contributed to the high demand for plastic fasteners from the automotive industry.
Asia Pacific is expected to be the fastest-growing market for plastic fasteners during the forecast period. China, Japan, India, and South Korea are the major producers of passenger cars and commercial vehicles in the region. The increasing construction expenditure is another reason for the growth of this market in the region.
The slowdown in the US automotive sector is a restraint for the plastic fasteners market. The demand for vehicles in the US is declining due to high loan rates and tight credit conditions. The US is the second-largest producer of automobiles globally, and the slowdown will affect the plastic fasteners market growth.
Key players operating in the plastic fasteners market include Illinois Tool Works (US), ARaymond (France), Nifco (Japan), Stanley Black & Decker (US), and Bossard Group (Switzerland), among others. These companies focus on investing in capacity expansions of plants to achieve growth in the plastic fasteners market.
To speak to our analyst for a discussion on the above findings, click Speak to Analyst
 Exclusive indicates content/data unique to MarketsandMarkets and not available with any competitors.
Table of Contents
1 Introduction (Page No. - 12)
1.1 Objectives of the Study
1.2 Market Definition
1.3 Scope of the Study
1.3.1 Years Considered for the Study
1.4 Currency
1.5 Stakeholders
2 Research Methodology (Page No. - 15)
2.1 Research Data
2.1.1 Secondary Data
2.1.1.1 Key Data From Secondary Sources
2.1.2 Primary Data
2.1.2.1 Key Data From Primary Sources
2.1.2.2 Key Industry Insights
2.1.2.3 Breakdown of Primary Interviews
2.2 Market Size Estimation
2.2.1 Bottom-Up Approach
2.2.2 Top-Down Approach
2.3 Data Triangulation
2.4 Assumptions
2.5 Limitations
3 Executive Summary (Page No. - 23)
4 Premium Insights (Page No. - 26)
4.1 Attractive Opportunities in the Plastic Fasteners Market
4.2 Plastic Fasteners Market, By Region
4.3 Asia Pacific Market, By Country and Product Type
4.4 Market, By End User and Region
4.5 Plastic Fasteners Market, By Country
5 Market Overview (Page No. - 29)
5.1 Introduction
5.2 Market Dynamics
5.2.1 Drivers
5.2.1.1 Increasing Demand From the Automotive Sector in Asia Pacific
5.2.1.2 Growth of the Construction Industry
5.2.2 Restraints
5.2.2.1 Slowdown in the US Automotive Sector
5.2.3 Opportunities
5.2.3.1 High Demand for Electric Vehicles
5.2.4 Challenges
5.2.4.1 Structural Adhesives Used as Substitutes of Plastic Fasteners
5.3 Porter�s Five Forces Analysis
5.3.1 Bargaining Power of Suppliers
5.3.2 Threat of New Entrants
5.3.3 Threat of Substitutes
5.3.4 Bargaining Power of Buyers
5.3.5 Intensity of Rivalry
5.4 Macroeconomic Indicators
5.4.1 Annual GDP Growth Rate of Major Economies
5.4.2 Automotive Industry
5.5 Raw Material Type
5.5.1 Polyamide (PA)
5.5.2 Polyoxymethylene (POM)
5.5.3 Polycarbonate (PC)
5.5.4 Polyvinyl Chloride (PVC)
5.5.5 Others
5.5.5.1 Polypropylene (PP)
5.5.5.2 Polyetheretherketone (PEEk)
5.5.5.3 Polytetrafluoroethylene (PTFE)
5.5.5.4 Polyethylene (PE)
6 Plastic Fasteners Market, By Product Type (Page No. - 39)
6.1 Introduction
6.2 Rivets & Push-In Clips
6.3 Cable Clips & Ties
6.4 Threaded Fasteners
6.5 Washers & Spacers
6.6 Grommets & Bushings
6.7 Wall Plugs
6.8 Others
7 Plastic Fasteners Market, By End User (Page No. - 45)
7.1 Introduction
7.2 Automotive
7.3 Electrical & Electronics
7.4 Building & Construction
7.5 Supermarkets
7.6 Others
8 Plastic Fasteners Market, By Region (Page No. - 51)
8.1 Introduction
8.2 Asia Pacific
8.2.1 China
8.2.2 Japan
8.2.3 India
8.2.4 South Korea
8.2.5 Thailand
8.2.6 Indonesia
8.2.7 Malaysia
8.2.8 Rest of Asia Pacific
8.3 Europe
8.3.1 Germany
8.3.2 France
8.3.3 Spain
8.3.4 UK
8.3.5 Russia
8.3.6 Italy
8.3.7 Turkey
8.3.8 Poland
8.3.9 Rest of Europe
8.4 North America
8.4.1 US
8.4.2 Mexico
8.4.3 Canada
8.5 South America
8.5.1 Brazil
8.5.2 Argentina
8.5.3 Rest of South America
8.6 Middle East & Africa
8.6.1 Iran
8.6.2 South Africa
8.6.3 Rest of Middle East & Africa
9 Competitive Landscape (Page No. - 91)
9.1 Overview
9.2 Market Ranking Analysis
9.3 Competitive Situation & Trends
9.3.1 Expansions
9.3.2 Acquisitions
9.3.3 Collaborations
9.3.4 Agreements
10 Company Profiles (Page No. - 96)
Business Overview, Products Offered, Recent Developments, SWOT Analysis, MnM View
10.1 Illinois Tool Works
10.2 Araymond
10.3 Nifco
10.4 Stanley Black & Decker
10.5 Bossard Group
10.6 Arconic
10.8 Penn Engineering
10.9 Shamrock International Fasteners
10.10 Volt Industrial Plastics
10.11 Other Leading Players
10.11.1 Anil Plastics & Enterprises
10.11.2 B�lte Plastics
10.11.3 Canco Fasteners
10.11.4 Craftech Industries
10.11.5 E & T Fasteners
10.11.6 Fontana Gruppo
10.11.7 Joxco Seals
10.11.8 KGS Kitagawa Industries Co.
10.11.9 Micro Plastics
10.11.10 MW Industries
10.11.11 Nyltite Corporation
10.11.12 Shanghai Yuanmao Fastener Co.
10.11.13 Surelock Plastics
10.11.14 Termax Corporation
10.11.15 Wilhelm B�llhoff GmbH & Co.
*Details Might Not Be Captured in Case of Unlisted Companies.
11 Appendix (Page No. - 130)
11.1 Discussion Guide
11.2 Knowledge Store: Marketsandmarkets� Subscription Portal
11.3 Introducing RT: Real-Time Market Intelligence
11.4 Available Customizations
11.5 Related Reports
11.6 Author Details
List of Tables (88 Tables)
Table 1 Annual GDP Growth Rate of Major Economies From 2012 to 2016
Table 2 Motor Vehicle Production, By Country, 2015 & 2016
Table 3 Market, By Product Type, 2015�2022 (USD Million)
Table 4 Rivets & Push-In Clips Segment, By Region, 2015�2022 (USD Million)
Table 5 Cable Clips & Ties Segment, By Region, 2015�2022 (USD Million)
Table 6 Threaded Fasteners Segment, By Region, 2015�2022 (USD Million)
Table 7 Washers & Spacers Segment, By Region, 2015�2022 (USD Million)
Table 8 Grommets & Bushings Segment, By Region, 2015�2022 (USD Million)
Table 9 Wall Plugs Segment, By Region, 2015�2022 (USD Million)
Table 10 Other Product Types Segment, By Region, 2015�2022 (USD Million)
Table 11 Market, By End User, 2015�2022 (USD Million)
Table 12 Automotive Segment, By Region, 2015�2022 (USD Million)
Table 13 Electrical & Electronics Segment, By Region, 2015�2022 (USD Million)
Table 14 Building & Construction Segment, By Region, 2015�2022 (USD Million)
Table 15 Supermarkets Segment, By Region, 2015�2022 (USD Million)
Table 16 Other End Users Segment, By Region, 2015�2022 (USD Million)
Table 17 Market, By Region, 2015�2022 (USD Million)
Table 18 Asia Pacific: Market, By Country, 2015�2022 (USD Million)
Table 19 Asia Pacific: Market, By Product Type, 2015�2022 (USD Million)
Table 20 Asia Pacific: Market, By End User, 2015�2022 (USD Million)
Table 21 China: Market, By Product Type, 2015�2022 (USD Million)
Table 22 China: Market, By End User, 2015�2022 (USD Million)
Table 23 Japan: Market, By Product Type, 2015�2022 (USD Million)
Table 24 Japan: Market, By End User, 2015�2022 (USD Million)
Table 25 India: Market, By Product Type, 2015�2022 (USD Million)
Table 26 India: Market, By End User, 2015�2022 (USD Million)
Table 27 South Korea: Market, By Product Type, 2015�2022 (USD Million)
Table 28 South Korea: Market, By End User, 2015�2022 (USD Million)
Table 29 Thailand: Market, By Product Type, 2015�2022 (USD Million)
Table 30 Thailand: Market, By End User, 2015�2022 (USD Million)
Table 31 Indonesia: Market, By Product Type, 2015�2022 (USD Million)
Table 32 Indonesia: Market, By End User, 2015�2022 (USD Million)
Table 33 Malaysia: Market, By Product Type, 2015�2022 (USD Million)
Table 34 Malaysia: Market, By End User, 2015�2022 (USD Million)
Table 35 Rest of Asia Pacific: Market, By Product Type, 2015�2022 (USD Million)
Table 36 Rest of Asia Pacific: Market, By End User, 2015�2022 (USD Million)
Table 37 Europe: Market, By Country, 2015-2022 (USD Million)
Table 38 Europe: Market, By Product Type, 2015-2022 (USD Million)
Table 39 Europe: Market, By End User, 2015�2022 (USD Million)
Table 40 Germany: Market, By Product Type, 2015�2022 (USD Million)
Table 41 Germany: Market, By End User, 2015�2022 (USD Million)
Table 42 France: Market, By Product Type, 2015�2022 (USD Million)
Table 43 France: Market, By End User, 2015�2022 (USD Million)
Table 44 Spain: Market, By Product Type, 2015�2022 (USD Million)
Table 45 Spain: Market, By End User, 2015�2022 (USD Million)
Table 46 UK: Market, By Product Type, 2015�2022 (USD Million)
Table 47 UK: Market, By End User, 2015�2022 (USD Million)
Table 48 Russia: Market, By Product Type, 2015�2022 (USD Million)
Table 49 Russia: Market, By End User, 2015�2022 (USD Million)
Table 50 Italy: Market, By Product Type, 2015�2022 (USD Million)
Table 51 Italy: Market, By End User, 2015�2022 (USD Million)
Table 52 Turkey: Market, By Product Type, 2015�2022 (USD Million)
Table 53 Turkey: Market, By End User, 2015�2022 (USD Million)
Table 54 Poland: Market, By Product Type, 2015�2022 (USD Million)
Table 55 Poland: Market, By End User, 2015�2022 (USD Million)
Table 56 Rest of Europe: Market, By Product Type, 2015�2022 (USD Million)
Table 57 Rest of Europe: Market, By End User, 2015�2022 (USD Million)
Table 58 North America: Market, By Country, 2015�2022 (USD Million)
Table 59 North America: Market, By Product Type, 2015-2022 (USD Million)
Table 60 North America: Market, By End User, 2015�2022 (USD Million)
Table 61 US: Market, By Product Type, 2015-2022 (USD Million)
Table 62 US: Market, By End User, 2015�2022 (USD Million)
Table 63 Mexico: Market, By Product Type, 2015-2022 (USD Million)
Table 64 Mexico: Market, By End User, 2015�2022 (USD Million)
Table 65 Canada: Market, By Product Type, 2015-2022 (USD Million)
Table 66 Canada: Market, By End User, 2015�2022 (USD Million)
Table 67 South America: Market, By Country, 2015�2022 (USD Million)
Table 68 South America: Market, By Product Type, 2015�2022 (USD Million)
Table 69 South America: Market, By End User, 2015�2022 (USD Million)
Table 70 Brazil: Market, By Product Type, 2015�2022 (USD Million)
Table 71 Brazil: Market, By End User, 2015�2022 (USD Million)
Table 72 Argentina: Market, By Product Type, 2015�2022 (USD Million)
Table 73 Argentina: Market, By End User, 2015�2022 (USD Million)
Table 74 Rest of South America: Market, By Product Type, 2015�2022 (USD Million)
Table 75 Rest of South America: Market, By End User, 2015�2022 (USD Million)
Table 76 Middle East & Africa: Market, By Country, 2015-2022 (USD Million)
Table 77 Middle East & Africa: Market, By Product Type, 2015�2022 (USD Million)
Table 78 Middle East & Africa: Market, By End User, 2015�2022 (USD Million)
Table 79 Iran: Market, By Product Type, 2015�2022 (USD Million)
Table 80 Iran: Market, By End User, 2015�2022 (USD Million)
Table 81 South Africa: Market, By Product Type, 2015�2022 (USD Million)
Table 82 South Africa: Market, By End User, 2015�2022 (USD Million)
Table 83 Rest of Middle East & Africa: Market, By Product Type, 2015�2022 (USD Million)
Table 84 Rest of Middle East & Africa: Market, By End User, 2015�2022 (USD Million)
Table 85 Expansions, 2012-2017
Table 86 Acquisitions, 2012- 2017
Table 87 Collaborations, 2012-2017
Table 88 Agreements, 2012-2017
List of Figures (31 Figures)
Figure 1 Plastic Fasteners Market Segmentation
Figure 2 Plastic Fasteners Market: Research Design
Figure 3 Market Size Estimation: Bottom-Up Approach
Figure 4 Market Size Estimation: Top-Down Approach
Figure 5 Plastic Fasteners Market: Data Triangulation
Figure 6 Rivets & Push-In Clips is Projected to Be the Largest Product Type Segment Between 2017 and 2022
Figure 7 Automotive is Expected to Be the Largest End User Segment During the Forecast Period
Figure 8 Asia Pacific is Estimated to Lead the Market in 2017
Figure 9 Growth of the Asia Pacific Automotive Industry is Expected to Drive the Market Between 2017 and 2022
Figure 10 Asia Pacific Market is Projected to Grow at the Highest CAGR During the Forecast Period
Figure 11 Rivets & Push-In Clips Product Type Segment is Estimated to Lead the Asia Pacific Market in 2017
Figure 12 Automotive End User Segment is Estimated to Lead Plastic Fasteners Market in 2017
Figure 13 China is Projected to Lead the Market Between 2017 and 2022
Figure 14 Drivers, Restraints, Opportunities, and Challenges: Plastic Fasteners Market
Figure 15 Plastic Fasteners Market: Porter�s Five Forces Analysis
Figure 16 The Rivets & Push-In Clips Product Type Segment is Projected to Lead the Market During the Forecast Period
Figure 17 The Automotive End User Segment is Projected to Lead the Market During the Forecast Period
Figure 18 Plastic Fasteners Market: Country-Wise Growth
Figure 19 Asia Pacific Plastic Fasteners Market Snapshot
Figure 20 Europe Plastic Fasteners Market Snapshot
Figure 21 North America Plastic Fasteners Market Snapshot
Figure 22 South America Plastic Fasteners Market Snapshot
Figure 23 Middle East & Africa Plastic Fasteners Market Snapshot
Figure 24 Companies in the Market Have Primarily Adopted Various Organic Growth Strategies Between 2012 and 2017
Figure 25 Plastic Fasteners Market Ranking, By Company, 2017
Figure 26 Illinois Tool Works: Company Snapshot
Figure 27 Nifco: Company Snapshot
Figure 28 Stanley Black & Decker: Company Snapshot
Figure 29 Bossard Group: Company Snapshot
Figure 30 Arconic: Company Snapshot
Figure 31 Avery Dennison: Company Snapshot


Growth opportunities and latent adjacency in Plastic Fasteners Market