Polymer Filler Market by Type (Organic: Natural Fibers, & Inorganic: Oxides, Hydroxides, Salts, Silicates, Metals, and Others), and by End User (Automotive, Building & Construction, Industrial, Packaging, and Others) - Global Forecast to 2020


[129 Pages Report] The global polymer filler market size is estimated to reach USD 53.10 Billion by 2020 at a CAGR of 3.3% between 2015 and 2020. The report segments the market by type into (organic: natural fibers, & inorganic: oxides, hydroxides, salts, silicates, and metals), by end users (automotive, building & construction, industrial, and packaging), and by region (Asia-Pacific, North America, Europe, and RoW). The base year considered for the study is 2014, and the forecast period is between 2015 and 2020.
Both top-down and bottom-up approaches have been used to estimate and validate the size of the global market and to estimate the sizes of various other dependent submarkets in the overall polymer filler market. The research study involved extensive use of secondary sources, directories, and databases such as Hoovers, Bloomberg, Chemical Weekly, Factiva, and other government and private websites to identify and collect information useful for the technical, market-oriented, and commercial study of the polymer filler market.
To know about the assumptions considered for the study, download the pdf brochure
The value chain of the polymer filler market starts with mining which has intensive environmental effects. Mineral rocks such as marble, gypsum, limestone, and mica are extracted and transported to the processing site. The processing involves crushing (grinding) of rocks to smaller grains. The processed fillers are further supplied to the end users through distribution channels. Manufacturers consider suppliers and distributors important in this market to increase their business foothold. Raw material suppliers are the calcium carbonate, talc, mica, glass, kaolin, and wollastonite manufacturers and suppliers. Various companies, such as Alpha Chemika, Triveni Chemicals, Axiom Chemicals Private Limited, manufacture calcium carbonate. Companies manufacture calcium carbonate, talc, mica, glass, kaolin and supply it to the polymer fillers manufacturers. Development of newer technology shall also be an opportunity for the polymer filler market. Emerging fillers such as carbon nanotubes and carbon fibers help in increasing the mechanical properties of the polymer matrices without compromising the quality of the polymers. Thus, polymer loading can be increased to higher levels and the cost and volume of polymer used can be reduced.
Key Target Audience:
- Raw material suppliers
- Polymer fillers manufacturers
- Traders, distributors, and polymer fillers suppliers
- Government and regional agencies and research organizations
- Investment research firms
Scope of the Report:
This research report categorizes the global polymer filler market on the basis of application and region.
On the basis of Type & Sub-Type:
- Organics:
- Natural fibers
- Inorganics:
- Oxides
- Hydro-oxides
- Salts
- Silicates
- Metals
- Other types (wood flour, graphite, polyester, PTFE, and aramid fibers)
On the basis of End User:
- Automotive
- Building & construction
- Industrial
- Packaging
- Others end users (medical, recreational, and consumer goods)
On the basis of Region:
- North America
- Europe
- Asia-Pacific
- RoW
The market is further analyzed for the key countries in each of these regions.
Available Customizations:
With the given market data, MarketsandMarkets offers customizations according to the company�s specific needs. The following customization options are available for the report:
Regional Analysis:
- Country-level analysis of the polymer filler market by type
Company Information:
- Detailed analysis and profiling of additional market players
Product Analysis
- Product matrix, which gives a detailed comparison of product portfolio of each company
The global polymer filler market is estimated to reach USD 53.10 Billion by 2020, registering a CAGR of 3.3% between 2015 and 2020. The rising demand of organic fillers such as natural fibers, wood flour, and hemp has forced automotive, construction, and packaging industries of various countries to initiate the use of polymer fillers. High-quality optical properties, improved impact strength, and ability to replace expensive plastic resins make it the preferred material for various applications.
Polymer fillers are of various types, such as natural fibers, oxides, hydro-oxides, salts, silicates, metals, and others. In 2014, the salt segment accounted for the largest market share, in terms of volume, followed by oxides. The rising demand for low-cost fillers in countries, such as the U.S., Germany, India, and Brazil, is expected to increase their demand in the coming years. The recent decline in the oil prices has boosted polymer manufacturing and increasing polymer production is driving the global polymer filler market in the near future. The demand for polymer fillers is estimated to increase with the rise in need for environment-friendly fillers. The use of polymer fillers in emerging applications, such as medical, recreational, and consumer goods are estimated to increase in the future, thus creating growth opportunities in the industry.
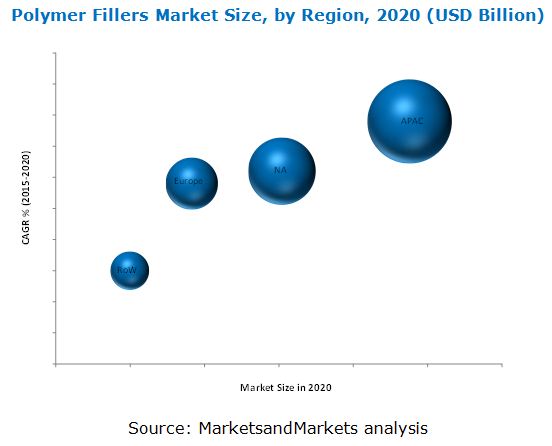
The high demand in Asia-Pacific is due to growth in the building & construction and packaging industries in the last few years. The region accounts for largest share in the polymer filler market globally. North America accounted for the second-largest share in the polymer filler market in 2014. It is a diversified market for polymers due to the presence of large players in the region. The discovery of new gas reserves is expected to increase the investment in chemical and petrochemical projects in the region. Furthermore, polymer fillers are also used in building & construction projects.
The U.S. is the largest producer of polymer fillers worldwide with the presence of manufacturing sites of major industry players in the country. Most of the big players are backward integrated and have the competitive advantage over other suppliers. Threat of new entrants is high in China, India, and other Asia-Pacific countries because of low cost of raw material and labor coupled with low requirement of technical know-how.
Intersegment fillers replacement is restricting the growth of polymer filler market. The polymer manufacturers prefer low-cost fillers to high-quality premium fillers. In addition, the fillers can be interchangeably used depending on the requirements of polymers. For example, glass fibers are expensive; hence, calcium carbonate is used as an alternative for manufacturing polymers for the building & construction industry. Thus, the fillers can be replaced with other materials, affecting the overall market growth in terms of value.
Minerals Technology Inc. has a strong presence in the polymer filler market with its two main products precipitated calcium carbonate and bentonite. The company plans to create a competitive advantage through the strategy of domain research, which means expanding existing businesses and mission research to create new businesses. Through mergers & acquisitions, it is focusing on enhancing its market reach. The acquisition of AMCOL provided the company new growth opportunities with regional expansion and new product development. This helped the company in increasing its revenue as well as market share in the polymer filler market.
To speak to our analyst for a discussion on the above findings, click Speak to Analyst
 Exclusive indicates content/data unique to MarketsandMarkets and not available with any competitors.
Table of Contents
1 Introduction (Page No. - 13)
1.1 Objectives of the Study
1.2 Market Scope
1.2.1 Market Definition
1.2.2 Markets Covered
1.3 Year
1.4 Currency
1.5 Package Size
1.6 Limitations
1.7 Stakeholders
2 Research Methodology (Page No. - 16)
2.1 Research Data
2.1.1 Secondary Data
2.1.1.1 Key Data From Secondary Sources
2.1.2 Primary Data
2.1.2.1 Key Data From Primary Sources
2.1.2.2 Key Industry Insights
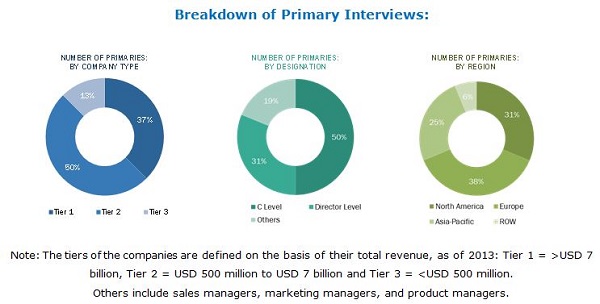
2.1.2.3 Breakdown of Primary Interviews
2.2 Market Size Estimation
2.2.1 Bottom-Up Approach
2.2.2 Top-Down Approach
2.3 Market Breakdown & Data Triangulation
2.4 Research Assumptions
3 Executive Summary (Page No. - 24)
4 Premium Insights (Page No. - 27)
4.1 Attractive Market Opportunity for Polymer Fillers
4.2 Polymer Filler Market Share, By Type, and Region
4.3 Industry Life Cycle Analysis of Polymer Fillers in Different Regions
5 Market Overview (Page No. - 29)
5.1 Introduction
5.2 Segmentation
5.2.1 By Type
5.2.2 By End User
5.3 Market Dynamics
5.3.1 Drivers
5.3.1.1 Growing Demand From Automotive and Industrial Applications
5.3.1.2 Rising Demand for Environmentally-Friendly Fillers
5.3.2 Restraints
5.3.2.1 Intersegment Fillers Replacement
5.3.2.2 Economic Slowdown in Europe
5.3.3 Opportunities
5.3.3.1 Emerging Fillers Such as Carbon Nanotubes and Carbon Fibers
5.3.4 Challenge
5.3.4.1 High Production Cost
6 Industry Trends (Page No. - 35)
6.1 Introduction
6.2 Value-Chain Analysis
6.2.1 Mining & Processing
6.2.2 Transportation
6.2.3 Distribution
6.3 Porter�s Five Forces Analysis
6.3.1 Bargaining Power of Suppliers
6.3.2 Threat of New Entrants
6.3.3 Threat of Substitutes
6.3.4 Bargaining Power of Buyers
6.3.5 Intensity of Competitive Rivalry
7 Polymer Filler Market, By Type (Page No. - 39)
7.1 Introduction
7.2 Organic Fillers
7.2.1 Natural Fibers
7.3 Inorganic Fillers
7.3.1 Oxides
7.3.2 Hydro-Oxides
7.3.3 Salts
7.3.4 Silicates
7.3.5 Metals
7.3.6 Others
8 Polymer Filler Market, By End User (Page No. - 50)
8.1 Introduction
8.2 Automotive
8.3 Building & Construction
8.4 Industrial
8.5 Packaging
8.6 Others
9 Polymer Filler Market, By Region (Page No. - 56)
9.1 Introduction
9.2 North America
9.2.1 U.S.
9.2.2 Rest of North America
9.3 Europe
9.3.1 Germany
9.3.2 France
9.3.3 the Netherlands
9.3.4 U.K.
9.3.5 Rest of Europe
9.4 Asia-Pacific
9.4.1 China
9.4.2 India
9.4.3 Japan
9.4.4 South Korea
9.4.5 Rest of Asia-Pacific
9.5 RoW
9.5.1 Brazil
9.5.2 Rest of RoW
10 Competitive Landscape (Page No. - 98)
10.1 Overview
10.2 New Product Launch and Expansion: Most Popular Growth Strategies Between 2012 and 2015
10.2.1 New Product Launch
10.2.2 Expansion
10.2.3 Agreement
10.2.4 Joint Venture
10.2.5 Merger & Acquisition
11 Company Profiles (Page No. - 104)
11.1 Introduction
(Business Overview, Products & Services, Key Insights, Recent Developments, SWOT Analysis, Ratio Analysis, MnM View)*
11.2 Imerys S.A.
11.3 Lkab Group
11.4 Minerals Technologies Inc.
11.5 OMYA AG
11.6 20micron Ltd.
11.7 Hoffmann Minerals
11.8 GCR Group
11.9 Unimin Corporation
11.10 Quarzwerke Group
11.11 Karntner Montanindustrie Gesellschaft M.B.H.
*Details on Business Overview, Products & Services, Key Insights, Recent Developments, SWOT Analysis, Mnm View Might Not Be Captured in Case of Unlisted Companies.
12 Appendix (Page No. - 122)
12.1 Insights of Industry Experts
12.2 Discussion Guide
12.3 Knowledge Store: Marketsandmarkets� Subscription Portal
12.4 Introducing RT: Real Time Market Intelligence
12.5 Available Customizations
12.6 Related Reports
List of Tables (129 Tables)
Table 1 Polymer Filler Market, By Type
Table 2 Polymer Filler Market, By End User
Table 3 Growing Industrial and Automotive Applications in Asia-Pacific Drives Growth of the Polymer Filler Market
Table 4 Economic Slowdown in Europe and Availability of Substitutes Restrain the Market Growth
Table 5 Emergence of Carbon Nanotubes and Carbon Fibers are Creating Opportunities for Polymer Filler Market
Table 6 High Production Cost is the Key Challenge in the Polymer Filler Market
Table 7 Organic Fillers Market Size, By Region, 2013-2020 (Kiloton)
Table 8 Organic Fillers Market Size, By Region, 2013-2020 (USD Million)
Table 9 Natural Fibers Market Size, By Region, 2013-2020 (Kiloton)
Table 10 Natural Fibers Market Size, By Region, 2013-2020 (USD Million)
Table 11 Inorganic Fillers Market Size, By Region, 2013-2020 (Kiloton)
Table 12 Inorganic Fillers Market Size, By Region, 2013-2020 (USD Million)
Table 13 Oxides Fillers Market Size, By Region, 2013-2020 (Kiloton)
Table 14 Oxides Fillers Market Size, By Region, 2013-2020 (USD Million)
Table 15 Hydro-Oxides Fillers Market Size, By Region, 2013-2020 (Kiloton)
Table 16 Hydro-Oxides Fillers Market Size, By Region, 2013-2020 (USD Million)
Table 17 Salts Fillers Market Size, By Region, 2013-2020 (Kiloton)
Table 18 Salts Fillers Market Size, By Region, 2013-2020 (USD Million)
Table 19 Silicates Fillers Market Size, By Region, 2013-2020 (Kiloton)
Table 20 Silicates Fillers Market Size, By Region, 2013-2020 (USD Million)
Table 21 Metals Fillers Market Size, By Region, 2013-2020 (Kiloton)
Table 22 Metals Fillers Market Size, By Region, 2013-2020 (USD Million)
Table 23 Other Fillers Market Size, By Region, 2013-2020 (Kiloton)
Table 24 Other Fillers Market Size, By Region, 2013-2020 (USD Million)
Table 25 Polymer Filler Market Size in Automotive, By Region, 2013-2020 (Kiloton)
Table 26 Polymer Fillers Market Size in Automotive, By Region, 2013-2020 (USD Million)
Table 27 Polymer Filler Market Size in Building & Construction, By Region, 2013-2020 (Kiloton)
Table 28 Polymer Fillers Market Size in Building & Construction, By Region, 2013-2020 (USD Million)
Table 29 Polymer Filler Market Size in Industrial, By Region, 2013-2020 (Kiloton)
Table 30 Polymer Fillers Market Size in Industrial, By Region, 2013-2020 (USD Million)
Table 31 Polymer Filler Market Size in Packaging, By Region, 2013-2020 (Kiloton)
Table 32 Polymer Fillers Market Size in Packaging, By Region, 2013-2020 (USD Million)
Table 33 Polymer Filler Market Size in Other End Users, By Region, 2013-2020 (Kiloton)
Table 34 Polymer Fillers Market Size in Other End Users, By Region, 2013-2020 (USD Million)
Table 35 Polymer Filler Market Size, By Region, 2013�2020 (Kiloton)
Table 36 Polymer Fillers Market Size, By Region, 2013�2020 (USD Million)
Table 37 North America: Polymer Filler Market Size, By Country, 2013�2020 (Kiloton)
Table 38 North America: Polymer Fillers Market Size, By Country, 2013�2020 (USD Million)
Table 39 North America: Polymer Filler Market Size, By Type, 2013�2020 (Kiloton)
Table 40 North America: Polymer Fillers Market Size, By Type, 2013�2020 (USD Million)
Table 41 North America: Polymer Filler Market Size, By Sub-Type, 2013�2020 (Kiloton)
Table 42 North America: Polymer Fillers Market Size, By Sub-Type, 2013�2020 (USD Million)
Table 43 North America: Polymer Filler Market Size, By End User, 2013�2020 (Kiloton)
Table 44 North America: Polymer Fillers Market Size, By End User, 2013�2020 (USD Million)
Table 45 U.S.: Polymer Filler Market Size, By Type, 2013�2020 (Kiloton)
Table 46 U.S.: Polymer Fillers Market Size, By Type, 2013�2020 (USD Million)
Table 47 U.S.: Polymer Filler Market Size, By Sub-Type, 2013�2020 (Kiloton)
Table 48 U.S.: Polymer Fillers Market Size, By Sub-Type, 2013�2020 (USD Million)
Table 49 Rest of North America: Polymer Filler Market Size, By Type, 2013�2020 (Kiloton)
Table 50 Rest of North America: Polymer Fillers Market Size, By Type, 2013�2020 (USD Million)
Table 51 Rest of North America: Polymer Filler Market Size, By Sub-Type, 2013�2020 (Kiloton)
Table 52 Rest of North America: Market Size, By Sub-Type, 2013�2020 (USD Million)
Table 53 Europe: Polymer Filler Market Size, By Country, 2013�2020 (Kiloton)
Table 54 Europe: Polymer Fillers Market Size, By Country, 2013�2020 (USD Million)
Table 55 Europe: Polymer Filler Market Size, By Type, 2013�2020 (Kiloton)
Table 56 Europe: Polymer Fillers Market Size, By Type, 2013�2020 (USD Million)
Table 57 Europe: Polymer Filler Market Size, By Sub-Type, 2013�2020 (Kiloton)
Table 58 Europe: Polymer Fillers Market Size, By Sub-Type, 2013�2020 (USD Million)
Table 59 Europe: Polymer Filler Market Size, By End User, 2013�2020 (Kiloton)
Table 60 Europe: Polymer Fillers Market Size, By End User, 2013�2020 (USD Million)
Table 61 Germany: Polymer Filler Market Size, By Type, 2013�2020 (Kiloton)
Table 62 Germany: Polymer Fillers Market Size, By Type, 2013�2020 (USD Million)
Table 63 Germany: Polymer Filler Market Size, By Sub-Type, 2013�2020 (Kiloton)
Table 64 Germany: Market Size, By Sub-Type, 2013�2020 (USD Million)
Table 65 France: Polymer Filler Market Size, By Type, 2013�2020 (Kiloton)
Table 66 France: Market Size, By Type, 2013�2020 (USD Million)
Table 67 France: Polymer Filler Market Size, By Sub-Type, 2013�2020 (Kiloton)
Table 68 France: Polymer Fillers Market Size, By Sub-Type, 2013�2020 (USD Million)
Table 69 Netherlands: Polymer Filler Market Size, By Type, 2013�2020 (Kiloton)
Table 70 Netherlands: Polymer Fillers Market Size, By Type, 2013�2020 (USD Million)
Table 71 Netherlands: Polymer Filler Market Size, By Sub-Type, 2013�2020 (Kiloton)
Table 72 Netherlands: Polymer Fillers Market Size, By Sub-Type, 2013�2020 (USD Million)
Table 73 U.K.: Polymer Filler Market Size, By Type, 2013�2020 (Kiloton)
Table 74 U.K.: Polymer Fillers Market Size, By Type, 2013�2020 (USD Million)
Table 75 U.K.: Polymer Filler Market Size, By Sub-Type, 2013�2020 (Kiloton)
Table 76 U.K.: Polymer Fillers Market Size, By Sub-Type, 2013�2020 (USD Million)
Table 77 Rest of Europe: Polymer Filler Market Size, By Type, 2013�2020 (Kiloton)
Table 78 Rest of Europe: Polymer Fillers Market Size, By Type, 2013�2020 (USD Million)
Table 79 Rest of Europe: Polymer Fillers Market Size, By Sub-Type, 2013�2020 (Kiloton)
Table 80 Rest of Europe: Polymer Filler Market Size, By Sub-Type, 2013�2020 (USD Million)
Table 81 Asia-Pacific: Polymer Filler Market Size, By Country, 2013�2020 (Kiloton)
Table 82 Asia-Pacific: Polymer Fillers Market Size, By Country, 2013�2020 (USD Million)
Table 83 Asia-Pacific: Polymer Filler Market Size, By Type, 2013�2020 (Kiloton)
Table 84 Asia-Pacific: Polymer Fillers Market Size, By Type, 2013�2020 (USD Million)
Table 85 Asia-Pacific: Polymer Filler Market Size, By Sub-Type, 2013�2020 (Kiloton)
Table 86 Asia-Pacific: Polymer Filler Market Size, By Sub-Type, 2013�2020 (USD Million)
Table 87 Asia-Pacific: Polymer Fillers Market Size, By End User, 2013�2020 (Kiloton)
Table 88 Asia-Pacific: Polymer Filler Market Size, By End User, 2013�2020 (USD Million)
Table 89 China: Polymer Filler Market Size, By Type, 2013�2020 (Kiloton)
Table 90 China: Polymer Fillers Market Size, By Type, 2013�2020 (USD Million)
Table 91 China: Polymer Filler Market Size, By Sub-Type, 2013�2020 (Kiloton)
Table 92 China: Polymer Fillers Market Size, By Sub-Type, 2013�2020 (USD Million)
Table 93 India: Polymer Filler Market Size, By Type, 2013�2020 (Kiloton)
Table 94 India: Polymer Fillers Market Size, By Type, 2013�2020 (USD Million)
Table 95 India: Polymer Filler Market Size, By Sub-Type, 2013�2020 (Kiloton)
Table 96 India: Polymer Fillers Market Size, By Sub-Type, 2013�2020 (USD Million)
Table 97 Japan: Polymer Filler Market Size, By Type, 2013�2020 (Kiloton)
Table 98 Japan: Polymer Fillers Market Size, By Type, 2013�2020 (USD Million)
Table 99 Japan: Polymer Filler Market Size, By Sub-Type, 2013�2020 (Kiloton)
Table 100 Japan: Polymer Fillers Market Size, By Sub-Type, 2013�2020 (USD Million)
Table 101 South Korea: Polymer Filler Market Size, By Type, 2013�2020 (Kiloton)
Table 102 South Korea: Polymer Filler Market Size, By Type, 2013�2020 (USD Million)
Table 103 South Korea: Polymer Fillers Market Size, By Sub-Type, 2013�2020 (Kiloton)
Table 104 South Korea: Polymer Filler Market Size, By Sub-Type, 2013�2020 (USD Million)
Table 105 Rest of Asia-Pacific: Polymer Fillers Market Size, By Type, 2013�2020 (Kiloton)
Table 106 Rest of Asia-Pacific: Polymer Filler Market Size, By Type, 2013�2020 (USD Million)
Table 107 Rest of Asia-Pacific: Polymer Fillers Market Size, By Sub-Type, 2013�2020 (Kiloton)
Table 108 Rest of Asia-Pacific: Polymer Filler Market Size, By Sub-Type, 2013�2020 (USD Million)
Table 109 RoW: Polymer Fillers Market Size, By Country, 2013�2020 (Kiloton)
Table 110 RoW: Polymer Filler Market Size, By Country, 2013�2020 (USD Million)
Table 111 RoW: Polymer Fillers Market Size, By Type, 2013�2020 (Kiloton)
Table 112 RoW: Polymer Filler Market Size, By Type, 2013�2020 (USD Million)
Table 113 RoW: Polymer Fillers Market Size, By Sub-Type, 2013�2020 (Kiloton)
Table 114 RoW: Polymer Filler Market Size, By Sub-Type, 2013�2020 (USD Million)
Table 115 RoW: Polymer Fillers Market Size, By End User, 2013�2020 (Kiloton)
Table 116 RoW: Polymer Filler Market Size, By End User, 2013�2020 (USD Million)
Table 117 Brazil: Polymer Filler Market Size, By Type, 2013�2020 (Kiloton)
Table 118 Brazil: Polymer Fillers Market Size, By Type, 2013�2020 (USD Million)
Table 119 Brazil: Polymer Filler Market Size, By Sub-Type, 2013�2020 (Kiloton)
Table 120 Brazil: Polymer Fillers Market Size, By Sub-Type, 2013�2020 (USD Million)
Table 121 Rest of RoW: Polymer Filler Market Size, By Type, 2013�2020 (Kiloton)
Table 122 Rest of RoW: Polymer Fillers Market Size, By Type, 2013�2020 (USD Million)
Table 123 Rest of RoW: Polymer Filler Market Size, By Sub-Type, 2013�2020 (Kiloton)
Table 124 Rest of RoW: Polymer Fillers Market Size, By Sub-Type, 2013�2020 (USD Million)
Table 125 New Product Launch
Table 126 Expansion
Table 127 Agreement
Table 128 Joint Venture
Table 129 Merger & Acquisition
List of Figures (32 Figures)
Figure 1 Polymer Filler Market By Type, Application & Region
Figure 2 Research Design
Figure 3 Experts Insights About Polymer Filler Industry
Figure 4 Breakdown of Primary Interviews: By Company Type, Designation, & Region
Figure 5 Market Size Estimation Methodology: Bottom-Up Approach
Figure 6 Market Size Estimation Methodology: Top-Down Approach
Figure 7 Data Triangulation: Polymer Fillers Market
Figure 8 Packaging and Building and Construction Dominate the Polymer Fillers Market
Figure 9 Salts Filler Dominated the Polymer Filler Market in Terms of Value in 2014
Figure 10 Asia-Pacific Dominated the Polymer Filler Market, in Terms of Volume, in 2014
Figure 11 Polymer Filler Market Size, 2015 vs 2020 (USD Million)
Figure 12 Asia-Pacific Projected to Be Most Dominant Region and Salt Fillers are Most Dominant Type (2015�2020)
Figure 13 Asia-Pacific Projected to Dominate the Polymer Fillers Market (2015�2020)
Figure 14 European Polymer Fillers Market is in A Maturity Phase
Figure 15 Polymer Filler Market: Market Dynamics
Figure 16 Polymer Fillers Market: Value-Chain Analysis
Figure 17 Porter�s Five Forces Analysis
Figure 18 Salt Fillers Dominate the Polymer Filler Market
Figure 19 Packaging Industry Dominates the Polymer Filler Market
Figure 20 India and China are Emerging as New Hotspots for Polymer Filler Consumption
Figure 21 Increase in the Consumption of Polymer Fillers in North America
Figure 22 China Dominates the Consumption of Polymer Fillers in Asia-Pacific
Figure 23 New Product Launch, and Expansion, Were the Key Strategies Adopted By Companies Between 2012 and 2015
Figure 24 New Product Launch, and Expansion: Preferred Growth Strategies Adopted By Major Companies Between 2012 and 2015
Figure 25 New Product Launch and Expansion Strategies Contributedto the Major Market Share, 2012�2015
Figure 26 Regional Revenue Mix of Major Market Players
Figure 27 Imerys S.A.: Company Snapshot
Figure 28 Imerys S.A.: SWOT Analysis
Figure 29 Lkab: Company Snapshot
Figure 30 Lkab: SWOT Analysis
Figure 31 Minerals Technologies Inc.: Company Snapshot
Figure 32 Minerals Technologies Inc.: SWOT Analysis


Growth opportunities and latent adjacency in Polymer Filler Market