Masterbatch Market

Masterbatch Market by Type (Color, Additive, White, Black, Filler), Polymer (PP, LDPE & LLDPE, HDPE, PVC, PET, PUR, PS), Application (Packaging, Building & Construction, Automotive, Consumer Goods, Textile, Agriculture), & Region - Global Forecast to 2028

Report Code: CH 2607 Jan, 2024, by marketsandmarkets.com

The masterbatch market size was USD 12.9 billion in 2023 and is projected to reach USD 16.8 billion by 2028, at a CAGR of 5.4% during the forecast period. The types of masterbatches are color, additive, black, white, and filler, and are used in polymers such as HDPE, PVC, PET, PP, LDPE & LLDPE, PS, and PUR. The major applications considered of masterbatch are building & construction, automotive, consumer goods, packaging, textile, and agriculture. The stringent regulations by the government against the use of hazardous products can act as a challenge for the players in the masterbatch market. However, the use of new and innovative technologies to reduce the impact of environmental hazards can provide growth opportunities for the manufacturing players of the masterbatch market. Although the non-biodegradability of plastics is affecting the market, the growth in emerging economies is expected to provide immense opportunities to manufacturers of masterbatch.

Masterbatch Market

To know about the assumptions considered for the study, Request for Free Sample Report

Masterbatch Market

Market Dynamics

Driver: Replacement of metals with plastics in automotive applications

In the past five years, although the growth of the automotive industry in this region has remained steady, there has been a significant increase in the use of lightweight materials for the production of vehicles. The increase in the consumption of plastics in automotive applications positively influences the growth of the masterbatch market. Masterbatches, especially color and additive, are widely used in coloring automotive plastics for use in the interior and exterior components of vehicles.

Restraints: Longer lead time and need for exposure to heat

Masterbatch pellets are manufactured using resins that are different to the resins used in the final end-product. Due to the dissimilarity in resins, there can be chances of change in the processing characteristics of these resins. The end users tend to always use these dissimilar resins when they lack any technical knowledge. For example, EVA and LDPE are often used as the concentrate carrier for linear medium-density polythene (LMDPE), high-density polyethylene (HDPE), polypropylene (PP), high-density crosslinked polyethylene (XLHDPE), and nylon. Styrene has been used as the concentrate carrier of SAN, ABS, and even polycarbonate.

Opportunities: High demand for masterbatches in black polyester fibers

Polyester fibers are used in the textile and automotive sectors.  In the automotive industry, it is used in applications such as roof lining, interior cladding, and seat covers. Polyester fibers made from PET (polyethylene terephthalate) receive their desired properties by adding functional additives and pigments, generally in the form of black masterbatches.  For these applications, an industrially manufactured, hi-tech black masterbatch, which is physically and chemically specified and produced under controlled processing conditions, is used. The growing urbanization and introduction of premium automotive brands in the leading economies of Asia Pacific are expected to fuel the growth of black masterbatch in the coming years.

Challenge: Non-biodegradability of plastics

Recycled plastics are mixed with certain additives such as flame retardants, stabilizers, and coloring agents and are toxic in nature. They are non-biodegradable, standing as a challenge to the masterbatch manufacturers in the plastic industry. Also, there are certain regulations pertaining to the use of plastics. For instance, Europe has imposed a ban on single-use plastics, considering the issues with recycling. This challenge can impact the use of plastics in high-growth applications such as packaging.

Masterbatch Market Ecosystem

The masterbatch ecosystem includes companies manufacturing raw materials such as pigments, additives, and other base polymers. The major manufacturers of Masterbatch are Ampacet Corporation, LyondellBasell, Avient Corporation, and Cabot Corporation. Masterbatch is a blend of pigments, additives, and polymer materials used to impart color and strengthen the properties of plastics, which find various applications in the automotive, construction, consumer goods, and other industries. The use of masterbatch is mainly driven by the building & construction and packaging industries.

Masterbatch Market Ecosystem

Based on the type, color was the largest segment of the masterbatch market, in terms of value, in 2022.

The color masterbatch segment accounted for the largest share, in terms of value, of the overall masterbatch market in 2022. Color masterbatch adds attractive shades of color and improves the efficiency of products. Standard color imparts standard color to plastics. They are readily available in basic colors, such as blue, green, red, and yellow. Specialty color masterbatches are used for high visibility applications and are readily available with manufacturers. It can be further segmented into pearlescent, fluorescent, metallic, and phosphorescent. Similarly, tailor-made color is customized color based on consumer demand. It is used to meet the specific color requirements of users.

Based on Polymer, PP was the largest segment of the masterbatch market, in terms of value, in 2022.

PP is a thermoplastic polymer having a lower density and higher softening point than PE. There are three types of thermoplastic polymers: homopolymers, block copolymers, and random copolymers. PP is used in rigid packaging, which includes caps & closure of PET bottles and thin-walled containers of yogurts. Countries such as China, India, Japan, South Korea, and Taiwan are major consumers and producers of polypropylene in the region. The increasing focus on sustainable and recyclable materials is also driving the demand for polypropylene in Asia Pacific.

Based on application, packaging was the largest segment of the masterbatch market, in terms of value, in 2022.

The need for packaging in the food & beverage, personal care, medical, household, electrical & electronics, building & construction, automotive, and other industries drives the masterbatch market. Packaging is widely used for the protection and transportation of goods. The increase in handling and transportation of goods due to globalization, liberalization, changing consumer lifestyles, and economic development has led to a rise in the demand for better protection and handling of goods. The availability of a wide variety of plastics and their adherence to regulatory standards make them the most extensively used material for packaging. Plastic can be molded, extruded, blown, and cast into films, sheets, foams, and pellets.

Asia Pacific accounted for the largest market share of the masterbatch market, in terms of value, in 2022.

China accounted for the largest consumer of masterbatch in the Asia Pacific region. India is projected to grow at the highest CAGR, in terms of both value and volume in the Asia Pacific region, during the forecast period. Asia pacific offers great growth opportunities to different market players in various countries. The ever-growing population in Asia Pacific, along with the adoption of modern technologies, innovations, easy availability of inexpensive land, easy availability of raw materials, and cheap labor costs are expected to lead to significant market growth in the region. The growth of industries such as packaging, textile, building & construction, automotive, consumer goods, and agriculture is increasing the demand for masterbatch.

Masterbatch Market by Region

To know about the assumptions considered for the study, download the pdf brochure

Key Market Players

The key players in this market are Avient Corporation (US), Ampacet Corporation (US), LyondellBasell Industries Holdings B.V. (US), Cabot Corporation (US), Plastika Kritis S.A. (Greece), Plastiblends (India), Hubron International (UK), Tosaf Group Ltd (Israel), Penn Color, Inc. (US), and Americhem (US).and others. These are the key manufacturers that secured a major market share in the last few years.

Get online access to the report on the World's First Market Intelligence Cloud

  • Easy to Download Historical Data & Forecast Numbers
  • Company Analysis Dashboard for high growth potential opportunities
  • Research Analyst Access for customization & queries
  • Competitor Analysis with Interactive dashboard
  • Latest News, Updates & Trend analysis
Request Sample

Scope of the Report

Report Metric

Details

Years considered for the study

2017–2028

Base year considered

2022

Forecast period

2023–2028

Units considered

Value (USD Million)

Segments Covered

Type, Polymer, Application, and Region

Regions covered

Asia Pacific, North America, Europe, Middle East & Africa, and South America

Companies profiled

The key players profiled in the report are Avient Corporation (US), Ampacet Corporation (US), LyondellBasell Industries Holdings B.V. (US), Cabot Corporation (US), Plastika Kritis S.A. (Greece), Plastiblends (India), Hubron International (UK), Tosaf Group Ltd (Israel), Penn Color, Inc. (US), and Americhem (US) and others.

This report categorizes the global masterbatch market based on type, polymer, application, and region.

On the basis of Type, the Masterbatch market has been segmented as follows:
  • Color
  • Additives
  • White
  • Black
  • Fillers
On the basis of Polymer, the Masterbatch market has been segmented as follows:
  • PP
  • LDPE & LLDPE
  • HDPE
  • PVC
  • PUR
  • PET
  • PS
  • Others
On the basis of Application, the Masterbatch market has been segmented as follows:
  • Packaging
  • Building & Construction
  • Consumer Goods
  • Automotive
  • Textiles
  • Agriculture
  • Others
On the basis of region, the Masterbatch market has been segmented as follows:
  • Asia Pacific
  • North America
  • Europe
  • Middle East & Arica
  • South America

Recent Developments

  • In December 2023, Ampacet introduced ColorMark, a masterbatch additive technology that enables processors to create permanent lettering and designs in intricate detail on dark plastic surfaces.
  • In November 2023, Cabot Corporation announced the launch of its new REPLASBLAK product family of circular black masterbatches with certified material. With this launch, Cabot introduced three products which will be sold as the company’s first-ever International Sustainability & Carbon Certification (ISCC PLUS) certified black masterbatch products powered by EVOLVE Sustainable Solutions.
  • In November 2023, Americhem announced a new partnership with Nexeo Plastics for engineered compounds’ distribution across North America. Effective November 1, 2023, Nexeo Plastics will serve as the preferred distributor of Americhem’s full range of engineered compounds in North America, encompassing Canada, Mexico, Puerto Rico, and the US.
  • In November 2023, Sukano AG partnered with PlastiColors to meet the growing market demand for PET packaging in South Africa.
  • In November 2023, LyondellBasell announced the establishment of a new distribution hub in the UK for its polyolefin grades. This strategic move is part of the company’s ongoing commitment to enhancing the customer experience by placing inventories closer to its customers’ facilities, thus reducing lead times on orders.

Frequently Asked Questions (FAQ):

To speak to our analyst for a discussion on the above findings, click Speak to Analyst

TABLE OF CONTENTS
 
1 INTRODUCTION (Page No. - 45)
    1.1 STUDY OBJECTIVES 
    1.2 MARKET DEFINITION 
           1.2.1 MASTERBATCH MARKET: INCLUSIONS AND EXCLUSIONS
           1.2.2 MARKET DEFINITION AND INCLUSIONS, BY TYPE
           1.2.3 MARKET DEFINITION AND INCLUSIONS, BY POLYMER
           1.2.4 MARKET DEFINITION AND INCLUSIONS, BY APPLICATION
    1.3 STUDY SCOPE 
           1.3.1 MASTERBATCH MARKET SEGMENTATION
           1.3.2 REGIONS COVERED
           1.3.3 YEARS CONSIDERED
    1.4 CURRENCY CONSIDERED 
    1.5 UNITS CONSIDERED 
    1.6 STAKEHOLDERS 
    1.7 SUMMARY OF CHANGES 
    1.8 IMPACT OF RECESSION 
 
2 RESEARCH METHODOLOGY (Page No. - 51)
    2.1 RESEARCH DATA 
          FIGURE 1 MASTERBATCH MARKET: RESEARCH DESIGN
           2.1.1 SECONDARY DATA
           2.1.2 PRIMARY DATA
                    2.1.2.1 Primary interviews - demand and supply sides
                    2.1.2.2 Key industry insights
                    2.1.2.3 Breakdown of primary interviews
    2.2 MARKET SIZE ESTIMATION 
           2.2.1 BOTTOM-UP APPROACH
                    FIGURE 2 MARKET SIZE ESTIMATION METHODOLOGY: APPROACH 1 (SUPPLY SIDE): COLLECTIVE SHARE OF KEY COMPANIES
                    FIGURE 3 MARKET SIZE ESTIMATION METHODOLOGY: APPROACH 2 (SUPPLY SIDE): COLLECTIVE REVENUE OF ALL PRODUCTS
                    FIGURE 4 MARKET SIZE ESTIMATION METHODOLOGY: APPROACH 3 (DEMAND SIDE): BY POLYMER TYPE (BOTTOM-UP)
           2.2.2 TOP-DOWN APPROACH
                    FIGURE 5 MARKET SIZE ESTIMATION METHODOLOGY: TOP-DOWN APPROACH
    2.3 DATA TRIANGULATION 
          FIGURE 6 MASTERBATCH MARKET: DATA TRIANGULATION
    2.4 GROWTH RATE ASSUMPTIONS/GROWTH FORECAST 
           2.4.1 SUPPLY-SIDE ANALYSIS
                    FIGURE 7 MARKET GROWTH PROJECTION: SUPPLY SIDE
           2.4.2 DEMAND-SIDE ANALYSIS
                    FIGURE 8 MARKET GROWTH PROJECTION: DEMAND-SIDE DRIVERS AND OPPORTUNITIES
    2.5 ASSUMPTIONS 
    2.6 FACTOR ANALYSIS 
    2.7 IMPACT OF RECESSION 
    2.8 LIMITATIONS 
    2.9 RISK ASSESSMENT 
          TABLE 1 MASTERBATCH MARKET: RISK ASSESSMENT
 
3 EXECUTIVE SUMMARY (Page No. - 62)
    FIGURE 9 COLOR MASTERBATCH TO ACCOUNT FOR LARGEST MARKET SHARE DURING FORECAST PERIOD
    FIGURE 10 PP TO ACCOUNT FOR LARGEST SHARE OF MASTERBATCH MARKET DURING FORECAST PERIOD
    FIGURE 11 PACKAGING TO BE LARGEST APPLICATION OF MASTERBATCH MARKET DURING FORECAST PERIOD
    FIGURE 12 ASIA PACIFIC TO REGISTER HIGHEST CAGR DURING FORECAST PERIOD
 
4 PREMIUM INSIGHTS (Page No. - 66)
    4.1 ATTRACTIVE OPPORTUNITIES FOR PLAYERS IN MASTERBATCH MARKET 
          FIGURE 13 ASIA PACIFIC TO LEAD MASTERBATCH MARKET DURING FORECAST PERIOD
    4.2 MASTERBATCH MARKET, BY REGION 
          FIGURE 14 ASIA PACIFIC TO DOMINATE MARKET DURING FORECAST PERIOD
    4.3 ASIA PACIFIC MASTERBATCH MARKET, BY APPLICATION AND COUNTRY 
          FIGURE 15 CHINA ACCOUNTED FOR LARGEST MARKET SHARE IN 2022
    4.4 MASTERBATCH MARKET, APPLICATION VS. REGION 
          FIGURE 16 PACKAGING SEGMENT LED MASTERBATCH MARKET ACROSS REGIONS IN 2022
    4.5 MASTERBATCH MARKET, BY KEY COUNTRIES 
          FIGURE 17 INDIA TO BE FASTEST-GROWING MARKET DURING FORECAST PERIOD
 
5 MARKET OVERVIEW (Page No. - 69)
    5.1 INTRODUCTION 
    5.2 MARKET DYNAMICS 
          FIGURE 18 DRIVERS, RESTRAINTS, OPPORTUNITIES, AND CHALLENGES IN MASTERBATCH MARKET
           5.2.1 DRIVERS
                    5.2.1.1 Replacement of metals with plastics in automotive applications
                    5.2.1.2 Widely preferred coloring method
           5.2.2 RESTRAINTS
                    5.2.2.1 Availability of low-quality and cheaper products
                    5.2.2.2 Longer lead time and need for exposure to heat
           5.2.3 OPPORTUNITIES
                    5.2.3.1 Growth of end-use industries in emerging economies
                    5.2.3.2 Increasing demand for biodegradable masterbatch
                    5.2.3.3 High demand for masterbatches in black polyester fibers
           5.2.4 CHALLENGES
                    5.2.4.1 Non-biodegradability of plastics
    5.3 PORTER'S FIVE FORCES ANALYSIS 
          FIGURE 19 MASTERBATCH MARKET: PORTER'S FIVE FORCES ANALYSIS
           5.3.1 THREAT OF SUBSTITUTES
           5.3.2 THREAT OF NEW ENTRANTS
           5.3.3 BARGAINING POWER OF SUPPLIERS
           5.3.4 BARGAINING POWER OF BUYERS
           5.3.5 INTENSITY OF COMPETITIVE RIVALRY
                    TABLE 2 MASTERBATCH MARKET: PORTER'S FIVE FORCES ANALYSIS
    5.4 MACROECONOMIC INDICATORS 
           5.4.1 GDP TRENDS AND FORECAST FOR MAJOR ECONOMIES
                    TABLE 3 GDP TRENDS AND FORECAST OF MAJOR ECONOMIES, 2020–2028 (USD BILLION)
 
6 INDUSTRY TRENDS (Page No. - 76)
    6.1 SUPPLY CHAIN ANALYSIS 
           FIGURE 20 MASTERBATCH MARKET: SUPPLY CHAIN ANALYSIS
           6.1.1 RAW MATERIAL
           6.1.2 FORMULATION
           6.1.3 TYPE
           6.1.4 END-USE INDUSTRIES
    6.2 TRENDS/DISRUPTIONS IMPACTING CUSTOMER BUSINESS 
           FIGURE 21 REVENUE SHIFT AND NEW REVENUE POCKETS IN MASTERBATCH MARKET
    6.3 ECOSYSTEM ANALYSIS 
           FIGURE 22 MASTERBATCH MARKET: ECOSYSTEM MAPPING
           TABLE 4 MASTERBATCH MARKET: ROLE IN ECOSYSTEM
    6.4 CASE STUDIES 
           6.4.1 CASE STUDY ON SUPERFEET INSOLES
           6.4.2 CASE STUDY ON MASTERBATCH USED IN AUTOMOTIVE NONWOVEN FIBERS
           6.4.3 CASE STUDY ON MASTERBATCH USED IN CLOSURES FOR CONSUMER SOFT DRINKS
    6.5 TECHNOLOGY ANALYSIS 
    6.6 KEY STAKEHOLDERS AND BUYING CRITERIA 
           6.6.1 KEY STAKEHOLDERS IN BUYING PROCESS
                    FIGURE 23 INFLUENCE OF STAKEHOLDERS IN BUYING PROCESS FOR TOP THREE APPLICATIONS
                    TABLE 5 INFLUENCE OF STAKEHOLDERS IN BUYING PROCESS FOR TOP THREE APPLICATIONS (%)
           6.6.2 BUYING CRITERIA
                    FIGURE 24 KEY BUYING CRITERIA FOR TOP THREE APPLICATIONS
                    TABLE 6 KEY BUYING CRITERIA FOR TOP THREE APPLICATIONS
    6.7 PRICING ANALYSIS 
           6.7.1 AVERAGE SELLING PRICE TREND, BY REGION
                    FIGURE 25 AVERAGE SELLING PRICE TREND OF MASTERBATCH, BY REGION (USD/KG)
                    TABLE 7 AVERAGE SELLING PRICE TREND OF MASTERBATCH, BY REGION (USD/KG)
           6.7.2 AVERAGE SELLING PRICE TREND OF KEY PLAYERS, BY APPLICATION
                    FIGURE 26 AVERAGE SELLING PRICE TREND OF KEY PLAYERS, BY APPLICATION
                    TABLE 8 AVERAGE SELLING PRICE TREND OF KEY PLAYERS, BY APPLICATION (USD/KG)
    6.8 TRADE DATA STATISTICS 
           6.8.1 IMPORT SCENARIO OF MASTERBATCH
                    FIGURE 27 IMPORT OF MASTERBATCH, BY KEY COUNTRIES (2013–2022)
                    TABLE 9 IMPORT OF MASTERBATCH, BY REGION, 2013–2022 (USD MILLION)
           6.8.2 EXPORT SCENARIO OF MASTERBATCH
                    FIGURE 28 EXPORT OF MASTERBATCH, BY KEY COUNTRIES (2013–2022)
                    TABLE 10 EXPORT OF MASTERBATCH, BY REGION, 2013–2022 (USD MILLION)
    6.9 TARIFF AND REGULATORY LANDSCAPE 
           6.9.1 REGULATIONS FOR MASTERBATCH
           6.9.2 REGULATORY BODIES, GOVERNMENT AGENCIES, AND OTHER ORGANIZATIONS
    6.10 KEY CONFERENCES & EVENTS, 2024–2025 
           TABLE 11 MASTERBATCH MARKET: DETAILED LIST OF CONFERENCES & EVENTS
    6.11 PATENT ANALYSIS 
           6.11.1 APPROACH
           6.11.2 DOCUMENT TYPE
                     TABLE 12 STATUS OF PATENTS
                     FIGURE 29 PATENTS REGISTERED, 2013–2023
                     FIGURE 30 PATENT PUBLICATION TRENDS, 2013–2023
                     FIGURE 31 LEGAL STATUS OF PATENTS
           6.11.3 JURISDICTION ANALYSIS
                     FIGURE 32 MAXIMUM PATENTS FILED IN JURISDICTION OF US
           6.11.4 TOP APPLICANTS
                     FIGURE 33 DOW INC. REGISTERED MAXIMUM NUMBER OF PATENTS BETWEEN 2013 AND 2023
                     TABLE 13 LIST OF PATENTS BY DOW INC.
                     TABLE 14 LIST OF PATENTS BY BOREALIS AG
                     TABLE 15 TOP 10 PATENT OWNERS IN US, 2013–2023
 
7 MASTERBATCH MARKET, BY TYPE (Page No. - 94)
    7.1 INTRODUCTION 
          FIGURE 34 COLOR SEGMENT TO ACCOUNT FOR LARGEST MARKET SHARE DURING FORECAST PERIOD
          TABLE 16 MASTERBATCH MARKET, BY TYPE, 2017–2021 (USD MILLION)
          TABLE 17 MASTERBATCH MARKET, BY TYPE, 2022–2028 (USD MILLION)
          TABLE 18 MASTERBATCH MARKET, BY TYPE, 2017–2021 (KILOTON)
          TABLE 19 MASTERBATCH MARKET, BY TYPE, 2022–2028 (KILOTON)
    7.2 COLOR MASTERBATCH 
           7.2.1 GROWING FOCUS ON QUALITY AND CONSISTENCY OF END-USE PRODUCTS TO DRIVE MARKET
           7.2.2 STANDARD COLOR
           7.2.3 SPECIALTY COLOR
                    7.2.3.1 Metallic
                    7.2.3.2 Pearlescent
                    7.2.3.3 Fluorescent
                    7.2.3.4 Phosphorescent
           7.2.4 TAILOR-MADE COLORS
                    TABLE 20 COLOR MASTERBATCH MARKET, BY REGION, 2017–2021 (USD MILLION)
                    TABLE 21 COLOR MASTERBATCH MARKET, BY REGION, 2022–2028 (USD MILLION)
                    TABLE 22 COLOR MASTERBATCH MARKET, BY REGION, 2017–2021 (KILOTON)
                    TABLE 23 COLOR MASTERBATCH MARKET, BY REGION, 2022–2028 (KILOTON)
    7.3 ADDITIVE MASTERBATCH 
           7.3.1 INCREASING DEMAND FOR ADDITIVES IN PLASTIC PROCESSING APPLICATIONS
           7.3.2 ANTIMICROBIAL ADDITIVE
           7.3.3 ANTIOXIDANT ADDITIVE
                    7.3.3.1 Primary
                    7.3.3.2 Secondary
                    7.3.3.3 Primary & secondary
           7.3.4 FLAME RETARDANT
           7.3.5 UV STABILIZER
           7.3.6 FOAMING AGENT/BLOWING AGENT
           7.3.7 OPTICAL BRIGHTENER
           7.3.8 NUCLEATING AGENT
                    TABLE 24 ADDITIVE MASTERBATCH MARKET, BY REGION, 2017–2021 (USD MILLION)
                    TABLE 25 ADDITIVE MASTERBATCH MARKET, BY REGION, 2022–2028 (USD MILLION)
                    TABLE 26 ADDITIVE MASTERBATCH MARKET, BY REGION, 2017–2021 (KILOTON)
                    TABLE 27 ADDITIVE MASTERBATCH MARKET, BY REGION, 2022–2028 (KILOTON)
    7.4 WHITE MASTERBATCH 
           7.4.1 INCREASING DEMAND FOR CONSUMER PLASTIC PRODUCTS TO SUPPORT MARKET GROWTH
                    TABLE 28 WHITE MASTERBATCH MARKET, BY REGION, 2017–2021 (USD MILLION)
                    TABLE 29 WHITE MASTERBATCH MARKET, BY REGION, 2022–2028 (USD MILLION)
                    TABLE 30 WHITE MASTERBATCH MARKET, BY REGION, 2017–2021 (KILOTON)
                    TABLE 31 WHITE MASTERBATCH MARKET, BY REGION, 2022–2028 (KILOTON)
    7.5 BLACK MASTERBATCH 
           7.5.1 HIGH DEMAND IN BUILDING & CONSTRUCTION TO FUEL MARKET GROWTH
                    TABLE 32 BLACK MASTERBATCH MARKET, BY REGION, 2017–2021 (USD MILLION)
                    TABLE 33 BLACK MASTERBATCH MARKET, BY REGION, 2022–2028 (USD MILLION)
                    TABLE 34 BLACK MASTERBATCH MARKET, BY REGION, 2017–2021 (KILOTON)
                    TABLE 35 BLACK MASTERBATCH MARKET, BY REGION, 2022–2028 (KILOTON)
    7.6 FILLER MASTERBATCH 
           7.6.1 FILLER MASTERBATCH USED TO REDUCE COST OF PLASTIC PRODUCTS
                    TABLE 36 FILLER MASTERBATCH MARKET, BY REGION, 2017–2021 (USD MILLION)
                    TABLE 37 FILLER MASTERBATCH MARKET, BY REGION, 2022–2028 (USD MILLION)
                    TABLE 38 FILLER MASTERBATCH MARKET, BY REGION, 2017–2021 (KILOTON)
                    TABLE 39 FILLER MASTERBATCH MARKET, BY REGION, 2022–2028 (KILOTON)
 
8 MASTERBATCH MARKET, BY POLYMER (Page No. - 107)
    8.1 INTRODUCTION 
          FIGURE 35 PP TO BE LARGEST POLYMER SEGMENT DURING FORECAST PERIOD
          TABLE 40 MASTERBATCH MARKET, BY POLYMER, 2017–2021 (USD MILLION)
          TABLE 41 MASTERBATCH MARKET, BY POLYMER, 2022–2028 (USD MILLION)
          TABLE 42 MASTERBATCH MARKET, BY POLYMER, 2017–2021 (KILOTON)
          TABLE 43 MASTERBATCH MARKET, BY POLYMER, 2022–2028 (KILOTON)
    8.2 POLYPROPYLENE (PP) 
           8.2.1 ASIA PACIFIC TO BE LARGEST MARKET IN PP SEGMENT
                    TABLE 44 PP: MASTERBATCH MARKET, BY REGION, 2017–2021 (USD MILLION)
                    TABLE 45 PP: MASTERBATCH MARKET, BY REGION, 2022–2028 (USD MILLION)
                    TABLE 46 PP: MASTERBATCH MARKET, BY REGION, 2017–2021 (KILOTON)
                    TABLE 47 PP: MASTERBATCH MARKET, BY REGION, 2022–2028 (KILOTON)
    8.3 LOW-DENSITY POLYETHYLENE & LINEAR LOW-DENSITY POLYETHYLENE (LDPE & LLDPE) 
           8.3.1 OFFERS HIGHER COMPATIBILITY WITH MASTERBATCH TO PRODUCE WIDE RANGE OF PLASTIC PRODUCTS
                    TABLE 48 LDPE & LLDPE: MASTERBATCH MARKET, BY REGION, 2017–2021 (USD MILLION)
                    TABLE 49 LDPE & LLDPE: MASTERBATCH MARKET, BY REGION, 2022–2028 (USD MILLION)
                    TABLE 50 LDPE & LLDPE: MASTERBATCH MARKET, BY REGION, 2017–2021 (KILOTON)
                    TABLE 51 LDPE & LLDPE: MASTERBATCH MARKET, BY REGION, 2022–2028 (KILOTON)
    8.4 HIGH-DENSITY POLYETHYLENE (HDPE) 
           8.4.1 HDPE OFFERS HIGH STRENGTH-TO-DENSITY RATIO
                    TABLE 52 HDPE: MASTERBATCH MARKET, BY REGION, 2017–2021 (USD MILLION)
                    TABLE 53 HDPE: MASTERBATCH MARKET, BY REGION, 2022–2028 (USD MILLION)
                    TABLE 54 HDPE: MASTERBATCH MARKET, BY REGION, 2017–2021 (KILOTON)
                    TABLE 55 HDPE: MASTERBATCH MARKET, BY REGION, 2022–2028 (KILOTON)
    8.5 POLYVINYL CHLORIDE (PVC) 
           8.5.1 EASY AVAILABILITY AND LOW PRICE OF PVC PROPELLING MARKET GROWTH
                    TABLE 56 PVC: MASTERBATCH MARKET, BY REGION, 2017–2021 (USD MILLION)
                    TABLE 57 PVC: MASTERBATCH MARKET, BY REGION, 2022–2028 (USD MILLION)
                    TABLE 58 PVC: MASTERBATCH MARKET, BY REGION, 2017–2021 (KILOTON)
                    TABLE 59 PVC: MASTERBATCH MARKET, BY REGION, 2022–2028 (KILOTON)
    8.6 POLYURETHANE (PUR) 
           8.6.1 INCREASING DEMAND IN AUTOMOTIVE, FURNITURE, CONSTRUCTION, AND FOOTWEAR APPLICATIONS TO DRIVE MARKET
                    TABLE 60 PUR: MASTERBATCH MARKET, BY REGION, 2017–2021 (USD MILLION)
                    TABLE 61 PUR: MASTERBATCH MARKET, BY REGION, 2022–2028 (USD MILLION)
                    TABLE 62 PUR: MASTERBATCH MARKET, BY REGION, 2017–2021 (KILOTON)
                    TABLE 63 PUR: MASTERBATCH MARKET, BY REGION, 2022–2028 (KILOTON)
    8.7 POLYETHYLENE TEREPHTHALATE (PET) 
           8.7.1 RISING DEMAND IN PACKAGING APPLICATIONS TO SUPPORT MARKET GROWTH
                    TABLE 64 PET: MASTERBATCH MARKET, BY REGION, 2017–2021 (USD MILLION)
                    TABLE 65 PET: MASTERBATCH MARKET, BY REGION, 2022–2028 (USD MILLION)
                    TABLE 66 PET: MASTERBATCH MARKET, BY REGION, 2017–2021 (KILOTON)
                    TABLE 67 PET: MASTERBATCH MARKET, BY REGION, 2022–2028 (KILOTON)
    8.8 POLYSTYRENE (PS) 
           8.8.1 EXCELLENT THERMAL & DIMENSIONAL STABILITY OF PS FACILITATING MARKET GROWTH
                    TABLE 68 PS: MASTERBATCH MARKET, BY REGION, 2017–2021 (USD MILLION)
                    TABLE 69 PS: MASTERBATCH MARKET, BY REGION, 2022–2028 (USD MILLION)
                    TABLE 70 PS: MASTERBATCH MARKET, BY REGION, 2017–2021 (KILOTON)
                    TABLE 71 PS: MASTERBATCH MARKET, BY REGION, 2022–2028 (KILOTON)
    8.9 OTHER APPLICATIONS 
           8.9.1 POLYCARBONATE (PC)
           8.9.2 ACRYLONITRILE BUTADIENE STYRENE (ABS)
           8.9.3 POLYAMIDE (PA)
                    TABLE 72 OTHER POLYMERS: MASTERBATCH MARKET, BY REGION, 2017–2021 (USD MILLION)
                    TABLE 73 OTHER POLYMERS: MASTERBATCH MARKET, BY REGION, 2022–2028 (USD MILLION)
                    TABLE 74 OTHER POLYMERS: MASTERBATCH MARKET, BY REGION, 2017–2021 (KILOTON)
                    TABLE 75 OTHER POLYMERS: MASTERBATCH MARKET, BY REGION, 2022–2028 (KILOTON)
 
9 MASTERBATCH MARKET, BY APPLICATION (Page No. - 124)
    9.1 INTRODUCTION 
          FIGURE 36 PACKAGING TO BE LARGEST APPLICATION OF MASTERBATCH DURING FORECAST PERIOD
          TABLE 76 MASTERBATCH MARKET, BY APPLICATION, 2017–2021 (USD MILLION)
          TABLE 77 MASTERBATCH MARKET, BY APPLICATION, 2022–2028 (USD MILLION)
          TABLE 78 MASTERBATCH MARKET, BY APPLICATION, 2017–2021 (KILOTON)
          TABLE 79 MASTERBATCH MARKET, BY APPLICATION, 2022–2028 (KILOTON)
    9.2 PACKAGING 
           9.2.1 CHANGING CONSUMER LIFESTYLE AND ECONOMIC DEVELOPMENT TO DRIVE MARKET
           9.2.2 RIGID PACKAGING
           9.2.3 FLEXIBLE PACKAGING
                    TABLE 80 PACKAGING: MASTERBATCH MARKET, BY REGION, 2017–2021 (USD MILLION)
                    TABLE 81 PACKAGING: MASTERBATCH MARKET, BY REGION, 2022–2028 (USD MILLION)
                    TABLE 82 PACKAGING: MASTERBATCH MARKET, BY REGION, 2017–2021 (KILOTON)
                    TABLE 83 PACKAGING: MASTERBATCH MARKET, BY REGION, 2022–2028 (KILOTON)
    9.3 BUILDING & CONSTRUCTION 
           9.3.1 INCREASING DEMAND TO IMPROVE PRODUCT DURABILITY AND CONSISTENCY TO FUEL DEMAND
           9.3.2 PIPES & FITTINGS
           9.3.3 DOORS & WINDOWS
           9.3.4 FENCES & FENESTRATIONS
           9.3.5 SIDING
                    TABLE 84 BUILDING & CONSTRUCTION: MASTERBATCH MARKET, BY REGION, 2017–2021 (USD MILLION)
                    TABLE 85 BUILDING & CONSTRUCTION: MASTERBATCH MARKET, BY REGION, 2022–2028 (USD MILLION)
                    TABLE 86 BUILDING & CONSTRUCTION: MASTERBATCH MARKET, BY REGION, 2017–2021 (KILOTON)
                    TABLE 87 BUILDING & CONSTRUCTION: MASTERBATCH MARKET, BY REGION, 2022–2028 (KILOTON)
    9.4 CONSUMER GOODS 
           9.4.1 INCREASING DEMAND FOR THERMOPLASTIC MATERIALS IN FOOTWEAR TO DRIVE MARKET
           9.4.2 ELECTRONICS
           9.4.3 FURNITURE
           9.4.4 FOOTWEAR
                    TABLE 88 CONSUMER GOODS: MASTERBATCH MARKET, BY REGION, 2017–2021 (USD MILLION)
                    TABLE 89 CONSUMER GOODS: MASTERBATCH MARKET, BY REGION, 2022–2028 (USD MILLION)
                    TABLE 90 CONSUMER GOODS: MASTERBATCH MARKET, BY REGION, 2017–2021 (KILOTON)
                    TABLE 91 CONSUMER GOODS: MASTERBATCH MARKET, BY REGION, 2022–2028 (KILOTON)
    9.5 AUTOMOTIVE 
           9.5.1 IMPLEMENTATION OF STRINGENT REGULATIONS AND WEIGHT REDUCTION OF VEHICLES TO FUEL DEMAND
           9.5.2 EXTERIOR
           9.5.3 INTERIOR
                    TABLE 92 AUTOMOTIVE: MASTERBATCH MARKET, BY REGION, 2017–2021 (USD MILLION)
                    TABLE 93 AUTOMOTIVE: MASTERBATCH MARKET, BY REGION, 2022–2028 (USD MILLION)
                    TABLE 94 AUTOMOTIVE: MASTERBATCH MARKET, BY REGION, 2017–2021 (KILOTON)
                    TABLE 95 AUTOMOTIVE: MASTERBATCH MARKET, BY REGION, 2022–2028 (KILOTON)
    9.6 TEXTILE 
           9.6.1 DEMAND FOR ADDITIVE MASTERBATCH INCREASING IN TEXTILES
                    TABLE 96 TEXTILE: MASTERBATCH MARKET, BY REGION, 2017–2021 (USD MILLION)
                    TABLE 97 TEXTILE: MASTERBATCH MARKET, BY REGION, 2022–2028 (USD MILLION)
                    TABLE 98 TEXTILE: MASTERBATCH MARKET, BY REGION, 2017–2021 (KILOTON)
                    TABLE 99 TEXTILE: MASTERBATCH MARKET, BY REGION, 2022–2028 (KILOTON)
    9.7 AGRICULTURE 
           9.7.1 TECHNOLOGICAL ADVANCEMENTS IN AGRICULTURE SECTOR TO SUPPORT MARKET GROWTH
                    TABLE 100 AGRICULTURE: MASTERBATCH MARKET, BY REGION, 2017–2021 (USD MILLION)
                    TABLE 101 AGRICULTURE: MASTERBATCH MARKET, BY REGION, 2022–2028 (USD MILLION)
                    TABLE 102 AGRICULTURE: MASTERBATCH MARKET, BY REGION, 2017–2021 (KILOTON)
                    TABLE 103 AGRICULTURE: MASTERBATCH MARKET, BY REGION, 2022–2028 (KILOTON)
    9.8 OTHER APPLICATIONS 
          TABLE 104 OTHER APPLICATIONS: MASTERBATCH MARKET, BY REGION, 2017–2021 (USD MILLION)
          TABLE 105 OTHER APPLICATIONS: MASTERBATCH MARKET, BY REGION, 2022–2028 (USD MILLION)
          TABLE 106 OTHER APPLICATIONS: MASTERBATCH MARKET, BY REGION, 2017–2021 (KILOTON)
          TABLE 107 OTHER APPLICATIONS: MASTERBATCH MARKET, BY REGION, 2022–2028 (KILOTON)
 
10 MASTERBATCH MARKET, BY REGION (Page No. - 140)
     10.1 INTRODUCTION 
             FIGURE 37 ASIA PACIFIC TO BE FASTEST-GROWING MASTERBATCH MARKET DURING FORECAST PERIOD
             TABLE 108 MASTERBATCH MARKET, BY REGION, 2017–2021 (USD MILLION)
             TABLE 109 MASTERBATCH MARKET, BY REGION, 2022–2028 (USD MILLION)
             TABLE 110 MASTERBATCH MARKET, BY REGION, 2017–2021 (KILOTON)
             TABLE 111 MASTERBATCH MARKET, BY REGION, 2022–2028 (KILOTON)
     10.2 ASIA PACIFIC 
             FIGURE 38 ASIA PACIFIC: MASTERBATCH MARKET SNAPSHOT
             10.2.1 RECESSION IMPACT
             10.2.2 ASIA PACIFIC: MASTERBATCH MARKET, BY TYPE
                        TABLE 112 ASIA PACIFIC: MASTERBATCH MARKET, BY TYPE, 2017–2021 (USD MILLION)
                        TABLE 113 ASIA PACIFIC: MASTERBATCH MARKET, BY TYPE, 2022–2028 (USD MILLION)
                        TABLE 114 ASIA PACIFIC: MASTERBATCH MARKET, BY TYPE, 2017–2021 (KILOTON)
                        TABLE 115 ASIA PACIFIC: MASTERBATCH MARKET, BY TYPE, 2022–2028 (KILOTON)
             10.2.3 ASIA PACIFIC: MASTERBATCH MARKET, BY POLYMER
                        TABLE 116 ASIA PACIFIC: MASTERBATCH MARKET, BY POLYMER, 2017–2021 (USD MILLION)
                        TABLE 117 ASIA PACIFIC: MASTERBATCH MARKET, BY POLYMER, 2022–2028 (USD MILLION)
                        TABLE 118 ASIA PACIFIC: MASTERBATCH MARKET, BY POLYMER, 2017–2021 (KILOTON)
                        TABLE 119 ASIA PACIFIC: MASTERBATCH MARKET, BY POLYMER, 2022–2028 (KILOTON)
             10.2.4 ASIA PACIFIC: MASTERBATCH MARKET, BY APPLICATION
                        TABLE 120 ASIA PACIFIC: MASTERBATCH MARKET, BY APPLICATION, 2017–2021 (USD MILLION)
                        TABLE 121 ASIA PACIFIC: MASTERBATCH MARKET, BY APPLICATION, 2022–2028 (USD MILLION)
                        TABLE 122 ASIA PACIFIC: MASTERBATCH MARKET, BY APPLICATION, 2017–2021 (KILOTON)
                        TABLE 123 ASIA PACIFIC: MASTERBATCH MARKET, BY APPLICATION, 2022–2028 (KILOTON)
             10.2.5 ASIA PACIFIC: MASTERBATCH MARKET, BY COUNTRY
                        TABLE 124 ASIA PACIFIC: MASTERBATCH MARKET, BY COUNTRY, 2017–2021 (USD MILLION)
                        TABLE 125 ASIA PACIFIC: MASTERBATCH MARKET, BY COUNTRY, 2022–2028 (USD MILLION)
                        TABLE 126 ASIA PACIFIC: MASTERBATCH MARKET, BY COUNTRY, 2017–2021 (KILOTON)
                        TABLE 127 ASIA PACIFIC: MASTERBATCH MARKET, BY COUNTRY, 2022–2028 (KILOTON)
                        10.2.5.1 China
                                     10.2.5.1.1 Presence of major manufacturing industries to drive demand
                                                      TABLE 128 CHINA: MASTERBATCH MARKET, BY APPLICATION, 2017–2021 (USD MILLION)
                                                      TABLE 129 CHINA: MASTERBATCH MARKET, BY APPLICATION, 2022–2028 (USD MILLION)
                                                      TABLE 130 CHINA: MASTERBATCH MARKET, BY APPLICATION, 2017–2021 (KILOTON)
                                                      TABLE 131 CHINA: MASTERBATCH MARKET, BY APPLICATION, 2022–2028 (KILOTON)
                        10.2.5.2 Japan
                                     10.2.5.2.1 Increase in demand for color and additive masterbatches
                                                      TABLE 132 JAPAN: MASTERBATCH MARKET, BY APPLICATION, 2017–2021 (USD MILLION)
                                                      TABLE 133 JAPAN: MASTERBATCH MARKET, BY APPLICATION, 2022–2028 (USD MILLION)
                                                      TABLE 134 JAPAN: MASTERBATCH MARKET, BY APPLICATION, 2017–2021 (KILOTON)
                                                      TABLE 135 JAPAN: MASTERBATCH MARKET, BY APPLICATION, 2022–2028 (KILOTON)
                        10.2.5.3 India
                                     10.2.5.3.1 Emerging industries to generate demand for masterbatch
                                                      TABLE 136 INDIA: MASTERBATCH MARKET, BY APPLICATION, 2017–2021 (USD MILLION)
                                                      TABLE 137 INDIA: MASTERBATCH MARKET, BY APPLICATION, 2022–2028 (USD MILLION)
                                                      TABLE 138 INDIA: MASTERBATCH MARKET, BY APPLICATION, 2017–2021 (KILOTON)
                                                      TABLE 139 INDIA: MASTERBATCH MARKET, BY APPLICATION, 2022–2028 (KILOTON)
                        10.2.5.4 South Korea
                                     10.2.5.4.1 Increase in consumption of plastics to drive demand
                                                      TABLE 140 SOUTH KOREA: MASTERBATCH MARKET, BY APPLICATION, 2017–2021 (USD MILLION)
                                                      TABLE 141 SOUTH KOREA: MASTERBATCH MARKET, BY APPLICATION, 2022–2028 (USD MILLION)
                                                      TABLE 142 SOUTH KOREA: MASTERBATCH MARKET, BY APPLICATION, 2017–2021 (KILOTON)
                                                      TABLE 143 SOUTH KOREA: MASTERBATCH MARKET, BY APPLICATION, 2022–2028 (KILOTON)
                        10.2.5.5 Taiwan
                                     10.2.5.5.1 Presence of large plastics manufacturing industry to fuel market growth
                                                      TABLE 144 TAIWAN: MASTERBATCH MARKET, BY APPLICATION, 2017–2021 (USD MILLION)
                                                      TABLE 145 TAIWAN: MASTERBATCH MARKET, BY APPLICATION, 2022–2028 (USD MILLION)
                                                      TABLE 146 TAIWAN: MASTERBATCH MARKET, BY APPLICATION, 2017–2021 (KILOTON)
                                                      TABLE 147 TAIWAN: MASTERBATCH MARKET, BY APPLICATION, 2022–2028 (KILOTON)
                        10.2.5.6 Australia & New Zealand
                                     10.2.5.6.1 Rise in demand for packaging applications to drive growth
                                                      TABLE 148 AUSTRALIA & NEW ZEALAND: MASTERBATCH MARKET, BY APPLICATION, 2017–2021 (USD MILLION)
                                                      TABLE 149 AUSTRALIA & NEW ZEALAND: MASTERBATCH MARKET, BY APPLICATION, 2022–2028 (USD MILLION)
                                                      TABLE 150 AUSTRALIA & NEW ZEALAND: MASTERBATCH MARKET, BY APPLICATION, 2017–2021 (KILOTON)
                                                      TABLE 151 AUSTRALIA & NEW ZEALAND: MASTERBATCH MARKET, BY APPLICATION, 2022–2028 (KILOTON)
                        10.2.5.7 Indonesia
                                     10.2.5.7.1 Increase in demand for plastics in building & construction and food packaging industries to drive demand
                                                      TABLE 152 INDONESIA: MASTERBATCH MARKET, BY APPLICATION, 2017–2021 (USD MILLION)
                                                      TABLE 153 INDONESIA: MASTERBATCH MARKET, BY APPLICATION, 2022–2028 (USD MILLION)
                                                      TABLE 154 INDONESIA: MASTERBATCH MARKET, BY APPLICATION, 2017–2021 (KILOTON)
                                                      TABLE 155 INDONESIA: MASTERBATCH MARKET, BY APPLICATION, 2022–2028 (KILOTON)
     10.3 NORTH AMERICA 
             FIGURE 39 NORTH AMERICA: MASTERBATCH MARKET SNAPSHOT
             10.3.1 RECESSION IMPACT
             10.3.2 NORTH AMERICA: MASTERBATCH MARKET, BY TYPE
                        TABLE 156 NORTH AMERICA: MASTERBATCH MARKET, BY TYPE, 2017–2021 (USD MILLION)
                        TABLE 157 NORTH AMERICA: MASTERBATCH MARKET, BY TYPE, 2022–2028 (USD MILLION)
                        TABLE 158 NORTH AMERICA: MASTERBATCH MARKET, BY TYPE, 2017–2021 (KILOTON)
                        TABLE 159 NORTH AMERICA: MASTERBATCH MARKET, BY TYPE, 2022–2028 (KILOTON)
             10.3.3 NORTH AMERICA: MASTERBATCH MARKET, BY POLYMER
                        TABLE 160 NORTH AMERICA: MASTERBATCH MARKET, BY POLYMER, 2017–2021 (USD MILLION)
                        TABLE 161 NORTH AMERICA: MASTERBATCH MARKET, BY POLYMER, 2022–2028 (USD MILLION)
                        TABLE 162 NORTH AMERICA: MASTERBATCH MARKET, BY POLYMER, 2017–2021 (KILOTON)
                        TABLE 163 NORTH AMERICA: MASTERBATCH MARKET, BY POLYMER, 2022–2028 (KILOTON)
             10.3.4 NORTH AMERICA: MASTERBATCH MARKET, BY APPLICATION
                        TABLE 164 NORTH AMERICA: MASTERBATCH MARKET, BY APPLICATION, 2017–2021 (USD MILLION)
                        TABLE 165 NORTH AMERICA: MASTERBATCH MARKET, BY APPLICATION, 2022–2028 (USD MILLION)
                        TABLE 166 NORTH AMERICA: MASTERBATCH MARKET, BY APPLICATION, 2017–2021 (KILOTON)
                        TABLE 167 NORTH AMERICA: MASTERBATCH MARKET, BY APPLICATION, 2022–2028 (KILOTON)
             10.3.5 NORTH AMERICA: MASTERBATCH MARKET, BY COUNTRY
                        TABLE 168 NORTH AMERICA: MASTERBATCH MARKET, BY COUNTRY, 2017–2021 (USD MILLION)
                        TABLE 169 NORTH AMERICA: MASTERBATCH MARKET, BY COUNTRY, 2022–2028 (USD MILLION)
                        TABLE 170 NORTH AMERICA: MASTERBATCH MARKET, BY COUNTRY, 2017–2021 (KILOTON)
                        TABLE 171 NORTH AMERICA: MASTERBATCH MARKET, BY COUNTRY, 2022–2028 (KILOTON)
                        10.3.5.1 US
                                     10.3.5.1.1 Presence of established players to drive market
                                                      TABLE 172 US: MASTERBATCH MARKET, BY APPLICATION, 2017–2021 (USD MILLION)
                                                      TABLE 173 US: MASTERBATCH MARKET, BY APPLICATION, 2022–2028 (USD MILLION)
                                                      TABLE 174 US: MASTERBATCH MARKET, BY APPLICATION, 2017–2021 (KILOTON)
                                                      TABLE 175 US: MASTERBATCH MARKET, BY APPLICATION, 2022–2028 (KILOTON)
                        10.3.5.2 Canada
                                     10.3.5.2.1 Anticipated growth in automotive industry to drive market
                                                      TABLE 176 CANADA: MASTERBATCH MARKET, BY APPLICATION, 2017–2021 (USD MILLION)
                                                      TABLE 177 CANADA: MASTERBATCH MARKET, BY APPLICATION, 2022–2028 (USD MILLION)
                                                      TABLE 178 CANADA: MASTERBATCH MARKET, BY APPLICATION, 2017–2021 (KILOTON)
                                                      TABLE 179 CANADA: MASTERBATCH MARKET, BY APPLICATION, 2022–2028 (KILOTON)
                        10.3.5.3 Mexico
                                     10.3.5.3.1 Increase in manufacturing activities to drive market
                                                      TABLE 180 MEXICO: MASTERBATCH MARKET, BY APPLICATION, 2017–2021 (USD MILLION)
                                                      TABLE 181 MEXICO: MASTERBATCH MARKET, BY APPLICATION, 2022–2028 (USD MILLION)
                                                      TABLE 182 MEXICO: MASTERBATCH MARKET, BY APPLICATION, 2017–2021 (KILOTON)
                                                      TABLE 183 MEXICO: MASTERBATCH MARKET, BY APPLICATION, 2022–2028 (KILOTON)
     10.4 EUROPE 
            FIGURE 40 EUROPE: MASTERBATCH MARKET SNAPSHOT
             10.4.1 RECESSION IMPACT
             10.4.2 EUROPE: MASTERBATCH MARKET, BY TYPE
                        TABLE 184 EUROPE: MASTERBATCH MARKET, BY TYPE, 2017–2021 (USD MILLION)
                        TABLE 185 EUROPE: MASTERBATCH MARKET, BY TYPE, 2022–2028 (USD MILLION)
                        TABLE 186 EUROPE: MASTERBATCH MARKET, BY TYPE, 2017–2021 (KILOTON)
                        TABLE 187 EUROPE: MASTERBATCH MARKET, BY TYPE, 2022–2028 (KILOTON)
             10.4.3 EUROPE: MASTERBATCH MARKET, BY POLYMER
                        TABLE 188 EUROPE: MASTERBATCH MARKET, BY POLYMER, 2017–2021 (USD MILLION)
                        TABLE 189 EUROPE: MASTERBATCH MARKET, BY POLYMER, 2022–2028 (USD MILLION)
                        TABLE 190 EUROPE: MASTERBATCH MARKET, BY POLYMER, 2017–2021 (KILOTON)
                        TABLE 191 EUROPE: MASTERBATCH MARKET, BY POLYMER, 2022–2028 (KILOTON)
             10.4.4 EUROPE: MASTERBATCH MARKET, BY APPLICATION
                        TABLE 192 EUROPE: MASTERBATCH MARKET, BY APPLICATION, 2017–2021 (USD MILLION)
                        TABLE 193 EUROPE: MASTERBATCH MARKET, BY APPLICATION, 2022–2028 (USD MILLION)
                        TABLE 194 EUROPE: MASTERBATCH MARKET, BY APPLICATION, 2017–2021 (KILOTON)
                        TABLE 195 EUROPE: MASTERBATCH MARKET, BY APPLICATION, 2022–2028 (KILOTON)
             10.4.5 EUROPE: MASTERBATCH MARKET, BY COUNTRY
                        TABLE 196 EUROPE: MASTERBATCH MARKET, BY COUNTRY, 2017–2021 (USD MILLION)
                        TABLE 197 EUROPE: MASTERBATCH MARKET, BY COUNTRY, 2022–2028 (USD MILLION)
                        TABLE 198 EUROPE: MASTERBATCH MARKET, BY COUNTRY, 2017–2021 (KILOTON)
                        TABLE 199 EUROPE: MASTERBATCH MARKET, BY COUNTRY, 2022–2028 (KILOTON)
                        10.4.5.1 Germany
                                     10.4.5.1.1 Increase in automotive production to bring opportunities for masterbatch manufacturers
                                                      TABLE 200 GERMANY: MASTERBATCH MARKET, BY APPLICATION, 2017–2021 (USD MILLION)
                                                      TABLE 201 GERMANY: MASTERBATCH MARKET, BY APPLICATION, 2022–2028 (USD MILLION)
                                                      TABLE 202 GERMANY: MASTERBATCH MARKET, BY APPLICATION, 2017–2021 (KILOTON)
                                                      TABLE 203 GERMANY: MASTERBATCH MARKET, BY APPLICATION, 2022–2028 (KILOTON)
                        10.4.5.2 Italy
                                     10.4.5.2.1 Growth in demand for packaging in food & beverage industry
                                                      TABLE 204 ITALY: MASTERBATCH MARKET, BY APPLICATION, 2017–2021 (USD MILLION)
                                                      TABLE 205 ITALY: MASTERBATCH MARKET, BY APPLICATION, 2022–2028 (USD MILLION)
                                                      TABLE 206 ITALY: MASTERBATCH MARKET, BY APPLICATION, 2017–2021 (KILOTON)
                                                      TABLE 207 ITALY: MASTERBATCH MARKET, BY APPLICATION, 2022–2028 (KILOTON)
                        10.4.5.3 UK
                                     10.4.5.3.1 Stringent government regulations and slow economic growth to result in low demand for masterbatch
                                                      TABLE 208 UK: MASTERBATCH MARKET, BY APPLICATION, 2017–2021 (USD MILLION)
                                                      TABLE 209 UK: MASTERBATCH MARKET, BY APPLICATION, 2022–2028 (USD MILLION)
                                                      TABLE 210 UK: MASTERBATCH MARKET, BY APPLICATION, 2017–2021 (KILOTON)
                                                      TABLE 211 UK: MASTERBATCH MARKET, BY APPLICATION, 2022–2028 (KILOTON)
                        10.4.5.4 France
                                     10.4.5.4.1 Large plastic manufacturing and packaging sectors
                                                      TABLE 212 FRANCE: MASTERBATCH MARKET, BY APPLICATION, 2017–2021 (USD MILLION)
                                                      TABLE 213 FRANCE: MASTERBATCH MARKET, BY APPLICATION, 2022–2028 (USD MILLION)
                                                      TABLE 214 FRANCE: MASTERBATCH MARKET, BY APPLICATION, 2017–2021 (KILOTON)
                                                      TABLE 215 FRANCE: MASTERBATCH MARKET, BY APPLICATION, 2022–2028 (KILOTON)
                        10.4.5.5 Poland
                                     10.4.5.5.1 Growth in manufacturing sector to drive market
                                                      TABLE 216 POLAND: MASTERBATCH MARKET, BY APPLICATION, 2017–2021 (USD MILLION)
                                                      TABLE 217 POLAND: MASTERBATCH MARKET, BY APPLICATION, 2022–2028 (USD MILLION)
                                                      TABLE 218 POLAND: MASTERBATCH MARKET, BY APPLICATION, 2017–2021 (KILOTON)
                                                      TABLE 219 POLAND: MASTERBATCH MARKET, BY APPLICATION, 2022–2028 (KILOTON)
                        10.4.5.6 Spain
                                     10.4.5.6.1 Increase in demand for thermoplastics in automotive applications
                                                      TABLE 220 SPAIN: MASTERBATCH MARKET, BY APPLICATION, 2017–2021 (USD MILLION)
                                                      TABLE 221 SPAIN: MASTERBATCH MARKET, BY APPLICATION, 2022–2028 (USD MILLION)
                                                      TABLE 222 SPAIN: MASTERBATCH MARKET, BY APPLICATION, 2017–2021 (KILOTON)
                                                      TABLE 223 SPAIN: MASTERBATCH MARKET, BY APPLICATION, 2022–2028 (KILOTON)
                        10.4.5.7 Benelux
                                     10.4.5.7.1 Food packaging industry to drive demand
                                                      TABLE 224 BENELUX: MASTERBATCH MARKET, BY APPLICATION, 2017–2021 (USD MILLION)
                                                      TABLE 225 BENELUX: MASTERBATCH MARKET, BY APPLICATION, 2022–2028 (USD MILLION)
                                                      TABLE 226 BENELUX: MASTERBATCH MARKET, BY APPLICATION, 2017–2021 (KILOTON)
                                                      TABLE 227 BENELUX: MASTERBATCH MARKET, BY APPLICATION, 2022–2028 (KILOTON)
     10.5 MIDDLE EAST & AFRICA 
             10.5.1 RECESSION IMPACT
             10.5.2 MIDDLE EAST & AFRICA: MASTERBATCH MARKET, BY TYPE
                        TABLE 228 MIDDLE EAST & AFRICA: MASTERBATCH MARKET, BY TYPE, 2017–2021 (USD MILLION)
                        TABLE 229 MIDDLE EAST & AFRICA: MASTERBATCH MARKET, BY TYPE, 2022–2028 (USD MILLION)
                        TABLE 230 MIDDLE EAST & AFRICA: MASTERBATCH MARKET, BY TYPE, 2017–2021 (KILOTON)
                        TABLE 231 MIDDLE EAST & AFRICA: MASTERBATCH MARKET, BY TYPE, 2022–2028 (KILOTON)
             10.5.3 MIDDLE EAST & AFRICA: MASTERBATCH MARKET, BY POLYMER
                        TABLE 232 MIDDLE EAST & AFRICA: MASTERBATCH MARKET, BY POLYMER, 2017–2021 (USD MILLION)
                        TABLE 233 MIDDLE EAST & AFRICA: MASTERBATCH MARKET, BY POLYMER, 2022–2028 (USD MILLION)
                        TABLE 234 MIDDLE EAST & AFRICA: MASTERBATCH MARKET, BY POLYMER, 2017–2021 (KILOTON)
                        TABLE 235 MIDDLE EAST & AFRICA: MASTERBATCH MARKET, BY POLYMER, 2022–2028 (KILOTON)
             10.5.4 MIDDLE EAST & AFRICA: MASTERBATCH MARKET, BY APPLICATION
                        TABLE 236 MIDDLE EAST & AFRICA: MASTERBATCH MARKET, BY APPLICATION, 2017–2021 (USD MILLION)
                        TABLE 237 MIDDLE EAST & AFRICA: MASTERBATCH MARKET, BY APPLICATION, 2022–2028 (USD MILLION)
                        TABLE 238 MIDDLE EAST & AFRICA: MASTERBATCH MARKET, BY APPLICATION, 2017–2021 (KILOTON)
                        TABLE 239 MIDDLE EAST & AFRICA: MASTERBATCH MARKET, BY APPLICATION, 2022–2028 (KILOTON)
             10.5.5 MIDDLE EAST & AFRICA: MASTERBATCH MARKET, BY COUNTRY
                        TABLE 240 MIDDLE EAST & AFRICA: MASTERBATCH MARKET, BY COUNTRY, 2017–2021 (USD MILLION)
                        TABLE 241 MIDDLE EAST & AFRICA: MASTERBATCH MARKET, BY COUNTRY, 2022–2028 (USD MILLION)
                        TABLE 242 MIDDLE EAST & AFRICA: MASTERBATCH MARKET, BY COUNTRY, 2017–2021 (KILOTON)
                        TABLE 243 MIDDLE EAST & AFRICA: MASTERBATCH MARKET, BY COUNTRY, 2022–2028 (KILOTON)
                        10.5.5.1 GCC
                        10.5.5.2 Saudi Arabia
                                     10.5.5.2.1 Rise in demand for plastics in building & construction industry to drive market
                                                      TABLE 244 SAUDI ARABIA: MASTERBATCH MARKET, BY APPLICATION, 2017–2021 (USD MILLION)
                                                      TABLE 245 SAUDI ARABIA: MASTERBATCH MARKET, BY APPLICATION, 2022–2028 (USD MILLION)
                                                      TABLE 246 SAUDI ARABIA: MASTERBATCH MARKET, BY APPLICATION, 2017–2021 (KILOTON)
                                                      TABLE 247 SAUDI ARABIA: MASTERBATCH MARKET, BY APPLICATION, 2022–2028 (KILOTON)
                        10.5.5.3 Iran
                                     10.5.5.3.1 Growth of industrial sector to impact masterbatch market
                                                      TABLE 248 IRAN: MASTERBATCH MARKET, BY APPLICATION, 2017–2021 (USD MILLION)
                                                      TABLE 249 IRAN: MASTERBATCH MARKET, BY APPLICATION, 2022–2028 (USD MILLION)
                                                      TABLE 250 IRAN: MASTERBATCH MARKET, BY APPLICATION, 2017–2021 (KILOTON)
                                                      TABLE 251 IRAN: MASTERBATCH MARKET, BY APPLICATION, 2022–2028 (KILOTON)
                        10.5.5.4 South Africa
                                     10.5.5.4.1 Increasing demand from automotive sector to support market growth
                                                      TABLE 252 SOUTH AFRICA: MASTERBATCH MARKET, BY APPLICATION, 2017–2021 (USD MILLION)
                                                      TABLE 253 SOUTH AFRICA: MASTERBATCH MARKET, BY APPLICATION, 2022–2028 (USD MILLION)
                                                      TABLE 254 SOUTH AFRICA: MASTERBATCH MARKET, BY APPLICATION, 2017–2021 (KILOTON)
                                                      TABLE 255 SOUTH AFRICA: MASTERBATCH MARKET, BY APPLICATION, 2022–2028 (KILOTON)
     10.6 SOUTH AMERICA 
             10.6.1 RECESSION IMPACT
             10.6.2 SOUTH AMERICA: MASTERBATCH MARKET, BY TYPE
                        TABLE 256 SOUTH AMERICA: MASTERBATCH MARKET, BY TYPE, 2017–2021 (USD MILLION)
                        TABLE 257 SOUTH AMERICA: MASTERBATCH MARKET, BY TYPE, 2022–2028 (USD MILLION)
                        TABLE 258 SOUTH AMERICA: MASTERBATCH MARKET, BY TYPE, 2017–2021 (KILOTON)
                        TABLE 259 SOUTH AMERICA: MASTERBATCH MARKET, BY TYPE, 2022–2028 (KILOTON)
             10.6.3 SOUTH AMERICA: MASTERBATCH MARKET, BY POLYMER
                        TABLE 260 SOUTH AMERICA: MASTERBATCH MARKET, BY POLYMER, 2017–2021 (USD MILLION)
                        TABLE 261 SOUTH AMERICA: MASTERBATCH MARKET, BY POLYMER, 2022–2028 (USD MILLION)
                        TABLE 262 SOUTH AMERICA: MASTERBATCH MARKET, BY POLYMER, 2017–2021 (KILOTON)
                        TABLE 263 SOUTH AMERICA: MASTERBATCH MARKET, BY POLYMER, 2022–2028 (KILOTON)
             10.6.4 SOUTH AMERICA: MASTERBATCH MARKET, BY APPLICATION
                        TABLE 264 SOUTH AMERICA: MASTERBATCH MARKET, BY APPLICATION, 2017–2021 (USD MILLION)
                        TABLE 265 SOUTH AMERICA: MASTERBATCH MARKET, BY APPLICATION, 2022–2028 (USD MILLION)
                        TABLE 266 SOUTH AMERICA: MASTERBATCH MARKET, BY APPLICATION, 2017–2021 (KILOTON)
                        TABLE 267 SOUTH AMERICA: MASTERBATCH MARKET, BY APPLICATION, 2022–2028 (KILOTON)
             10.6.5 SOUTH AMERICA: MASTERBATCH MARKET, BY COUNTRY
                        TABLE 268 SOUTH AMERICA: MASTERBATCH MARKET, BY COUNTRY, 2017–2021 (USD MILLION)
                        TABLE 269 SOUTH AMERICA: MASTERBATCH MARKET, BY COUNTRY, 2022–2028 (USD MILLION)
                        TABLE 270 SOUTH AMERICA: MASTERBATCH MARKET, BY COUNTRY, 2017–2021 (KILOTON)
                        TABLE 271 SOUTH AMERICA: MASTERBATCH MARKET, BY COUNTRY, 2022–2028 (KILOTON)
                        10.6.5.1 Brazil
                                     10.6.5.1.1 Growing population and increase in consumer spending to drive demand
                                                      TABLE 272 BRAZIL: MASTERBATCH MARKET, BY APPLICATION, 2017–2021 (USD MILLION)
                                                      TABLE 273 BRAZIL: MASTERBATCH MARKET, BY APPLICATION, 2022–2028 (USD MILLION)
                                                      TABLE 274 BRAZIL: MASTERBATCH MARKET, BY APPLICATION, 2017–2021 (KILOTON)
                                                      TABLE 275 BRAZIL: MASTERBATCH MARKET, BY APPLICATION, 2022–2028 (KILOTON)
                        10.6.5.2 Argentina
                                     10.6.5.2.1 Rise in per capita consumption of plastics to drive market
                                                      TABLE 276 ARGENTINA: MASTERBATCH MARKET, BY APPLICATION, 2017–2021 (USD MILLION)
                                                      TABLE 277 ARGENTINA: MASTERBATCH MARKET, BY APPLICATION, 2022–2028 (USD MILLION)
                                                      TABLE 278 ARGENTINA: MASTERBATCH MARKET, BY APPLICATION, 2017–2021 (KILOTON)
                                                      TABLE 279 ARGENTINA: MASTERBATCH MARKET, BY APPLICATION, 2022–2028 (KILOTON)
                        10.6.5.3 Chile
                                     10.6.5.3.1 Growth in construction and automotive industries to drive market
                                                      TABLE 280 CHILE: MASTERBATCH MARKET, BY APPLICATION, 2017–2021 (USD MILLION)
                                                      TABLE 281 CHILE: MASTERBATCH MARKET, BY APPLICATION, 2022–2028 (USD MILLION)
                                                      TABLE 282 CHILE: MASTERBATCH MARKET, BY APPLICATION, 2017–2021 (KILOTON)
                                                      TABLE 283 CHILE: MASTERBATCH MARKET, BY APPLICATION, 2022–2028 (KILOTON)
 
11 COMPETITIVE LANDSCAPE (Page No. - 227)
     11.1 INTRODUCTION 
     11.2 KEY PLAYER STRATEGIES 
             TABLE 284 OVERVIEW OF STRATEGIES ADOPTED BY KEY MASTERBATCH MANUFACTURERS
     11.3 RANKING OF KEY MARKET PLAYERS, 2022 
             FIGURE 41 RANKING OF MAJOR PLAYERS IN MASTERBATCH MARKET, 2022
     11.4 MARKET SHARE ANALYSIS 
             TABLE 285 MASTERBATCH MARKET: DEGREE OF COMPETITION
             FIGURE 42 AVIENT CORPORATION LED MASTERBATCH MARKET IN 2022
     11.5 REVENUE ANALYSIS OF MAJOR PLAYERS 
             FIGURE 43 REVENUE ANALYSIS OF KEY COMPANIES IN LAST 5 YEARS
     11.6 COMPANY EVALUATION MATRIX (TIER 1) 
             11.6.1 STARS
             11.6.2 EMERGING LEADERS
             11.6.3 PERVASIVE PLAYERS
             11.6.4 PARTICIPANTS
                        FIGURE 44 COMPANY EVALUATION MATRIX, 2022
             11.6.5 COMPANY FOOTPRINT
                        FIGURE 45 MASTERBATCH MARKET: COMPANY FOOTPRINT
                        TABLE 286 MASTERBATCH MARKET: TYPE FOOTPRINT
                        TABLE 287 MASTERBATCH MARKET: POLYMER FOOTPRINT
                        TABLE 288 MASTERBATCH MARKET: APPLICATION FOOTPRINT
                        TABLE 289 MASTERBATCH MARKET: COMPANY REGION FOOTPRINT
     11.7 START-UP/SME EVALUATION MATRIX 
             11.7.1 PROGRESSIVE COMPANIES
             11.7.2 RESPONSIVE COMPANIES
             11.7.3 DYNAMIC COMPANIES
             11.7.4 STARTING BLOCKS
                        FIGURE 46 START-UP/SME EVALUATION MATRIX, 2022
             11.7.5 COMPETITIVE BENCHMARKING
                        TABLE 290 MASTERBATCH MARKET: DETAILED LIST OF KEY START-UPS/SMES
                        TABLE 291 MASTERBATCH MARKET: COMPETITIVE BENCHMARKING OF KEY START-UPS/SMES
     11.8 COMPETITIVE SITUATIONS AND TRENDS 
             11.8.1 PRODUCT LAUNCHES
                        TABLE 292 MASTERBATCH MARKET: PRODUCT LAUNCHES (2018–2023)
             11.8.2 DEALS
                        TABLE 293 MASTERBATCH MARKET: DEALS (2018–2023)
             11.8.3 OTHER DEVELOPMENTS
                        TABLE 294 MASTERBATCH MARKET: EXPANSIONS, INVESTMENTS, AND INNOVATIONS (2018–2023)
 
12 COMPANY PROFILES (Page No. - 244)
(Business overview, Products/Solutions/Services offered, Recent Developments, Deals, Product launches, MnM view, Right to win, Strategic choices, Weaknesses and competitive threats) * 
     12.1 MAJOR PLAYERS 
             12.1.1 AVIENT CORPORATION
                        TABLE 295 AVIENT CORPORATION: COMPANY OVERVIEW
                        FIGURE 47 AVIENT CORPORATION: COMPANY SNAPSHOT
             12.1.2 AMPACET CORPORATION
                        TABLE 296 AMPACET CORPORATION: COMPANY OVERVIEW
             12.1.3 LYONDELLBASELL INDUSTRIES HOLDINGS B.V.
                        TABLE 297 LYONDELLBASELL INDUSTRIES HOLDINGS B.V.: COMPANY OVERVIEW
                        FIGURE 48 LYONDELLBASELL INDUSTRIES HOLDINGS B.V.: COMPANY SNAPSHOT
             12.1.4 CABOT CORPORATION
                        TABLE 298 CABOT CORPORATION: COMPANY OVERVIEW
                        FIGURE 49 CABOT CORPORATION: COMPANY SNAPSHOT
             12.1.5 PLASTIKA KRITIS S.A.
                        TABLE 299 PLASTIKA KRITIS S.A.: COMPANY OVERVIEW
             12.1.6 PLASTIBLENDS
                        TABLE 300 PLASTIBLENDS: COMPANY OVERVIEW
                        FIGURE 50 PLASTIBLENDS: COMPANY SNAPSHOT
             12.1.7 HUBRON INTERNATIONAL
                        TABLE 301 HUBRON INTERNATIONAL: COMPANY OVERVIEW
             12.1.8 TOSAF COMPOUNDS LTD.
                        TABLE 302 TOSAF COMPOUNDS LTD: COMPANY OVERVIEW
             12.1.9 PENN COLOR INC.
                        TABLE 303 PENN COLOR INC.: COMPANY OVERVIEW
             12.1.10 AMERICHEM
                        TABLE 304 AMERICHEM: COMPANY OVERVIEW
             12.1.11 RTP COMPANY
                        TABLE 305 RTP COMPANY: COMPANY OVERVIEW
             12.1.12 SUKANO AG
                        TABLE 306 SUKANO AG: COMPANY OVERVIEW
             12.1.13 KAFRIT IL
                        TABLE 307 KAFRIT IL: COMPANY OVERVIEW
             12.1.14 VANETTI S.P.A.
                        TABLE 308 VANETTI S.P.A.: COMPANY OVERVIEW
             12.1.15 FRILVAM SPA
                        TABLE 309 FRILVAM SPA: COMPANY OVERVIEW
             12.1.16 GRANULA
                        TABLE 310 GRANULA: COMPANY OVERVIEW
             12.1.17 GABRIEL-CHEMIE GMBH
                        TABLE 311 GABRIEL-CHEMIE GMBH: COMPANY OVERVIEW
*Details on Business overview, Products/Solutions/Services offered, Recent Developments, MnM view, Key strengths, Strategic choices, Weaknesses and competitive threats might not be captured in case of unlisted companies.
     12.2 OTHER KEY PLAYERS 
             12.2.1 PRIMEX PLASTICS CORPORATION
                        TABLE 312 PRIMEX PLASTICS CORPORATION: COMPANY OVERVIEW
             12.2.2 AF COLOR
                        TABLE 313 AF COLOR: COMPANY OVERVIEW
             12.2.3 HIGH TECNOLOGY MASTERBATCHES S.L.
                        TABLE 314 HIGH TECNOLOGY MASTERBATCHES S.L.: COMPANY OVERVIEW
             12.2.4 PRAYAG POLYTECH
                        TABLE 315 PRAYAG POLYTECH: COMPANY OVERVIEW
             12.2.5 ASTRA POLYMERS
                        TABLE 316 ASTRA POLYMERS: COMPANY OVERVIEW
             12.2.6 JIANGSU PULAIKE HONGMEI MASTERBATCH CO., LTD.
                        TABLE 317 JIANGSU PULAIKE HONGMEI MASTERBATCH CO., LTD.: COMPANY OVERVIEW
             12.2.7 ALOK MASTERBATCHES PVT. LTD.
                        TABLE 318 ALOK MASTERBATCHES PVT. LTD: COMPANY OVERVIEW
             12.2.8 DAINICHISEIKA COLOR & CHEMICALS MFG. CO., LTD.
                        TABLE 319 DAINICHISEIKA COLOR & CHEMICALS MFG. CO., LTD.: COMPANY OVERVIEW
             12.2.9 RAJIV PLASTIC INDUSTRIES
                        TABLE 320 RAJIV PLASTIC INDUSTRIES: COMPANY OVERVIEW
 
13 ADJACENT & RELATED MARKETS (Page No. - 278)
     13.1 INTRODUCTION 
     13.2 LIMITATIONS 
     13.3 PLASTIC ADDITIVES MARKET 
             13.3.1 MARKET DEFINITION
             13.3.2 MARKET OVERVIEW
     13.4 PLASTIC ADDITIVES MARKET, BY REGION 
             TABLE 321 PLASTIC ADDITIVES MARKET, BY REGION, 2016–2021 (KILOTON)
             TABLE 322 PLASTIC ADDITIVES MARKET, BY REGION, 2022–2028 (KILOTON)
             TABLE 323 PLASTIC ADDITIVES MARKET, BY REGION, 2016–2021 (USD MILLION)
             TABLE 324 PLASTIC ADDITIVES MARKET, BY REGION, 2022–2028 (USD MILLION)
             13.4.1 ASIA PACIFIC
                        13.4.1.1 Asia Pacific: Plastic additives market, by application
                                      TABLE 325 ASIA PACIFIC: PLASTIC ADDITIVES MARKET, BY APPLICATION, 2016–2021 (KILOTON)
                                      TABLE 326 ASIA PACIFIC: PLASTIC ADDITIVES MARKET, BY APPLICATION, 2022–2028 (KILOTON)
                                      TABLE 327 ASIA PACIFIC: PLASTIC ADDITIVES MARKET, BY APPLICATION, 2016–2021 (USD MILLION)
                                      TABLE 328 ASIA PACIFIC: PLASTIC ADDITIVES MARKET, BY APPLICATION, 2022–2028 (USD MILLION)
                        13.4.1.2 Asia Pacific: Plastic additives market, by plastic type
                                      TABLE 329 ASIA PACIFIC: PLASTIC ADDITIVES MARKET, BY PLASTIC TYPE, 2016–2021 (KILOTON)
                                      TABLE 330 ASIA PACIFIC: PLASTIC ADDITIVES MARKET, BY PLASTIC TYPE, 2022–2028 (KILOTON)
                                      TABLE 331 ASIA PACIFIC: PLASTIC ADDITIVES MARKET, BY PLASTIC TYPE, 2016–2021 (USD MILLION)
                                      TABLE 332 ASIA PACIFIC: PLASTIC ADDITIVES MARKET, BY PLASTIC TYPE, 2022–2028 (USD MILLION)
                        13.4.1.3 Asia Pacific: Plastic additives market, by type
                                      TABLE 333 ASIA PACIFIC: PLASTIC ADDITIVES MARKET, BY TYPE, 2016–2021 (KILOTON)
                                      TABLE 334 ASIA PACIFIC: PLASTIC ADDITIVES MARKET, BY TYPE, 2022–2028 (KILOTON)
                                      TABLE 335 ASIA PACIFIC: PLASTIC ADDITIVES MARKET, BY TYPE, 2016–2021 (USD MILLION)
                                      TABLE 336 ASIA PACIFIC: PLASTIC ADDITIVES MARKET, BY TYPE, 2022–2028 (USD MILLION)
                        13.4.1.4 Asia Pacific: Plastic additives market, by country
                                      TABLE 337 ASIA PACIFIC: PLASTIC ADDITIVES MARKET, BY COUNTRY, 2016–2021 (KILOTON)
                                      TABLE 338 ASIA PACIFIC: PLASTIC ADDITIVES MARKET, BY COUNTRY, 2022–2028 (KILOTON)
                                      TABLE 339 ASIA PACIFIC: PLASTIC ADDITIVES MARKET, BY COUNTRY, 2016–2021 (USD MILLION)
                                      TABLE 340 ASIA PACIFIC: PLASTIC ADDITIVES MARKET, BY COUNTRY, 2022–2028 (USD MILLION)
             13.4.2 EUROPE
                        13.4.2.1 Europe: Plastic additives market, by application
                                      TABLE 341 EUROPE: PLASTIC ADDITIVES MARKET, BY APPLICATION, 2016–2021 (KILOTON)
                                      TABLE 342 EUROPE: PLASTIC ADDITIVES MARKET, BY APPLICATION, 2022–2028 (KILOTON)
                                      TABLE 343 EUROPE: PLASTIC ADDITIVES MARKET, BY APPLICATION, 2016–2021 (USD MILLION)
                                      TABLE 344 EUROPE: PLASTIC ADDITIVES MARKET, BY APPLICATION, 2022–2028 (USD MILLION)
                        13.4.2.2 Europe: Plastic additives market, by plastic type
                                      TABLE 345 EUROPE: PLASTIC ADDITIVES MARKET, BY PLASTIC TYPE, 2016–2021 (KILOTON)
                                      TABLE 346 EUROPE: PLASTIC ADDITIVES MARKET, BY PLASTIC TYPE, 2022–2028 (KILOTON)
                                      TABLE 347 EUROPE: PLASTIC ADDITIVES MARKET, BY PLASTIC TYPE, 2016–2021 (USD MILLION)
                                      TABLE 348 EUROPE: PLASTIC ADDITIVES MARKET, BY PLASTIC TYPE, 2022–2028 (USD MILLION)
                        13.4.2.3 Europe: Plastic additives market, by type
                                      TABLE 349 EUROPE: PLASTIC ADDITIVES MARKET, BY TYPE, 2016–2021 (KILOTON)
                                      TABLE 350 EUROPE: PLASTIC ADDITIVES MARKET, BY TYPE, 2022–2028 (KILOTON)
                                      TABLE 351 EUROPE: PLASTIC ADDITIVES MARKET, BY TYPE, 2016–2021 (USD MILLION)
                                      TABLE 352 EUROPE: PLASTIC ADDITIVES MARKET, BY TYPE, 2022–2028 (USD MILLION)
                        13.4.2.4 Europe: Plastic additives market, by country
                                      TABLE 353 EUROPE: PLASTIC ADDITIVES MARKET, BY COUNTRY, 2016–2021 (KILOTON)
                                      TABLE 354 EUROPE: PLASTIC ADDITIVES MARKET, BY COUNTRY, 2022–2028 (KILOTON)
                                      TABLE 355 EUROPE: PLASTIC ADDITIVES MARKET, BY COUNTRY, 2016–2021 (USD MILLION)
                                      TABLE 356 EUROPE: PLASTIC ADDITIVES MARKET, BY COUNTRY, 2022–2028 (USD MILLION)
             13.4.3 NORTH AMERICA
                        13.4.3.1 North America: Plastic additives market, by application
                                      TABLE 357 NORTH AMERICA: PLASTIC ADDITIVES MARKET, BY APPLICATION, 2016–2021 (KILOTON)
                                      TABLE 358 NORTH AMERICA: PLASTIC ADDITIVES MARKET, BY APPLICATION, 2022–2028 (KILOTON)
                                      TABLE 359 NORTH AMERICA: PLASTIC ADDITIVES MARKET, BY APPLICATION, 2016–2021 (USD MILLION)
                                      TABLE 360 NORTH AMERICA: PLASTIC ADDITIVES MARKET, BY APPLICATION, 2022–2028 (USD MILLION)
                        13.4.3.2 North America: Plastic additives market, by plastic type
                                      TABLE 361 NORTH AMERICA: PLASTIC ADDITIVES MARKET, BY PLASTIC TYPE, 2016–2021 (KILOTON)
                                      TABLE 362 NORTH AMERICA: PLASTIC ADDITIVES MARKET, BY PLASTIC TYPE, 2022–2028 (KILOTON)
                                      TABLE 363 NORTH AMERICA: PLASTIC ADDITIVES MARKET, BY PLASTIC TYPE, 2016–2021 (USD MILLION)
                                      TABLE 364 NORTH AMERICA: PLASTIC ADDITIVES MARKET, BY PLASTIC TYPE, 2022–2028 (USD MILLION)
                        13.4.3.3 North America: plastic additives market, by type
                                      TABLE 365 NORTH AMERICA: PLASTIC ADDITIVES MARKET, BY TYPE, 2016–2021 (KILOTON)
                                      TABLE 366 NORTH AMERICA: PLASTIC ADDITIVES MARKET, BY TYPE, 2022–2028 (KILOTON)
                                      TABLE 367 NORTH AMERICA: PLASTIC ADDITIVES MARKET, BY TYPE, 2016–2021 (USD MILLION)
                                      TABLE 368 NORTH AMERICA: PLASTIC ADDITIVES MARKET, BY TYPE, 2022–2028 (USD MILLION)
                        13.4.3.4 North America: Plastic additives market, by country
                                      TABLE 369 NORTH AMERICA: PLASTIC ADDITIVES MARKET, BY COUNTRY, 2016–2021 (KILOTON)
                                      TABLE 370 NORTH AMERICA: PLASTIC ADDITIVES MARKET, BY COUNTRY, 2022–2028 (KILOTON)
                                      TABLE 371 NORTH AMERICA: PLASTIC ADDITIVES MARKET, BY COUNTRY, 2016–2021 (USD MILLION)
                                      TABLE 372 NORTH AMERICA: PLASTIC ADDITIVES MARKET, BY COUNTRY, 2022–2028 (USD MILLION)
             13.4.4 MIDDLE EAST & AFRICA
                        13.4.4.1 Middle East & Africa: Plastic additives market, by application
                                      TABLE 373 MIDDLE EAST & AFRICA: PLASTIC ADDITIVES MARKET, BY APPLICATION, 2016–2021 (KILOTON)
                                      TABLE 374 MIDDLE EAST & AFRICA: PLASTIC ADDITIVES MARKET, BY APPLICATION, 2022–2028 (KILOTON)
                                      TABLE 375 MIDDLE EAST & AFRICA: PLASTIC ADDITIVES MARKET, BY APPLICATION, 2016–2021 (USD MILLION)
                                      TABLE 376 MIDDLE EAST & AFRICA: PLASTIC ADDITIVES MARKET, BY APPLICATION, 2022–2028 (USD MILLION)
                        13.4.4.2 Middle East & Africa: Plastic additives market, by plastic type
                                      TABLE 377 MIDDLE EAST & AFRICA: PLASTIC ADDITIVES MARKET, BY PLASTIC TYPE, 2016–2021 (KILOTON)
                                      TABLE 378 MIDDLE EAST & AFRICA: PLASTIC ADDITIVES MARKET, BY PLASTIC TYPE, 2022–2028 (KILOTON)
                                      TABLE 379 MIDDLE EAST & AFRICA: PLASTIC ADDITIVES MARKET, BY PLASTIC TYPE, 2016–2021 (USD MILLION)
                                      TABLE 380 MIDDLE EAST & AFRICA: PLASTIC ADDITIVES MARKET, BY PLASTIC TYPE, 2022–2028 (USD MILLION)
                        13.4.4.3 Middle East & Africa: Plastic additives market, by type
                                      TABLE 381 MIDDLE EAST & AFRICA: PLASTIC ADDITIVES MARKET, BY TYPE, 2016–2021 (KILOTON)
                                      TABLE 382 MIDDLE EAST & AFRICA: PLASTIC ADDITIVES MARKET, BY TYPE, 2022–2028 (KILOTON)
                                      TABLE 383 MIDDLE EAST & AFRICA: PLASTIC ADDITIVES MARKET, BY TYPE, 2016–2021 (USD MILLION)
                                      TABLE 384 MIDDLE EAST & AFRICA: PLASTIC ADDITIVES MARKET, BY TYPE, 2022–2028 (USD MILLION)
                        13.4.4.4 Middle East & Africa: Plastic additives market, by country
                                      TABLE 385 MIDDLE EAST & AFRICA: PLASTIC ADDITIVES MARKET, BY COUNTRY, 2016–2021 (KILOTON)
                                      TABLE 386 MIDDLE EAST & AFRICA: PLASTIC ADDITIVES MARKET, BY COUNTRY, 2022–2028 (KILOTON)
                                      TABLE 387 MIDDLE EAST & AFRICA: PLASTIC ADDITIVES MARKET, BY COUNTRY, 2016–2021 (USD MILLION)
                                      TABLE 388 MIDDLE EAST & AFRICA: PLASTIC ADDITIVES MARKET, BY COUNTRY, 2022–2028 (USD MILLION)
             13.4.5 SOUTH AMERICA
                        13.4.5.1 South America: Plastic additives market, by application
                                      TABLE 389 SOUTH AMERICA: PLASTIC ADDITIVES MARKET, BY APPLICATION, 2016–2021 (KILOTON)
                                      TABLE 390 SOUTH AMERICA: PLASTIC ADDITIVES MARKET, BY APPLICATION, 2022–2028 (KILOTON)
                                      TABLE 391 SOUTH AMERICA: PLASTIC ADDITIVES MARKET, BY APPLICATION, 2016–2021 (USD MILLION)
                                      TABLE 392 SOUTH AMERICA: PLASTIC ADDITIVES MARKET, BY APPLICATION, 2022–2028 (USD MILLION)
                        13.4.5.2 South America: Plastic additives market, by plastic type
                                      TABLE 393 SOUTH AMERICA: PLASTIC ADDITIVES MARKET, BY PLASTIC TYPE, 2016–2021 (KILOTON)
                                      TABLE 394 SOUTH AMERICA: PLASTIC ADDITIVES MARKET, BY PLASTIC TYPE, 2022–2028 (KILOTON)
                                      TABLE 395 SOUTH AMERICA: PLASTIC ADDITIVES MARKET, BY PLASTIC TYPE, 2016–2021 (USD MILLION)
                                      TABLE 396 SOUTH AMERICA: PLASTIC ADDITIVES MARKET, BY PLASTIC TYPE, 2022–2028 (USD MILLION)
                        13.4.5.3 South America: Plastic additives market, by type
                                      TABLE 397 SOUTH AMERICA: PLASTIC ADDITIVES MARKET, BY TYPE, 2016–2021 (KILOTON)
                                      TABLE 398 SOUTH AMERICA: PLASTIC ADDITIVES MARKET, BY TYPE, 2022–2028 (KILOTON)
                                      TABLE 399 SOUTH AMERICA: PLASTIC ADDITIVES MARKET, BY TYPE, 2016–2021 (USD MILLION)
                                      TABLE 400 SOUTH AMERICA: PLASTIC ADDITIVES MARKET, BY TYPE, 2022–2028 (USD MILLION)
                        13.4.5.4 South America: Plastic additives market, by country
                                      TABLE 401 SOUTH AMERICA: PLASTIC ADDITIVES MARKET, BY COUNTRY, 2016–2021 (KILOTON)
                                      TABLE 402 SOUTH AMERICA: PLASTIC ADDITIVES MARKET, BY COUNTRY, 2022–2028 (KILOTON)
                                      TABLE 403 SOUTH AMERICA: PLASTIC ADDITIVES MARKET, BY COUNTRY, 2016–2021 (USD MILLION)
                                      TABLE 404 SOUTH AMERICA: PLASTIC ADDITIVES MARKET, BY COUNTRY, 2022–2028 (USD MILLION)
 
14 APPENDIX (Page No. - 312)
     14.1 DISCUSSION GUIDE 
     14.2 KNOWLEDGESTORE: MARKETSANDMARKETS’ SUBSCRIPTION PORTAL 
     14.3 CUSTOMIZATION OPTIONS 
     14.4 RELATED REPORTS 
     14.5 AUTHOR DETAILS 

The study involved four major activities in estimating the market size for Masterbatch. Exhaustive secondary research was done to collect information on the market, the peer market, and the parent market. The next step was to validate these findings, assumptions, and sizing with industry experts across the value chain through primary research. Both top-down and bottom-up approaches were employed to estimate the complete market size. Post that, the market breakdown and data triangulation procedures were used to estimate the market size of the segments and subsegments.

Secondary Research

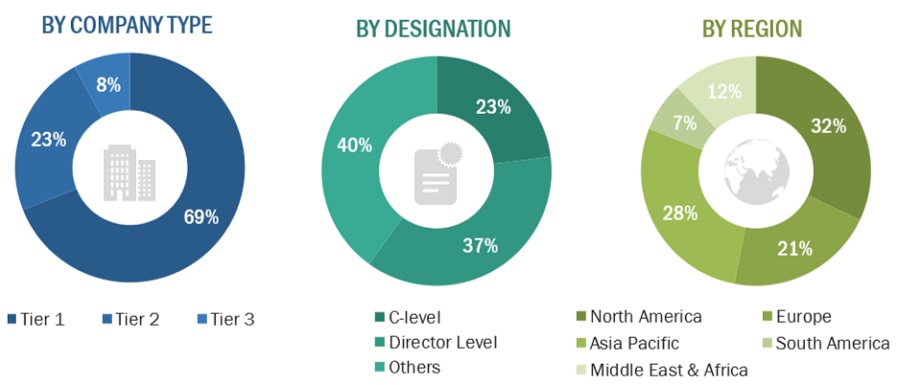
Secondary sources used in this study included annual reports, press releases, and investor presentations of companies; white papers; certified publications; articles from recognized authors; and gold standard & silver standard websites such as Factiva, ICIS, Bloomberg, and others. The findings of this study were verified through primary research by conducting extensive interviews with key officials such as CEOs, VPs, directors, and other executives. The breakdown of profiles of the primary interviewees is illustrated in the figure below:

Primary Research

The Masterbatch market comprises several stakeholders, such as raw material suppliers, end-product manufacturers, and regulatory organizations in the supply chain. The demand side of this market is characterized by the automotive, medical, electronics, and others. The supply side is characterized by advancements in technology and diverse application industries. Various primary sources from both the supply and demand sides of the market were interviewed to obtain qualitative and quantitative information.

Breakdown of Primary Participants
Masterbatch Market Size, and Share

Note: Tier 1, Tier 2, and Tier 3 companies are classified based on their market revenue in 2022, available in the public domain, product portfolios, and geographical presence.

Other designations include consultants and sales, marketing, and procurement managers.

To know about the assumptions considered for the study, download the pdf brochure

COMPANY NAME

DESIGNATION

Avient Corporation

Director of Marketing

LyondellBasell Industries Holdings B.V.

Manager- Sales & Marketing

Ampacet Corporation

Sales Manager

Cabot Corporation

Production Manager

Plastika Kritis S.A.

Sales Manager

Market Size Estimation

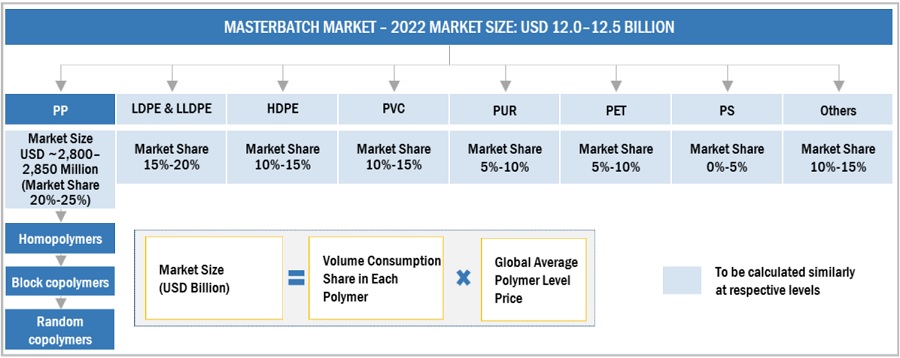
Both top-down and bottom-up approaches were used to estimate and validate the total size of the Masterbatch market. These methods were also used extensively to estimate the size of various subsegments in the market. The research methodology used to estimate the market size includes the following:

  • The key players in the industry have been identified through extensive secondary research.
  • The supply chain of the industry has been determined through primary and secondary research.
  • All percentage shares, splits, and breakdowns have been determined using secondary sources and verified through primary sources.
  • All possible parameters that affect the markets covered in this research study have been accounted for, viewed in extensive detail, verified through primary research, and analyzed to obtain the final quantitative and qualitative data.

Masterbatch Market: Bottom-Up Approach
Masterbatch Market Size, and Share

To know about the assumptions considered for the study, Request for Free Sample Report

Masterbatch Market: Top-Down Approach

Masterbatch Market Size, and Share

Data Triangulation

After arriving at the overall market size—using the market size estimation processes as explained above—the market was split into several segments and subsegments. To complete the overall market engineering process and arrive at the exact statistics of each market segment and subsegment, data triangulation and market breakdown procedures were employed, wherever applicable. The data was triangulated by studying various factors and trends from both the demand and supply sides in the masterbatch industry.

Market Definition

According to the Polymer Technology Dictionary, a masterbatch is a blend of pigments, additives, and polymer materials used to impart color and strengthen the properties of plastics. It is used in different polymers such as polypropylene (PP), low-density polyethylene (LDPE), linear low-density polyethylene (LLDPE), high-density polyethylene (HDPE), polyvinyl chloride (PVC), polyethylene terephthalate (PET), polystyrene (PS), and polyurethane (PUR). Various types of masterbatches, such as color, white, black, additive, and filler, are used in packaging, building & construction, consumer goods, automotive, textile, and agriculture applications.

Key Stakeholders

  • Masterbatch manufacturers
  • Masterbatch distributors
  • Raw material suppliers
  • Government and research organizations
  • Investment banks and private equity firms
  • Research & development institutions
  • Environment support agencies
  • Investment banks and private equity firms

Report Objectives

  • To define, describe, and forecast the global masterbatch market size in terms of volume and value
  • To provide detailed information about the significant drivers, restraints, challenges, and opportunities influencing market growth
  • To estimate and forecast the market size based on type, polymer, and application.
  • To forecast the size of the market based on five major regions–Asia Pacific, North America, Europe, the Middle East & Africa, and South America, along with their key countries
  • To strategically analyze the micromarkets1 with respect to individual growth trends, prospects, and their contribution to the overall market
  • To analyze opportunities in the market for stakeholders and to provide a competitive landscape of market leaders.
  • To analyze recent developments such as agreements, mergers & acquisitions, expansions, and product launches in the market
  • To strategically profile key market players and comprehensively analyze their core competencies2 and market share

Available Customizations

Along with the given market data, MarketsandMarkets offers customizations according to the company’s specific needs. The following customization options are available for the report:

Regional Analysis

  • Further breakdown of a region with respect to a particular country or additional application type

Company Information

  • Detailed analysis and profiles of additional market players (up to five)
Custom Market Research Services

We will customize the research for you, in case the report listed above does not meet with your exact requirements. Our custom research will comprehensively cover the business information you require to help you arrive at strategic and profitable business decisions.

Request Customization

Instant Answers with GPT - Ask Now!

Ask real questions. Get complete answers !
Report Code
CH 2607
Published ON
Jan, 2024
Choose License Type
BUY NOW
  • SHARE
X
Request Customization
Speak to Analyst
Speak to Analyst
OR FACE-TO-FACE MEETING
PERSONALIZE THIS RESEARCH
  • Triangulate with your Own Data
  • Get Data as per your Format and Definition
  • Gain a Deeper Dive on a Specific Application, Geography, Customer or Competitor
  • Any level of Personalization
REQUEST A FREE CUSTOMIZATION
LET US HELP YOU!
  • What are the Known and Unknown Adjacencies Impacting the Masterbatch Market
  • What will your New Revenue Sources be?
  • Who will be your Top Customer; what will make them switch?
  • Defend your Market Share or Win Competitors
  • Get a Scorecard for Target Partners
CUSTOMIZED WORKSHOP REQUEST
+1-888-600-6441
  • Call Us
  • +1-888-600-6441 (Corporate office hours)
  • +1-888-600-6441 (US/Can toll free)
  • +44-800-368-9399 (UK office hours)
CONNECT WITH US
ABOUT TRUST ONLINE
©2024 MarketsandMarkets Research Private Ltd. All rights reserved
DMCA.com Protection Status Website Feedback