Pre-harvest Equipment Market By Type (Primary Tillage Equipment, Secondary Tillage Equipment, Planting Equipment, Irrigation Equipment, Plant Protection & Fertilizing and Others), By Geography: Trends & Forecasts To 2018


The trend of mechanization in agriculture has increasingly proved to be important and has played a key role in agricultural production globally. Conservation and proper utilization of natural resources and reduction in the overall cost of production are possible if the agricultural machinery is used efficiently. The increase in the population worldwide has led to an increased use of agricultural products. Therefore, it is estimated that the world demand in the agricultural equipment and pre-harvest market may rise steadily.
The value of the pre-harvest equipment market in 2012 was worth $40,118.2 million and is expected to grow at an annual rate of 5.7% from 2013 to 2018. The promotion and introduction of agricultural mechanization in the Asia-Pacific region has brought an immediate change in the farm machinery sector. The Asia-Pacific region is expected to cross the market value of $2 billion by 2018 growing with a CAGR of 6.1% from 2013 to 2018. The emerging countries such as Brazil, India, Russia, and China are anticipated to experience a rapid growth in the future. A strong economic growth and the increase in population size are fuelling the growth in the agricultural sector in these regions.
Agricultural equipment includes farm field machinery used for the production and growth of crops. Major pre-harvest product lines include planting and fertilizing machinery, tillage equipment, plant protection & irrigation equipment, etc. The tillage and planting equipment are the major segments accounting for nearly 60% of the total market share. The manufacturing of self-propelled equipment has shown tremendous growth in the last two decades owing to its increased usage by the farmers facilitated by its ease of use.
Few factors such as growth in farm mechanization level, increase in the income of middle-class population, and government subsidies in the Asia-Pacific region are responsible for driving the global pre-harvest equipment market. Factors restraining the growth of the pre-harvest market are the lack of awareness among the farmers in the Asia-Pacific region and fragmented land holdings that restrict the use of farm equipment. Key players of this industry are Deere & Company (U.S.), CNH Global (The Netherlands), AGCO Corp. (U.S.), etc.
Globally, pre-harvest market is witnessing steady growth on account of the growing population, increasing demand for food, growth in farm mechanization level and acceptance by the farmers to use the farm mechanization techniques and implements. Agricultural equipment has proven advantageous in terms of increased yield and also the quality of crop produced. Increasing profitability due to the use of farm equipment has leading to increased rate of adoption by the farmers. Advancements are made to manufacture environment friendly agricultural equipment at cheaper cost and customized according to the region and crop. These positive attributes of agriculture equipment are viewed as excellent business opportunity in a steadily growing agricultural equipment market.
Many major players operating in this marketplace are focusing on Asia-Pacific and Latin America region for business expansion as the increasing awareness among the farmers and the arable land has triggered the demand for farm equipment. However small and fragmented land holding which is predominant in major countries of these region are restraining the growth of the industry.
The global market for pre-harvest agri equipment was $40,118.2 million in 2012 and is expected to reach $55,696.6 million by 2018, growing at a CAGR of 5.7% from 2013 to 2018. On a global scale, Asia-Pacific region is the fastest growing market growing at the estimated CAGR of 6.3% during the forecast period. The consumption growth is particularly high in countries such as China, India and Thailand because of increased consumption of agricultural food due to the increase in the world population and growth in the agriculture machinery industry.
Pre-Harvest Agri Equipment Industry, By Geography, 2012
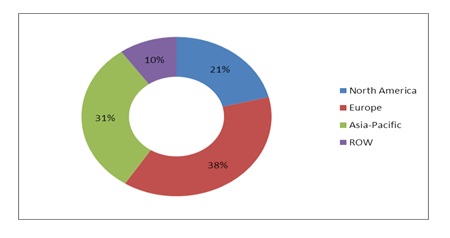
Source: MarketsandMarkets Analysis
Key participants in the pre-harvest market include Deere & Co. (U.S.), AGCO Corp. (U.S.), CNH Global (Netherlands), Bucher Industries (Switzerland) and Kubota Corp Ltd. (Japan). The pre-harvest agri equipment market is witnessing rapid development in the areas of new product launch and collaborations. Leading companies are focusing on the expansion of respective business across high-growth regions and setting up new manufacturing plants for increasing production capacities along with broadening of product line.
 Exclusive indicates content/data unique to MarketsandMarkets and not available with any competitors.
Table Of Contents
1 Introduction (Page No. - 17)
1.1 Key Take-Aways
1.2 Report Description
1.3 Markets Covered
1.4 Stakeholders
1.5 Research Methodology
1.5.1 Market Size
1.5.2 Key Data Points Taken From Secondary Sources
1.5.3 Key Data Points Taken From Primary Sources
1.5.4 Assumptions Made For This Report
1.5.5 Key Questions Answered
2 Executive Summary (Page No. - 24)
3 Premium Insights (Page No. - 27)
3.1 New Products Launch & Collaborations: Most Preferred Strategic Approach
3.2 Maximum Development In 2011
4 Market Overview (Page No. - 39)
4.1 Introduction
4.2 Winning Imperative
4.2.1 Investments In R&D
4.3 Burning Issue: Protectionist Measure In Russia
4.4 Market Dynamics
4.4.1 Market Drivers
4.4.1.1 Growth In Farm Mechanization Level In Asia-Pacific
4.4.1.2 Government Subsidies In Asia-Pacific
4.4.1.3 Increasing Net Farm Income Due To Mechanization
4.4.1.4 Population Growth And Increasing Demand For Food
4.4.2 Market Restraints
4.4.2.1 Lack Of Awareness
4.4.2.2 Small And Fragmented Land Holding
4.4.3 Market Opportunities
4.4.3.1 New Target Market - Asia-Pacific & ROW
4.5 Porter�s Five Force Analysis
4.5.1 Suppliers� Power
4.5.2 Buyers� Power
4.5.3 Threat Of New Entrants
4.5.4 Threat Of Substitutes
4.5.5 Degree Of Competition
4.6 Market Share Analysis
4.7 Patent Analysis
5 Global Pre-Harvest Agri Equipment Market, By Types (Page No. - 55)
5.1 Introduction
5.2 Primary Tillage Equipment
5.2.1 Moldboard Plough
5.2.2 Disc Plough
5.2.3 Chisel Plough
5.2.4 Rotary Ploughs
5.3 Secondary Tillage Equipment
5.3.1 Harrows
5.3.1.1 Disc Harrow
5.3.1.2 Off-Set Disc Harrow
5.3.2 Cultivators
5.3.3 Rollers & Pulverizers
5.4 Planting Equipment
5.4.1 Seed Drills
5.4.2 Planters
5.4.3 Transplanters
5.4.4 Airseeders
5.5 Irrigation Equipment
5.5.1 Pumps
5.5.2 Filters
5.5.3 Pipes
5.5.4 Valves
5.5.5 Emmiters
5.6 Plant Protection Equipment
5.6.1 Hand Operated Sprayers
5.6.2 Motorized Sprayers
5.6.3 Boom Sprayers
5.6.4 Airblast Sprayers
5.6.5 Granular Applicators
5.6.6 Aerial Applicators
5.7 Other Equipment
6 Pre-Harvest Agri Equipment Market, By Geography (Page No. - 79)
6.1 Introduction
6.2 North America
6.2.1 U.S.
6.2.2 Canada
6.2.3 Mexico
6.3 Europe
6.3.1 France
6.3.2 Germany
6.3.3 U.K.
6.3.4 Italy
6.3.5 Spain
6.3.6 Poland
6.3.7 Russia
6.3.8 Ukraine
6.3.9 Rest Of Europe
6.4 Asia-Pacific
6.4.1 China
6.4.2 India
6.4.3 Japan
6.4.4 Turkey
6.4.5 Vietnam
6.4.6 Thailand
6.4.7 Australia
6.4.8 South Korea
6.4.9 Rest Of Apac
6.5 Row
6.5.1 Brazil
6.5.2 Argentina
6.5.3 South Africa
6.5.4 Egypt
6.5.5 Rest Of Row
7 Competitive Landscape (Page No. - 134)
7.1 Introduction
7.2 New Products Launch & Collaborations: Most Prefered Strategic Approach
7.3 Maximum Development In 2011
7.4 Deere & Co. And Bucher Industries Ag: Most Active Companies
7.5 Swot Analysis
7.5.1 DEERE & Co.
7.5.2 AGCO Corp.
7.5.3 Mahindra & Mahindra Ltd
7.5.4 CHN Global
8 Company Profiles (Overview, Financials, Products & Services, Strategy, And Developments)* (Page No. - 149)
8.1 AGCO Corp.
8.2 Alamo Group Incorporated
8.3 Bucher Industries Ag
8.4 CNH Global
8.5 Daedong Industrial Co. Ltd
8.6 DEERE & Company
8.7 Escorts Group
8.8 Exel Industries
8.9 Foton Lovol International Heavy Industries Ltd
8.10 Horsch Maschinen Gmbh
8.11 Iseki &Company Ltd
8.12 Kubota Tractor Corporation
8.13 Kukje Machinery Corporation Ltd
8.14 Mahindra & Mahindra Ltd
8.15 Netafim Ltd
8.16 Rain Bird Corporation
8.17 Tractors &Farm Equipments Ltd (TAFE)
8.18 The Toro Company
8.19 Valmont Industries Inc.
8.20 Yanmar Company Ltd
*Details On Overview, Financials, Product & Services, Strategy, And Developments Might Not Be Captured In Case Of Unlisted Companies.
Appendix (Page No. - 200)
U.S. Patents
Europe Patents
Japan Patents
List Of Tables (93 Tables)
Table 1 Pre-Harvest Agri Equipment: Market Revenue, By Geography, 2011 � 2018 ($Million)
Table 2 Population Trend, By Geography, 2010 � 2017 (In Thousand)
Table 3 Pre-Harvest Agri Equipment: Market Revenue, By Types, 2011 - 2018 ($Million)
Table 4 Types Of Tillage & Its Descriptions
Table 5 Disc Ploughs: Advantages & Disadvantages
Table 6 Primary Tillage Equipment: Market Revenue, By Geography, 2011 - 2018 ($Million)
Table 7 Primary Tillage Equipment: Market Revenue, By Types, 2011 - 2018 ($Million)
Table 8 Secondary Tillage Equipment: Market Revenue, By Geography, 2011 - 2018 ($Million)
Table 9 Secondary Tillage Equipment: Market Revenue, By Geography, 2011 - 2018 ($Million)
Table 10 Planting Equipment: Market Revenue, By Geography, 2011 - 2018 ($Million)
Table 11 Planting Equipment: Market Revenue, By Types, 2011 - 2018 ($Million)
Table 12 Irrigation Equipment: Market Revenue, By Geography, 2011 - 2018 ($Million)
Table 13 Plant Protection & Fertilizing Equipment: Market Revenue, By Geography, 2011 - 2018 ($Million)
Table 14 Plant Protection & Fertilizing Equipment: Market Revenue, By Types, 2011 - 2018 ($Million)
Table 15 Other Equipment: Market Revenue, By Geography, 2011 - 2018 ($Million)
Table 16 Pre-Harvest Agri Equipment: Market Revenue, By Geography, 2011 - 2018 ($Million)
Table 17 North America: Pre-Harvest Agri Equipment Market Revenue, By Countries, 2011 - 2018 ($Million)
Table 18 U.S: Economic Data
Table 19 U.S: Pre-Harvest Agri Equipment Market Revenue, By Types, 2011 - 2018 ($Million)
Table 20 Canada: Economic Data
Table 21 Canada: Pre-Harvest Agri Equipment Market Revenue, By Types, 2011 - 2018 ($Million)
Table 22 Mexico: Economic Data
Table 23 Mexico: Pre-Harvest Agri Equipment Market Revenue, By Types, 2011 - 2018 ($Million)
Table 24 Europe: Pre-Harvest Agri Equipment Market Revenue, By Countries, 2011 - 2018 ($Million)
Table 25 France: Economic Data
Table 26 France: Pre-Harvest Agri Equipment Market Revenue, By Types, 2011 - 2018 ($Million)
Table 27 Germany: Economic Data
Table 28 Germany: Pre-Harvest Agri Equipment Market Revenue, By Types, 2011 - 2018 ($Million)
Table 29 U.K: Economic Data
Table 30 U.K: Pre-Harvest Agri Equipment Market Revenue, By Types, 2011 - 2018 ($Million)
Table 31 Italy: Economic Data
Table 32 Italy: Pre-Harvest Agri Equipment Market Revenue, By Types, 2011 - 2018 ($Million)
Table 33 Spain: Economic Data
Table 34 Spain: Pre-Harvest Agri Equipment Market Revenue, By Types, 2011 - 2018 ($Million)
Table 35 Poland: Economic Data
Table 36 Poland: Pre-Harvest Agri Equipment Market Revenue, By Types, 2011 - 2018 ($Million)
Table 37 Russia: Economic Data
Table 38 Russia: Pre-Harvest Agri Equipment Market Revenue, By Types, 2011 - 2018 ($Million)
Table 39 Ukraine: Economic Data
Table 40 Ukraine: Pre-Harvest Agri Equipment Market Revenue, By Types, 2011 - 2018 ($Million)
Table 41 Rest Of Europe: Pre-Harvest Agri Equipment Market Revenue, By Types, 2011 - 2018 ($Million)
Table 42 Asia Pacific: Pre-Harvest Agri Equipment Market Revenue, By Countries, 2011 - 2018($Million)
Table 43 China: Economic Data
Table 44 China: Pre-Harvest Agri Equipment Market Revenue, By Types, 2011 - 2018 ($Million)
Table 45 India: Economic Data
Table 46 India: Pre-Harvest Agri Equipment Market Revenue, By Types, 2011 - 2018 ($Million)
Table 47 Japan: Economic Data
Table 48 Japan: Pre-Harvest Agri Equipment Market Revenue, By Types, 2011 - 2018 ($Million)
Table 49 Turkey: Economic Data
Table 50 Turkey: Pre-Harvest Agri Equipment Market Revenue, By Types, 2011 - 2018 ($Million)
Table 51 Vietnam: Economic Data
Table 52 Vietnam: Pre-Harvest Agri Equipment Market Revenue, By Types, 2011 - 2018 ($Million)
Table 53 Thailand: Economic Data
Table 54 Thailand: Pre-Harvest Agri Equipment Market Revenue, By Types, 2011 - 2018 ($Million)
Table 55 Australia: Economic Data
Table 56 Australia: Pre-Harvest Agri Equipment Market Revenue, By Types, 2011 - 2018 ($Million)
Table 57 South Korea: Pre-Harvest Agri Equipment Market Revenue, By Types, 2011 - 2018 ($Million)
Table 58 Rest Of Apac: Pre-Harvest Agri Equipment Market Revenue, By Types, 2011 - 2018 ($Million)
Table 59 Row: Pre-Harvest Agri Equipment Market Revenue, By Countries, 2011 - 2018 ($Million)
Table 60 Brazil: Economic Data
Table 61 Brazil: Pre-Harvest Agri Equipment Market Revenue, By Types, 2011 - 2018 ($Million)
Table 62 Argentina: Economic Data
Table 63 Argentina: Pre-Harvest Agri Equipment Market Revenue, By Types, 2011 - 2018 ($Million)
Table 64 South Africa: Economic Data
Table 65 South Africa: Pre-Harvest Agri Equipment Market Revenue, By Types, 2011 - 2018 ($Million)
Table 66 Egypt: Economic Data
Table 67 Egypt: Pre-Harvest Agri Equipment Market Revenue, By Types, 2011 - 2018 ($Million)
Table 68 Rest Of Row: Pre-Harvest Agri Equipment Market Revenue, By Types, 2011 - 2018 ($Million)
Table 69 Mergers & Acquisitions, 2011 � 2012
Table 70 Agreements, Partnerships, Collaborations, Joint Ventures & Contracts, 2010 � 2012
Table 71 New Products Launch/ Development/R&D, 2010 � 2012
Table 72 Expansions & Other Developments, 2010 � 2013
Table 73 AGCO: Regional Net Sales, 2012 ($Million)
Table 74 AGCO: Products& Its Descriptions
Table 75 Alamo: Annual Revenue, By Business Segments, 2011 � 2012 ($Million)
Table 76 Bucher: Net Sales, By Division & Regions,2012
Table 77 CNH: Net Sales, By Geography, 2013 ($Million)
Table 78 CNH: Products & Descriptions
Table 79 Daedong: Products &Descriptions
Table 80 Deere: Products & Descriptions
Table 81 Products & Its Applications/Uses
Table 82 Exel: Products &Its Descriptions
Table 83 Foton Lovol: Products & Its Descriptions
Table 84 Horsch: Products &Its Descriptions
Table 85 Iseki: Products& Its Descriptions
Table 86 Kubota: Products & Its Descriptions
Table 87 Kukje: Products & Descriptions
Table 88 Mahindra: Products &Its Applications/Uses
Table 89 Rain Bird: Products & Its Applications/Uses
Table 90 Tafe: Products& Its Applications/Uses
Table 91 Toro: Products& Its Applications/Uses
Table 92 Valmont: Products& Its Applications/Uses
Table 93 Yanmar: Products& Its Applications/Uses
List Of Figures (28 Figures)
Figure 1 Pre-Harvest Agri Equipment: Market Segmentation
Figure 2 Research Methodology
Figure 3 Pre-Harvest Agri Equipment: Market Revenue, By Types, 2012 � 2018 ($Million)
Figure 4 Pre-Harvest Agri Equipment: Market Segment
Figure 5 Planting Equipment: Market Revenue, By Types, 2011 - 2018 ($Million)
Figure 6 Pre-Harvest Agri Equipment: Market Drivers & Restraints
Figure 7 Pre-Harvest Agri Equipment: Market Revenue, By Geography, 2012 -2018 ($Million)
Figure 8 Pre-Harvest Agri Equipment: Market Life Cycle, By Geography, 2012
Figure 9 Europe: Pre-Harvest Agri Equipment Market Revenue, By Countries, 2011 - 2018 ($Million)
Figure 10 Row: Pre-Harvest Agri Equipment Market Revenue, By Country, 2012 - 2018 ($Million)
Figure 11 Primary Tillage Equipment: Market Revenue, By Types, 2013 - 2018 ($Million)
Figure 12 Pre-Harvest Agri Equipment: Market Revenue, By Geography, 2011 - 2018 ($Million)
Figure 13 Pre-Harvest: Agri Equipment Market Share, By Growth Strategies, 2010 � 2013
Figure 14 Pre-Harvest: Agri Equipment Market Developments, 2010 � 2013
Figure 15 Market Dynamics: Pre-Harvest Agri Equipment
Figure 16 Porters Five Forces Analysis
Figure 17 Pre-Harvest Agri Equipment: Market Share Analysis, By Companies, 2012
Figure 18 Patent Analysis, By Regions/Countries, 2010 � 2013
Figure 19 Patent Registration Trends, By Years, 2010 � 2013
Figure 20 Patent Analysis, By Companies, 2010 � 2013
Figure 21 Pre-Harvest: Agri Equipment Market Share, By Growth Strategies, 2009 � 2012
Figure 22 Pre-Harvest: Agri Equipment Market Developments, 2011 � 2012
Figure 23 Global Pre-Harvest Agri Equipment Market Growth Strategies, By Companies, 2010 � 2013
Figure 24 DEERE & Co.: Swot Analysis
Figure 25 AGCO Corp.: Swot Analysis
Figure 26 Mahindra & Mahindra: Swot Analysis
Figure 27 CNH Global: Swot Analysis
Figure 28 Toro: Market Share, By Geography, 2011


Growth opportunities and latent adjacency in Pre-harvest Equipment Market