Soil Aerators Market by Equipment Type (Secondary Tillage, Primary Tillage, Weeding, Soil Aerating), Application (Agriculture, Non-Agriculture), Mechanism (Mechanical, Pneumatic), Mode Of Operation (Mounted, Trailed), and Region - Global Forecast to 2023


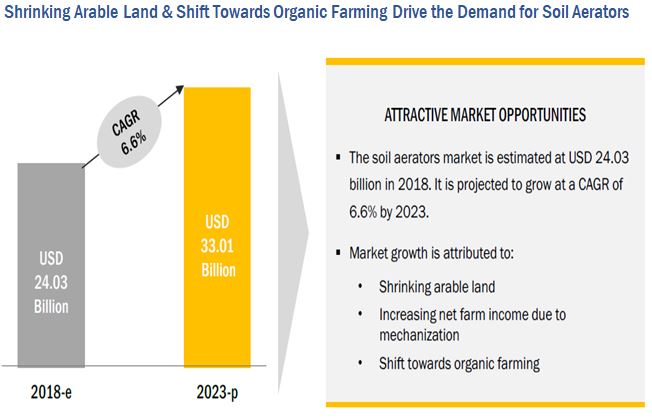
[143 Pages Report] The soil aerators market is estimated to be valued at USD 24.03 billion in 2019 and is projected to reach USD 33.01 billion by 2025, at a CAGR of 6.6% from 2018 to 2023. The population growth, increase in demand for food, rising net farm income due to mechanization, along with a shift towards organic farming are some of the major driving factors for the market. Factors such as increasing farm mechanization levels and rising profitability are also increasing the demand for the soil aerators, globally. R&D activities carried out by leading manufacturers, to develop low-cost production techniques are expected to further drive the growth rate of the market.
Majority of the players in the market adopted new product launches and product upgrading, acquisitions, technology innovations, and investments as their key growth strategies in the market. Turfgrass management in sports, residential, and commercial lawns and parks are also some of the major application markets for soil aerators. Increasing land area for sports activities in North America, Europe, and Asia Pacific are facing a rising level of soil compaction issues. This may hinder the field performance due to poor surface structure; with the increasing popularity of football and golf, the need for soil aeration from such industries is growing.
The periodization considered for the study is as follows:
- Base year: 2017
- Forecast period: 2018 to 2023
The objectives of the report
- Determining and projecting the size of the soil aerators market with respect to equipment type, mechanism, mode of operation, application, and regional markets, over a five-year period ranging from 2018 to 2023
- Identifying attractive opportunities in the market by determining the largest and fastest-growing segments across regions
- Analyzing the further segments and subsegments of the global market included in the report with respect to individual growth trends, future prospects, and their contribution to the global market
- Identifying and profiling the key players in the market
- Determining the ranking of the key players operating in the market
- Providing a comparative analysis of the market leaders on the basis of the following:
- Product offerings
- Business strategies
- Strengths and weaknesses
- Key financials
- Understanding the competitive landscape and identifying the major growth strategies adopted by players across the regions
- Analyzing the market dynamics and competitive situations & trends across regions and their impact on prominent market players
Research Methodology:
- The key regions were identified, along with countries contributing the maximum share
- Secondary research was conducted to find the value of soil aerators for regions such as North America, Europe, Asia Pacific, and RoW
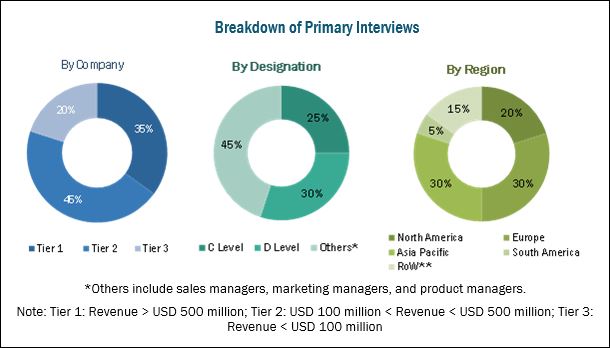
The key players were identified through secondary sources such as the US Department of Agriculture (USDA), Agriculture and Agri-Food Canada (AAFC), United States Environmental Protection Agency (USEPA), Ministry of Agriculture (India), The European Council of Agricultural, Department of Agriculture and Water Resources (Australia), and Agricultural and Rural Development Authority (European Commission), while their market share in respective regions was determined through both, primary and secondary research processes. The research methodology included the study of annual and financial reports of top market players, as well as interviews with industry experts (such as CEOs, VPs, directors, and marketing executives) for key insights (both quantitative and qualitative) for the market.
To know about the assumptions considered for the study, download the pdf brochure
The various contributors involved in the value chain of the soil aerators market include government organizations, R&D institutes, soil aerator equipment manufacturing companies, [such as Deere & Company (US), Alamo (US), AGCO Corporation (US), CNH Industrial (UK), Mahindra & Mahindra (India), Bucher Industry (Switzerland), Buhler Group (India), and Evers Agro (Netherlands)], & agricultural institutes: (French National Institute for Agricultural Research, Indian Council of Agricultural Research, National Agricultural Research Organization, The Agricultural Research Organization, and Australian Institute of Agricultural Science and Technology.
Target Audience
The stakeholders for the report are as follows:
- Agricultural & farming industry
- Farmers
- R&D institutes & laboratories
- Soil aerator manufacturers
- Regulatory bodies
- The US Department of Agriculture (USDA)
- Agriculture and Agri-Food Canada (AAFC)
- The United States Environmental Protection Agency (USEPA)
- Ministry of Agriculture (India)
- The European Council of Agricultural
- Department of Agriculture and Water Resources (Australia)
- Agricultural and Rural Development Authority (European Commission)
- Crop and turf producers and suppliers
- Intermediary suppliers
- Wholesalers
- Dealers
- Pre-harvest agri and soil aerating equipment manufacturers
- Pre-harvest agri and soil aerator suppliers and distributors
- R&D institutes
- Private research institutes & organizations
- Government and research organizations
- Agricultural institutes:
- French National Institute for Agricultural Research
- Indian Council of Agricultural Research
- National Agricultural Research Organization
- The Agricultural Research Organization
- Australian Institute of Agricultural Science and Technology
Scope of the Report
This research report categorizes the soil aerators market based on equipment type, mechanism, mode of operation, application, and region.
Based on the equipment type the market has been segmented as follows:
- Primary tillage equipment
- Secondary tillage equipment
- Weeding equipment
- Soil aerating equipment
Based on the mechanism the market has been segmented as follows:
- Mechanical
- Pneumatic
Based on the Mode of Operation the market has been segmented as follows:
- Mounted
- Trailed
- Others
Based on the application the market has been segmented as follows:
- Agriculture
- Non-agriculture
Based on the region the market has been segmented as follows:
- North America
- Europe
- Asia Pacific
- RoW (South America, the Middle East, and Africa)
Available Customizations
With the given market data, MarketsandMarkets offers customizations according to the client-specific needs.
The following customization options are available for the report:
Product Analysis
- Product matrix, which gives a detailed comparison of the product portfolio of each company
Geographic Analysis
- Further breakdown of the Rest of Asia Pacific soil aerator market
- Further breakdown of the Rest of European soil aerators market
Company Information
- Detailed analysis and profiling of additional market players (up to five)
The soil aerators market is estimated to be valued at USD 24.03 billion in 2018 and is projected to reach USD 33.01 billion by 2023, at a CAGR of 6.6% during the forecast period. The market is driven by increase in net farm income due to mechanization, shrinking arable land, and rapid increase in commercial & residential space, leading to the growing demand for landscaping.
The global market, based on equipment, has been segmented into secondary tillage, primary tillage, weeding, and soil aerating. The market for soil aerating is projected to grow at the highest CAGR between 2018 and 2023. The manufacturing of trailed and mounted equipment has witnessed tremendous growth in the last two decades owing to its increased usage by farmers, facilitated by the ease in application. The market for soil aerators used in agriculture is rapidly growing owing to government initiatives, extensive R&D activities in agricultural as well as non-agricultural industries, and a rise in the demand for food from countries with diminishing farming lands.
The global market, by mode of operation, has been segmented into mounted, trailed, and others. The mounted segment is estimated to dominate the market in 2018 and is projected to grow at a higher CAGR by 2023. This can be attributed to the low turnaround time, high accuracy, and availability of large land holdings for cultivation, specifically in North America and Europe.
The soil aerators market, by application, has been segmented into agriculture and non-agriculture. The market, by application, was dominated by the agriculture segment in 2018. The dominance of agriculture in soil aerators is attributable to the increase in large-scale holdings of farmers in most developed countries and an increasing trend of farm mechanization in developing countries. The emerging trends in agricultural technology include a variety of multifunctional equipment, which are aligned with sensors, and are automated/hydraulic; these equipment focused by agricultural machinery manufacturers led the farmers to increase their crop yield to meet the rising demand for food products, worldwide.
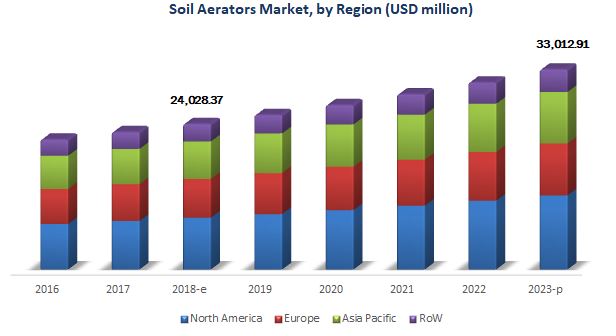
The Asia Pacific region accounted for the largest share in this market and is also expected to be the fastest growing market during the forecast period. This region has soil with poorly developed layers, owing to which farmers are inclined toward using soil aerators for enhancing the texture and structure of the soil. Also, the region has clay soil in abundance which gets compacted and forms cracks when dry, subsequently driving the need for soil aeration to make the land suitable for cultivation. The major drivers for the growth of the Asia Pacific soil aerators market include the rising urbanization and standard of living, increase in footfalls, overgrazing by livestock, the pressure exerted by heavy equipment, climatic conditions, strong government support through subsidies, and increased productivity requirements.
Lack of awareness among farmers and landscapers and increase in the no-till trend in the US, and small & fragmented land holdings restricting the usage of heavy farm machinery are the major restraints for the growth of this market.
The global market for soil aerators is dominated by large-scale players such as Deere & Company (US), Mahindra and Mahindra (India), Bucher Industries (Switzerland), CNH Industrial (UK), ALAMO (US), and AGCO Corporation (US).
To speak to our analyst for a discussion on the above findings, click Speak to Analyst
 Exclusive indicates content/data unique to MarketsandMarkets and not available with any competitors.
Table of Contents
1 Introduction (Page No. - 13)
1.1 Objectives of the Study
1.2 Market Definition
1.3 Market Scope
1.3.1 Years Considered
1.4 Currency Considered
1.5 Stakeholders
2 Research Methodology (Page No. - 18)
2.1 Research Data
2.1.1 Secondary Data
2.1.2 Primary Data
2.1.2.1 Breakdown of Primaries
2.2 Market Size Estimation
2.2.1 Bottom-Up Approach
2.2.2 Top-Down Approach
2.3 Data Triangulation
2.4 Research Assumptions & Limitations
2.4.1 Assumptions
2.4.2 Limitations
3 Executive Summary (Page No. - 25)
4 Premium Insights (Page No. - 29)
4.1 Attractive Opportunities in the Market
4.2 Market for Soil Aerators, By Key Country/Region
4.3 Asia Pacific: Market for Soil Aerators, By Equipment Type & Country
4.4 Market for Soil Aerators, By Mechanism & Region
4.5 Market for Soil Aerators, By Application & Region
5 Market Overview (Page No. - 33)
5.1 Introduction
5.2 Market Dynamics
5.2.1 Drivers
5.2.1.1 Shrinking Arable Land
5.2.1.2 Population Growth and Increase in Demand for Food
5.2.1.2.1 Increase in Residential and Commercial Landscaping
5.2.1.3 Increase in Net Farm Income Due to Mechanization
5.2.1.4 Shift Toward Organic Farming
5.2.2 Restraints
5.2.2.1 Small and Fragmented Land Holding Restricting the Usage of Heavy Farm Equipment
5.2.3 Opportunities
5.2.3.1 Innovations in Soil Aerator Types
5.2.4 Challenges
5.2.4.1 Lack of Awareness of Soil Aerators
5.2.4.2 Rise in No-Tillage Farming in the Us
5.3 Supply Chain
6 Soil Aerators Market, By Equipment Type (Page No. - 40)
6.1 Introduction
6.1.1 Secondary Tillage Equipment
6.1.1.1 Harrows
6.1.1.1.1 Disc Harrows
6.1.1.1.2 Off-Set Disc Harrows
6.1.1.2 Cultivators
6.1.1.3 Rollers & Pulverizers
6.1.1.4 Others
6.1.2 Primary Tillage Equipment
6.1.2.1 Mouldboard Plough
6.1.2.2 Disk Plough
6.1.2.3 Chisel Plough
6.1.2.4 Rotary Plough
6.1.2.5 Others
6.1.3 Weeding Equipment
6.1.4 Soil Aerating Equipment
7 Market for Soil Aerators, By Mechanism (Page No. - 53)
7.1 Introduction
7.1.1 Mechanical
7.1.2 Pneumatic
8 Market for Soil Aerators, By Mode of Operation (Page No. - 57)
8.1 Introduction
8.1.1 Mounted
8.1.2 Trailed
8.1.3 Others
9 Market for Soil Aerators, By Application (Page No. - 62)
9.1 Introduction
9.1.1 Agriculture
9.1.2 Non-Agriculture
10 Soil Aerators Market, By Region (Page No. - 67)
10.1 Introduction
10.2 North America
10.2.1 US
10.2.2 Canada
10.2.3 Mexico
10.3 Europe
10.3.1 Germany
10.3.2 France
10.3.3 UK
10.3.4 Italy
10.3.5 Spain
10.3.6 Poland
10.3.7 Rest of Europe
10.4 Asia Pacific
10.4.1 China
10.4.2 India
10.4.3 Japan
10.4.4 Australia
10.4.5 Indonesia
10.4.6 Rest of Asia Pacific
10.5 Rest of the World
10.5.1 South America
10.5.1.1 Brazil
10.5.1.2 Argentina
10.5.2 The Middle East
10.5.3 Africa
11 Competitive Landscape (Page No. - 98)
11.1 Overview
11.2 Company Rankings
11.3 Competitive Scenario
11.4 New Product Launches & Product Upgradation
11.5 Acquisitions
11.6 Technological Innovations and Investments
11.7 Expansion
12 Company Profiles (Page No. - 103)
(Business Overview, Products Offered, Recent Developments, SWOT Analysis, MnM View)*
12.1 Deere & Company
12.2 CNH Industrial N.V.
12.3 Agco Corporation
12.4 Alamo Group Inc.
12.5 Mahindra & Mahindra Ltd.
12.6 Bucher Industries AG
12.7 Buhler Industries Inc.
12.8 Lemken GmbH & Co. Kg
12.9 Salford Group, Inc.
12.10 Evers Agro B.V.
12.11 Vanmac Bv
12.12 Great Plains Manufacturing, Inc.
12.13 Selvatici SRL
12.14 Orthman Manufacturing, Inc.
12.15 Zappator SRL
*Details on Business Overview, Products Offered, Recent Developments, SWOT Analysis, MnM View Might Not Be Captured in Case of Unlisted Companies.
13 Appendix (Page No. - 135)
13.1 Discussion Guide
13.2 Knowledge Store: Marketsandmarkets� Subscription Portal
13.3 Introducing RT: Real-Time Market Intelligence
13.4 Available Customizations
13.5 Related Reports
13.6 Author Details
List of Tables (73 Tables)
Table 1 US Dollar Exchange Rate, 2014 - 2017
Table 2 Market Size, By Equipment Type, 2016�2023 (USD Million)
Table 3 Secondary Tillage Equipment Market Size, By Type, 2016�2023 (USD Million)
Table 4 Secondary Tillage Equipment: Market for Soil Aerators By Size, By Region, 2016�2023 (USD Million)
Table 5 Harrows: Soil Aerator Market Size, By Region, 2016�2023 (USD Million)
Table 6 Cultivators: Market Size, By Region, 2016�2023 (USD Million)
Table 7 Rollers & Pulverizers: Market Size, By Region, 2016�2023 (USD Million)
Table 8 Others: Soil Aerators Market Size, By Region, 2016�2023 (USD Million)
Table 9 Primary Tillage Equipment Market Size, By Type, 2016�2023 (USD Million)
Table 10 Primary Tillage Equipment: Market Size, By Region, 2016�2023 (USD Million)
Table 11 Mouldboard Plough: Market Size, By Region, 2016�2023 (USD Million)
Table 12 Disk Plough: Soil Aerators Market Size, By Region, 2016�2023 (USD Million)
Table 13 Chisel Plough: Market Size, By Region, 2016�2023 (USD Million)
Table 14 Rotary Plough: Market Size, By Region, 2016�2023 (USD Million)
Table 15 Others: Market Size, By Region, 2016�2023 (USD Million)
Table 16 Weeding Equipment: Soil Aerator Market for Soil Aerators By Size, By Region, 2016�2023 (USD Million)
Table 17 Soil Aerating Equipment: Market Size, By Region, 2016�2023 (USD Million)
Table 18 Market Size, By Mechanism, 2016�2023 (USD Million)
Table 19 Mechanical Soil Aerators Market Size, By Region, 2016�2023 (USD Million)
Table 20 Pneumatic Soil Aerator Market Size, By Region, 2016�2023 (USD Million)
Table 21 Market Size for Soil Aerators, By Mode of Operation, 2016�2023 (USD Million)
Table 22 Mounted Soil Aerators Market Size, By Region, 2016�2023 (USD Million)
Table 23 Trailed Soil Aerator Market Size, By Region, 2016�2023 (USD Million)
Table 24 Other Soil Aerator Market Size, By Region, 2016�2023 (USD Million)
Table 25 Market Size, By Application, 2016�2023 (USD Million)
Table 26 Agriculture: Market Size, By Region, 2016�2023 (USD Million)
Table 27 Non-Agriculture: Market Size, By Region, 2016�2023 (USD Million)
Table 28 Soil Aerators Market Size, By Non-Agriculture Application, 2016�2023 (USD Million)
Table 29 Market Size, By Region, 2016�2023 (USD Million)
Table 30 North America: Soil Aerators Market Size, By Country, 2016�2023 (USD Million)
Table 31 North America: Market Size, By Equipment Type, 2016�2023 (USD Million)
Table 32 North America: Market Size, By Mechanism, 2016�2023 (USD Million)
Table 33 North America: Market Size, By Mode of Operation, 2016�2023 (USD Million)
Table 34 North America: Market Size, By Application, 2016�2023 (USD Million)
Table 35 US: Soil Aerators Market, By Equipment Type, 2016�2023 (USD Million)
Table 36 Canada: Market Size, By Equipment Type, 2016�2023 (USD Million)
Table 37 Mexico:Soil Aerators Market Size, By Equipment Type, 2016�2023 (USD Million)
Table 38 Europe: Soil Aerators Market Size By Country, 2016�2023 (USD Million)
Table 39 Europe: Market Size By Equipment Type, 2016�2023 (USD Million)
Table 40 Europe: Market Size, By Mechanism, 2016�2023 (USD Million)
Table 41 Europe: Market Size, By Mode of Operation, 2016�2023 (USD Million)
Table 42 Europe: Market Size By Application, 2016�2023 (USD Million)
Table 43 Germany: Soil Aerators Market Size, By Equipment Type, 2016�2023 (USD Million)
Table 44 France: Market Size, By Equipment Type, 2016�2023 (USD Million)
Table 45 UK: Soil Aerators Market Size, By Equipment Type, 2016�2023 (USD Million)
Table 46 Italy: Market Size, By Equipment Type, 2016�2023 (USD Million)
Table 47 Spain: Soil Aerators Market Size, By Equipment Type, 2016�2023 (USD Million)
Table 48 Poland: Market Size, By Equipment Type, 2016�2023 (USD Million)
Table 49 Rest of Europe:Soil Aerators Market Size, By Equipment Type, 2016�2023 (USD Million)
Table 50 Asia Pacific: Soil Aerators Market Size, By Country, 2016�2023 (USD Million)
Table 51 Asia Pacific: Market Size, By Equipment Type, 2016�2023 (USD Million)
Table 52 Asia Pacific: Market Size, By Mechanism, 2016�2023 (USD Million)
Table 53 Asia Pacific: Market Size, By Mode of Operation, 2016�2023 (USD Million)
Table 54 Asia Pacific: Market Size, By Application, 2016�2023 (USD Million)
Table 55 China: Market Size, By Equipment Type, 2016�2023 (USD Million)
Table 56 India: Soil Aerators Market Size, By Equipment Type, 2016�2023 (USD Million)
Table 57 Japan: Market Size, By Equipment Type, 2016�2023 (USD Million)
Table 58 Australia: Soil Aerators Market Size, By Equipment Type, 2016�2023 (USD Million)
Table 59 Indonesia: Market Size, By Equipment Type, 2016�2023 (USD Million)
Table 60 Rest of Asia Pacific: Market Size, By Equipment Type, 2016�2023 (USD Million)
Table 61 RoW: Soil Aerators Market Size, By Region, 2016�2023 (USD Million)
Table 62 RoW: Market Size, By Equipment Type, 2016�2023 (USD Million)
Table 63 RoW: Market Size, By Mechanism, 2016�2023 (USD Million)
Table 64 RoW: Market Size, By Mode of Operation, 2016�2023 (USD Million)
Table 65 RoW: Market Size, By Application, 2016�2023 (USD Million)
Table 66 South America: Soil Aerators Market, By Equipment Type, 2016�2023 (USD Million)
Table 67 Middle East: Market, By Equipment Type, 2016�2023 (USD Million)
Table 68 Africa: Market for Soil Aerators, By Equipment Type, 2016�2023 (USD Million)
Table 69 Soil Aerator Market, Company Ranking, 2017
Table 70 New Product Launches & Product Upgradation, 2014�2017
Table 71 Acquisitions, 2012�2017
Table 72 Technological Innovation and Investments, 2012�February 2018
Table 73 Expansion, 2012-2017
List of Figures (40 Figures)
Figure 1 Market Segmentation
Figure 2 Geographic Scope
Figure 3 Market for Soil Aerators: Research Design
Figure 4 Market Size Estimation Methodology: Bottom-Up Approach
Figure 5 Market Size Estimation Methodology: Top-Down Approach
Figure 6 Data Triangulation & Methodology
Figure 7 Soil Aerators Market Size, By Region, 2018 vs 2023 (USD Billion)
Figure 8 Market Size, By Mode of Operation, 2018 vs 2023 (USD Billion)
Figure 9 Market Size, By Mechanism, 2018 vs 2023 (USD Billion)
Figure 10 Secondary Tillage Equipment: Most Attractive Market for the Equipment Type of Soil Aerators
Figure 11 Asia Pacific is Projected to Register Highest Growth Rate in Market, 2018�2023
Figure 12 Shrinking Arable Land & Shift Towards Organic Farming Drive the Demand for Soil Aerators
Figure 13 China is Projected to Be the Fastest-Growing Market From 2018 to 2023
Figure 14 Secondary Tillage Equipment Accounted for the Largest Share in 2017
Figure 15 Asia Pacific is Projected to Dominate the Market Across Both Mechanisms Through 2023
Figure 16 Agriculture Segment is Projected to Have A Higher Growth Rate During the Forecast Period
Figure 17 Soil Aerators: Market Dynamics
Figure 18 Arable Land (Hectares Per Person), 2005�2015
Figure 19 Population Trend, By Geography, 2012�2018 (Billion)
Figure 20 Total Construction Spending (Billion USD), 2014-2017
Figure 21 Supply Chain of Soil Aerator Manufacturers
Figure 22 Secondary Tillage Equipment Segment is Projected to Dominate the Market Throughout the Forecast Period
Figure 23 Mechanical Segment is Projected to Dominate the Market Through 2023
Figure 24 Mounted Mode of Operation to Lead During the Forecast Period
Figure 25 Agriculture Segment is Projected to Hold A Larger Share Throughout the Forecast Period
Figure 26 China and India to Be the Most Attractive Markets for Soil Aerator Manufacturers (2018�2023)
Figure 27 Asia Pacific Snapshot: Soil Aeration Market
Figure 28 Key Developments By Leading Players in the Market (2014�February 2018)
Figure 29 Deere & Company: Company Snapshot
Figure 30 Deere & Company: SWOT Analysis
Figure 31 CNH Industrial N.V.: Company Snapshot
Figure 32 CNH Industrial N.V.: SWOT Analysis
Figure 33 Agco Corporation: Company Snapshot
Figure 34 Agco Corporation: SWOT Analysis
Figure 35 Alamo Group Inc.: Company Snapshot
Figure 36 Alamo Group Inc.: SWOT Analysis
Figure 37 Mahindra & Mahindra Ltd.: Company Snapshot
Figure 38 Mahindra & Mahindra Ltd.:: SWOT Analysis
Figure 39 Bucher Industries AG: Company Snapshot
Figure 40 Buhler Industries Inc.: Company Snapshot


Growth opportunities and latent adjacency in Soil Aerators Market