Printed Sensors Market by Printed Sensor Type (Biosensor, Touch Sensor, Image Sensor, Temperature Sensor), Printing Technology (Ink-Jet Printing, Screen Printing, Flexographic Printing), Application, and Geography - Global Trend and Forecast to 2022


The printed sensors market was valued at USD 6.71 Billion in 2015 and is expected to reach USD 10.46 Billion by 2022, at a CAGR of 7.0% during the forecast period. The growing application of printed sensors in wearable medical devices and in consumer electronics is a major driver for the printed sensors market. Additionally, some of significant opportunities in the future for the printed sensors are the growing trends of touch-enabled electronic devices and Internet of Things. The base year used for this study is 2015 and the forecast period is between 2016 and 2022.
The objectives of the study are as follows:
- To define, describe, and forecast the global printed sensors market on the basis of type, printing technology, material, application, and geography
- To forecast the market size, in terms of value, for various segments with respect to four main regions (along with their respective countries), namely, North America, Europe, Asia-Pacific, and Rest of the World
- To provide detailed information regarding the major factors influencing the growth of the printed sensors market (drivers, restraints, opportunities, industry-specific challenges, Porter’s five force analysis, and value chain analysis)
- To strategically analyze the micromarkets1 with respect to the individual growth trends, future prospects, and contribution to the total market
- To analyze the opportunities for various stakeholders by identifying the high-growth segments of the printed sensors market
- To strategically profile key players and comprehensively analyze their market shares and core competencies2 along with detailing the competitive landscape
- To analyze various competitive developments such as joint ventures, mergers & acquisitions, new product developments, expansions, and research & development in the printed sensors market
The printed sensors market was valued at USD 6.71 Billion in 2015 and is expected to reach USD 10.46 Billion by 2022, at a CAGR of 7.0% between 2016 and 2022. The growth of this market is propelled by the advantages offered by printed sensors over conventional silicon-based sensors. Unlike the conventional sensor technology, printed sensors are flexible, thin, lightweight, and organic. The disadvantages of conventional sensors such as rigidity, bulkiness, and complex architecture among others are largely overcome by printed sensors. Thus, the demand for printed sensors is expected to grow significantly in the near future.
The printed biosensors lead printed sensors market. The large market share of printed biosensors is attributed to the high demand for glucose test strips which are used for diabetes monitoring and are the most matured type of printed sensors. Moreover, the rapid technological advancements, growing demand for glucose monitoring in diabetic patients, and rising demand for home-based point-of-care devices are the significant growth drivers for the printed biosensors market. In addition to this, the growing integration of biosensors in consumer electronics and environmental monitoring applications also contributes to the large market share of the printed biosensors market.
The smart packing application is expected to grow at a high CAGR during the forecast period. Printed sensors play a major role in the smart packaging application as they help the manufacturers to keep track of their inventories. They are also used to monitor temperature, humidity, and gas for sensitive products, especially food and beverages. Moreover, given the rise in the adoption of smart packaging across the globe to increase the visibility, hygiene, quality, and safety of the product, there is a demand for printed sensors.

Europe held the largest share of the printed market in 2015, while the market in Asia-Pacific is expected to grow at the highest rate during the forecast period. The high growth of the Asia-Pacific market is attributed to the presence of a number of leading consumer electronics manufacturers, rapid industrialization in the region, the growth in the production of commercial as well as non-commercial vehicles with driver assistance systems and touch infotainment systems, and the increasing number of patients of lifestyle diseases such as diabetes.
One of the key restraining factors for the companies operating in this industry is the selection of the right materials for the sensor. The materials used in the fabrication of printed sensors are substrates and electrically functional inks. The obstacles in terms of the low electrical conductivity and high resistance of the ink are a major restraint for the development of printed sensors. It is also essential to choose suitable printing methods along with the right conductive ink to cater to the growing requirements of high-precision advanced medical or electronic devices.
ISORG SA (France) is a major player in the printed sensors market and holds a leading position in developing printed image sensors and photodetectors with organic materials. ISORG is a pioneer in developing photodetectors and image sensors using organic and smart substrates such as plastic and glass. The company’s sensors are very robust as well as scratch and dust proof, which makes them compatible with the industry environment and easy to use. Through its products, the company serves various applications such as consumer electronics, home appliances, smart building & lighting, industrial, health care & life sciences, safety & security, environment, and toys & education.
To speak to our analyst for a discussion on the above findings, click Speak to Analyst
 Exclusive indicates content/data unique to MarketsandMarkets and not available with any competitors.
Table of Contents
1 Introduction (Page No. - 15)
1.1 Objectives of the Study
1.2 Market Definition
1.3 Study Scope
1.3.1 Markets Covered
1.3.2 Geographic Scope
1.3.3 Years Considered for the Study
1.4 Currency
1.5 Limitations
1.6 Stakeholders
2 Research Methodology (Page No. - 19)
2.1 Research Data
2.1.1 Secondary Data
2.1.1.1 Key Data From Secondary Sources
2.1.2 Primary Data
2.1.2.1 Key Data From Primary Sources
2.1.2.2 Key Industry Insights
2.1.2.3 Breakdown of Primaries
2.2 Market Size Estimation
2.2.1 Bottom-Up Approach
2.2.2 Top-Down Approach
2.3 Market Breakdown & Data Triangulation
2.4 Research Assumptions
3 Executive Summary (Page No. - 27)
4 Premium Insights (Page No. - 33)
4.1 Attractive Growth Opportunities in the Printed Sensors Market
4.2 Printed Sensors Market, By Type (2016–2022)
4.3 Market, By Region and Application
4.4 Market, By Region (2016)
4.5 Market, By Printing Technology
5 Market Overview (Page No. - 37)
5.1 Introduction
5.2 Market Segmentation
5.2.1 Printed Sensors Market, By Type
5.2.2 Market, By Printing Technology
5.2.3 Market, By Material
5.2.4 Market, By Application
5.2.5 Market, By Geography
5.3 Market Dynamics
5.3.1 Drivers
5.3.1.1 Growing Integration of Printed Sensors in Medical Wearable Devices
5.3.1.2 Increasing Importance of Smart Packaging
5.3.1.3 Benefits Offered By Printed Sensors Over Conventional Sensing Technology
5.3.2 Restraints
5.3.2.1 Technical Complications in Selecting the Right Materials
5.3.2.2 High Set-Up Investment
5.3.3 Opportunities
5.3.3.1 Internet of Things to Open Up New Growth Avenues
5.3.3.2 Growing Trend of Touch-Enabled Electronic Devices
5.3.4 Challenges
5.3.4.1 Meeting the Required Level of Performance in Real-Time Applications
6 Industry Trends (Page No. - 45)
6.1 Introduction
6.2 Value Chain Analysis
6.3 Porter’s Five Forces Model
6.3.1 Threat of New Entrants
6.3.2 Threat of Substitutes
6.3.3 Bargaining Power of Suppliers
6.3.4 Bargaining Power of Buyers
6.3.5 Intensity of Rivalry
7 Printed Sensors Market Analysis, By Type (Page No. - 52)
7.1 Introduction
7.2 Printed Biosensors
7.3 Printed Touch Sensors
7.4 Printed Gas Sensors
7.5 Printed Humidity Sensors
7.6 Printed Image Sensors
7.7 Printed Pressure Sensors
7.8 Printed Temperature Sensors
7.9 Printed Proximity Sensor
8 Printed Sensors Market, By Printing Technology (Page No. - 81)
8.1 Introduction
8.2 Gravure Printing
8.2.1 Advantages of Gravure Printing
8.2.2 Disadvantages of Gravure Printing
8.3 Inkjet Printing
8.3.1 Continuous Inkjet Printing
8.3.1.1 Advantages of Continuous Inkjet Printing
8.3.2 Drop-On-Demand Inkjet Printing
8.3.2.1 Advantages of Drop-On-Demand Inkjet Printing
8.4 Screen Printing
8.4.1 Advantages of Screen Printing
8.4.2 Disadvantages of Screen Printing
8.5 Flexographic Printing
8.5.1 Advantages of Flexographic Printing
8.5.2 Disadvantages of Flexographic Printing
8.6 Others
8.6.1 Offset Lithography
8.6.2 Aerosol Printing
8.6.3 3d Printing
9 Materials Used in Printed Sensors (Page No. - 89)
9.1 Introduction
9.2 Substrates
9.2.1 Plastic
9.2.1.1 Polyimide
9.2.1.2 Polyethylene Naphthalene
9.2.1.3 Polyethylene Terephthalate
9.2.2 Paper
9.2.3 Silicon
9.2.4 Glass
9.3 Inks
9.3.1 Conductive Inks
9.3.1.1 Silver Ink
9.3.2 Dielectric Inks
9.3.3 Carbon Nanotubes
9.3.4 Graphene Inks
10 Printed Sensors Market Analysis, By Application (Page No. - 93)
10.1 Introduction
10.2 Automotive Application
10.3 Consumer Electronics
10.3.1 Smartphones
10.3.2 Wearable Devices
10.3.3 Others
10.4 Environmental Monitoring
10.5 Industrial Equipment
10.6 Medical Devices
10.7 Building Automation
10.8 Smart Packaging
10.9 Others
11 Geographic Analysis (Page No. - 114)
11.1 Introduction
11.2 North America
11.2.1 U.S.
11.2.1.1 Expected to Be the Largest Market for Printed Sensors in 2016
11.2.2 Canada
11.2.2.1 Fastest-Growing Printed Sensors Market in North America
11.2.3 Mexico
11.2.3.1 Improving Manufacturing Infrastructure to Propel the Demand for Printed Sensors
11.3 Europe
11.3.1 U.K.
11.3.1.1 A Significant Market for Printed Sensors
11.3.2 Germany
11.3.2.1 Germany Held the Largest Share of the European Printed Sensors Market in 2015
11.3.3 France
11.3.3.1 Huge Potential for the Development of the Market
11.3.4 Rest of Europe
11.3.4.1 Opportunity From Medical Device and Consumer Electronics Applications
11.4 Asia-Pacific
11.4.1 China
11.4.1.1 Increasing Consumer Electronics Production Fueling the Chinese Printed Sensors Market
11.4.2 Japan
11.4.2.1 Presence of Key Manufacturers Driving the Market in This Country
11.4.3 South Korea
11.4.3.1 Great Scope for Development
11.4.4 Rest of Asia-Pacific
11.4.4.1 Rest of APAC: India & Australia are Emerging Markets With Significant Potential
11.5 Rest of the World
11.5.1 South America
11.5.1.1 Developing Economies Expected to Drive Future Growth
11.5.2 Middle East
11.5.2.1 Infrastructure Development in the Middle East Would Drive This Market
11.5.3 Africa
11.5.3.1 Holds A Significant Share of The RoW Market for Printed Sensors
12 Competitive Landscape (Page No. - 130)
12.1 Overview
12.2 Market Ranking Analysis
12.3 Competitive Situation and Trends
12.3.1 New Product Launches
12.3.2 Collaborations & Partnerships
12.3.3 Agreements & Expansions
13 Company Profiles (Page No. - 135)
(Overview, Products and Services, Financials, Strategy & Development)*
13.1 Introduction
13.2 Interlink Electronics, Inc.
13.3 Thin Film Electronics ASA
13.4 GSI Technologies, LLC
13.5 ISORG SA
13.6 KWJ Engineering Inc.
13.7 Peratech Holdco Limited
13.8 Canatu Oy
13.9 Mc10, Inc.
13.10 Polyic GmbH & Co. Kg
13.11 PST Sensors
13.12 Tekscan, Inc.
*Details on Overview, Products and Services, Financials, Strategy & Development Might Not Be Captured in Case of Unlisted Companies
14 Appendix (Page No. - 155)
14.1 Insights of Industry Experts
14.2 Discussion Guide
14.3 Knowledge Store: Marketsandmarkets’ Subscription Portal
14.4 Introducing RT: Real-Time Market Intelligence
14.5 Available Customizations
14.6 Related Reports
List of Tables (65 Tables)
Table 1 Printed Sensors Market Size, in Terms of Value and Volume, 2013–2022
Table 2 Printed Sensor Market, By Type, 2013–2022 (USD Million)
Table 3 Printed Biosensors Market, By Application, 2013–2022 (USD Million)
Table 4 Printed Biosensors Market for Consumer Electronics Application, By Region, 2013–2022 (USD Million)
Table 5 Printed Biosensors Market for Environmental Monitoring Application, By Region, 2013–2022 (USD Million)
Table 6 Printed Biosensors Market for Medical Devices Application, By Region, 2013–2022 (USD Million)
Table 7 Printed Touch Sensors Market, By Application, 2013–2022 (USD Million)
Table 8 Printed Touch Sensors Market for Automotive Application, By Region, 2013–2022 (USD Million)
Table 9 Printed Touch Sensors Market for Consumer Electronics Application, By Region, 2013–2022 (USD Million)
Table 10 Printed Touch Sensors Market for Industrial Equipment Application, By Region, 2013–2022 (USD Million)
Table 11 Printed Touch Sensors Market for Medical Devices Application, By Region, 2013–2022 (USD Million)
Table 12 Printed Touch Sensors Market for Building Automation Application, By Region, 2013–2022 (USD Million)
Table 13 Printed Touch Sensors Market for Smart Packaging Application, By Region, 2013–2022 (USD Million)
Table 14 Printed Touch Sensors Market for Other Applications, By Region, 2013–2022 (USD Million)
Table 15 Printed Gas Sensors Market, By Application, 2013–2022 (USD Million)
Table 16 Printed Humidity Sensors Market, By Application, 2013–2022 (USD Million)
Table 17 Printed Image Sensors Market, By Application, 2013–2022 (USD Million)
Table 18 Printed Image Sensors Market for Automotive Application, By Region, 2013–2022 (USD Million)
Table 19 Printed Image Sensors Market for Consumer Electronics Application, By Region, 2013–2022 (USD Million)
Table 20 Printed Image Sensors Market for Industrial Equipment Application, By Region, 2013–2022 (USD Million)
Table 21 Printed Image Sensors Market for Medical Devices Application, By Region, 2013–2022 (USD Million)
Table 22 Printed Image Sensors Market for Building Automation Application, By Region, 2013–2022 (USD Million)
Table 23 Printed Image Sensors Market for Smart Packaging Application, By Region, 2013–2022 (USD Million)
Table 24 Printed Image Sensors Market for Other Application, By Region, 2013–2022 (USD Million)
Table 25 Printed Pressure Sensors Market, By Application, 2013–2022 (USD Million)
Table 26 Printed Pressure Sensors Market for Automotive Application, By Region, 2013–2022 (USD Million)
Table 27 Printed Pressure Sensors Market for Consumer Electronics Application, By Region, 2013–2022 (USD Million)
Table 28 Printed Pressure Sensors Market for Environmental Monitoring Application, By Region, 2013–2022 (USD Million)
Table 29 Printed Pressure Sensors Market for Industrial Equipment Application, By Region, 2013–2022 (USD Million)
Table 30 Printed Pressure Sensors Market for Medical Devices Application, By Region, 2013–2022 (USD Million)
Table 31 Printed Pressure Sensors Market for Building Automation Application, By Region, 2013–2022 (USD Million)
Table 32 Printed Pressure Sensors Market for Other Applications, By Region, 2013–2022 (USD Million)
Table 33 Printed Temperature Sensors Market, By Application, 2013–2022 (USD Million)
Table 34 Printed Sensors Market, By Printing Technology, 2013–2022 (USD Million)
Table 35 Market, By Application, 2013–2022 (USD Million)
Table 36 Printed Sensors Market for Automotive Application, By Type, 2013–2022 (USD Million)
Table 37 Market for Automotive Application, By Region, 2013–2022 (USD Million)
Table 38 Printed Sensors Market for Consumer Electronics Application, By Subapplication, 2013–2022 (USD Million)
Table 39 Market for Consumer Electronics Application, By Type, 2013–2022 (USD Million)
Table 40 Printed Sensors Market for Consumer Electronics Application, By Region, 2013–2022 (USD Million)
Table 41 Market for Environmental Monitoring, By Type, 2013–2022 (USD Million)
Table 42 Printed Sensors Market for Environmental Monitoring, By Region, 2013–2022 (USD Million)
Table 43 Market for Industrial Equipment Application, By Type, 2013–2022 (USD Million)
Table 44 Printed Sensors Market for Industrial Equipment Application, By Region, 2013–2022 (USD Million)
Table 45 Market for Medical Devices Application, By Type, 2013–2022 (USD Million)
Table 46 Printed Sensors Market for Medical Devices Application, By Region, 2013–2022 (USD Million)
Table 47 Market for Building Automation Application, By Type, 2013–2022 (USD Million)
Table 48 Printed Sensors Market for Building Automation Application, By Region, 2013–2022 (USD Million)
Table 49 Market for Smart Packaging Application, By Type, 2013–2022 (USD Million)
Table 50 Printed Sensors Market for Smart Packaging Application, By Region, 2013–2022 (USD Million)
Table 51 Market for Other Applications, By Type, 2013–2022 (USD Million)
Table 52 Market for Other Applications, By Region, 2013–2022 (USD Million)
Table 53 Market, By Region, 2013–2022 (USD Million)
Table 54 Printed Sensors Market in North America, By Country, 2013–2022 (USD Million)
Table 55 Market in North America, By Application, 2013–2022 (USD Million)
Table 56 Market in Europe, By Country, 2013–2022 (USD Million)
Table 57 Market in Europe, By Application, 2013–2022 (USD Million)
Table 58 Printed Sensors Market in Asia-Pacific, By Country, 2013–2022 (USD Million)
Table 59 Market in Asia-Pacific, By Application, 2013–2022 (USD Million)
Table 60 Market in RoW, By Region, 2013–2022 (USD Million)
Table 61 Market in RoW, By Application, 2013–2022 (USD Million)
Table 62 Printed Sensors Market: Market Ranking Analysis (2015)
Table 63 Most Significant New Product Launches in the Printed Sensors Market (2013–2016)
Table 64 Most Significant Collaborations and Partnerships in the Printed Sensors Market (2015–2016)
Table 65 Most Significant Agreements and Contracts in the Market (2014–2016)
List of Figures (67 Figures)
Figure 1 Segments Covered in Printed Sensors Market
Figure 2 Printed Sensors Market: Research Design
Figure 3 Market: Bottom-Up Approach
Figure 4 Market: Top-Down Approach
Figure 5 Data Triangulation
Figure 6 Assumptions of the Research Study
Figure 7 Printed Sensors: Market Segmentation
Figure 8 Printed Sensors Market Snapshot (2016 vs 2022): Printed Biosensors Expected to Hold the Largest Market Share Between 2016 and 2022
Figure 9 Screen Printing Technology to Hold the Largest Market Share During the Forecast Period
Figure 10 Market for Smart Packaging Application Expected to Grow at the Highest Rate During the Forecast Period
Figure 11 Europe to Hold the Largest Share of the Printed Sensors Market in 2016
Figure 12 Printed Sensors Market Expected to Have A Huge Growth Opportunity in APAC Between 2015 and 2022
Figure 13 Printed Biosensors to Hold the Largest Market Share During the Forecast Period
Figure 14 Europe to Hold the Largest Share of the Printed Sensors Market in 2016
Figure 15 U.S. to Hold the Largest Share of the Market in 2016
Figure 16 Market for Inkjet Printing Technology to Grow at A Highest Rate Between 2016 and 2022
Figure 17 Drivers, Restraints, Opportunities, and Challenges in the Printed Sensors Market
Figure 18 Value Chain Analysis: Major Value Addition is Done During the Manufacturing & Assembly Phase
Figure 19 Porter’s Five Forces Analysis - 2015
Figure 20 Impact Analysis: Market
Figure 21 High Impact of Threat of New Entrants on the Printed Sensors Market
Figure 22 Medium Impact of Threat of Substitutes on the Printed Sensors Market
Figure 23 Medium Impact of Bargaining Power of Suppliers on the Printed Sensors Market
Figure 24 Medium Impact of Bargaining Power of Buyers in the Printed Sensors Market
Figure 25 Medium Impact of Intensity of Rivalry in the Market
Figure 26 Printed Sensors Market, By Type
Figure 27 Printed Image Sensor Market Expected to Grow at the Highest Rate Between 2016 and 2022
Figure 28 Consumer Electronics Application Expected to Lead the Printed Biosensors Market By 2022
Figure 29 Consumer Electronics Application of Printed Touch Sensors Expected to Grow at the Highest Rate Between 2016 and 2022
Figure 30 North America to Hold the Largest Size of the Printed Touch Sensor Market for Smart Packaging Application By 2022
Figure 31 Smart Packaging Application of Printed Gas Sensors to Dominate the Market Between 2016 and 2022
Figure 32 Consumer Electronics Application of Printed Image Sensors Expected to Witness the Highest Growth Rate Between 2016 and 2022
Figure 33 Asia-Pacific to Hold the Largest Market Share By 2022
Figure 34 North America Expected to Lead the Printed Pressure Sensor Market for Consumer Electronics Application By 2022
Figure 35 Smart Packaging Application of Printed Temperature Sensors Expected to Grow at the Highest Rate Between 2016 and 2022
Figure 36 Market, By Printing Technology
Figure 37 Inkjet Printing Technology to Witness the Highest Growth Rate Between 2016 and 2022
Figure 38 Material Used in Printed Sensors
Figure 39 Printed Sensors Market, By Application
Figure 40 Market for Smart Packaging Application Expected to Grow at the Highest Rate Between 2016 and 2022
Figure 41 Printed Image Sensors Expected to Dominate the Market for the Automotive Application By 2022
Figure 42 Printed Biosensors Market to Lead the Consumer Electronics Application Between 2016 and 2022
Figure 43 Printed Gas Sensors Market Expected to Grow at the Highest Rate Between 2016 and 2022
Figure 44 Printed Pressure Sensor to Hold the Largest Market Size in 2016
Figure 45 Europe to Hold the Largest Biosensor Market Share for Medical Devices Application Between 2016 and 2022
Figure 46 Printed Touch Sensors to Lead the Building Automation Application By 2022
Figure 47 Printed Touch Sensors to Hold the Largest Market Share By 2022
Figure 48 Printed Image Sensors Expected to Lead the Market for Other Applications By 2022
Figure 49 Geographic Snapshot (2016): Rapidly Growing Markets Such as Japan and Canada are Emerging as Potential Markets
Figure 50 Europe to Hold the Largest Share of the Printed Sensors Market in 2016
Figure 51 North America Market Snapshot: Demand Expected to Be Driven By Medical Devices Application in the Near Future
Figure 52 Market in Canada Expected to Grow at the Highest Rate Between 2016 and 2022
Figure 53 Germany to Lead the European Market for Printed Sensors Between 2016 and 2022
Figure 54 Asia-Pacific Market Snapshot: Market Expected to Be Driven By the Smart Packaging Application
Figure 55 China Expected to Lead the Asia-Pacific Printed Sensors Market in 2016
Figure 56 Market in the Middle East to Grow at the Highest Rate Between 2016 and 2022
Figure 57 Companies Adopted Collaborations as the Key Growth Strategy Between 2014 and 2016
Figure 58 Market Evaluation Framework - 2015 and 2016
Figure 59 Battle for Market Share: Collaborations and Partnerships Was the Key Strategy
Figure 60 Interlink Electronics, Inc.: Company Snapshot
Figure 61 Interlink Electronics, Inc.: SWOT Analysis
Figure 62 Thin Film Electronics ASA: Company Snapshot
Figure 63 Thin Film Electronics ASA: SWOT Analysis
Figure 64 GSI Technologies, LLC.: SWOT Analysis
Figure 65 ISORG SA: SWOT Analysis
Figure 66 KWJ Engineering Inc.: SWOT Analysis
Figure 67 Peratech Holdco Limited: SWOT Analysis
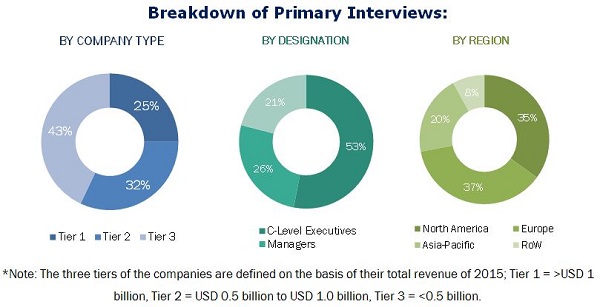
The research methodology used to estimate and forecast the printed sensors market begins with capturing data on key vendor revenue through secondary research from sources such as Factiva, Bloomberg, and OneSource. The vendor offerings are also taken into consideration to determine the market segmentation. The bottom-up procedure has been employed to arrive at the overall size of the global printed sensors market from the revenues of key players in the market. After arriving at the overall market size, the total market has been split into several segments and subsegments which have been verified through the primary research by conducting extensive interviews of people holding key positions such as CEOs, VPs, directors, and executives. The market breakdown and data triangulation procedures have been employed to complete the overall market engineering process and arrive at the exact statistics for all segments and subsegments. The breakdown of profiles of primaries is depicted in the figure below:
To know about the assumptions considered for the study, download the pdf brochure
The printed sensors ecosystem comprises raw material vendors such as FlexEnable Limited (U.K.), T+ink, Inc. (U.S.), Brewer Science, Inc. (U.S.), DuPont (U.S.), and Palo Alto Research Center (PARC) Inc. (U.S.) among others and printed sensor manufacturers such as Interlink Electronics, Inc. (U.S.), Thin Film Electronics ASA (Norway), ISORG (France), Peratech Holdco Ltd (U.K.), and KWJ Engineering Inc., (U.S.) among others who sell these sensors to end users to cater to their unique requirements. The end users are from a wide range of industries such as medical devices, consumer electronics, environmental monitoring, building automation, automotive, and many others.
Target Audience:
- Associations and industrial bodies
- End-user industries
- Government bodies such as regulating authorities and policy makers
- Market research and consulting firms
- Printed sensors manufacturers
- Printed sensors traders/suppliers
- Raw chemical suppliers and distributors
- Research institutes and organizations
- Sensor manufacturers
The study answers several questions for the target audiences, primarily, which market segments to focus on in the next two to five years for prioritizing efforts and investments.
Report Scope:
In this report, the printed sensors market has been segmented on the basis of the following categories, along with the industry trends:
By Type:
- Printed Biosensor
- Printed Touch Sensor
- Printed Gas Sensor
- Printed Humidity Sensor
- Printed Image Sensor
- Printed Pressure Sensor
- Printed Temperature Sensor
- Printed Proximity Sensor
By Printing Technology:
- Gravure Printing
- Inkjet Printing
- Screen Printing
- Flexography
- Others
By Application:
- Introduction
- Automotive
-
Consumer Electronics
- Smartphones
- Wearable Devices
- Others
- Environmental Testing
- Industrial Equipment
- Medical Devices
- Building Automation
- Smart Packaging
- Others
By Region:
-
North America
- U.S.
- Canada
- Mexico
-
Europe
- U.K.
- Germany
- France
- Rest of Europe
-
Asia-Pacific
- China
- Japan
- South Korea
- Rest of APAC
-
Rest of the World
- South America
- Middle East
- Africa
Available Customizations:
With the given market data, MarketsandMarkets offers customizations according to the company’s specific needs. The following customization options are available for the report:
Company Information
Detailed analysis and profiling of additional market players (up to five)


Growth opportunities and latent adjacency in Printed Sensors Market