Protective Cultures Market by Product Form (Freeze-dried and Frozen), Target Microorganism (Yeasts & Molds and Bacteria), Application (Dairy & Dairy Products, Meat & Poultry Products, and Seafood), Composition, and Region - Global Forecast to 2023


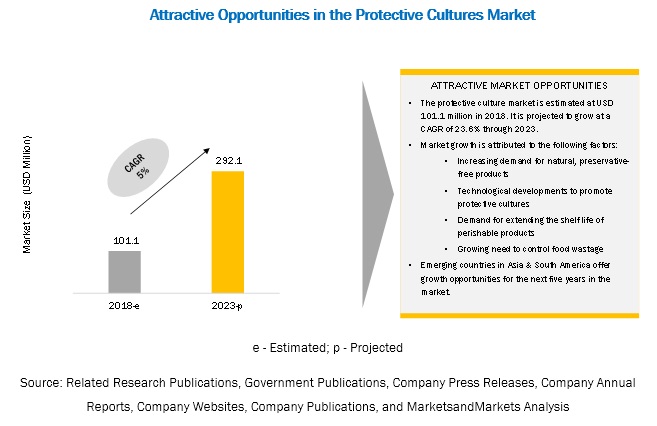
[145 Pages Report] The protective culture market is estimated to account for a value of USD 101.1 million in 2018 and is projected to grow at a CAGR of 23.6% from 2018, to reach a value of USD 292.1 million by 2023. The increasing consumption of dairy products and the increasing consumer awareness about clean label products and their advantages are among the key factors driving the growth of the protective food cultures market.
By product form, the freeze-dried segment is projected to be the fastest-growing segment in the market during the forecast period.
The freeze-dried segment in the protective cultures market is projected to grow at a higher CAGR of 23.8% during the forecast period. Protective cultures are highly unstable during storage and need to be preserved well to extend their shelf life. Freeze-dried protective cultures are considered the most convenient form for their application in various industries. Freeze-dried cultures remain increasingly preferred due to long-term storage and handling features.
By target microorganism, the yeast & molds segment is projected to dominate the market during the forecast period.
Microorganisms are recorded as the major contaminants that degrade food products. Fermented products are more prone to spoilage by microorganisms. The common spoilage microorganisms include yeasts, molds, and bacteria. There are certain good bacteria and other microorganisms that, when added to food and beverage products, prevent spoilage by competing with the spoilage microorganisms for nutrients.
By application, the dairy and dairy products segment is projected to dominate the market during the forecast period.
Based on application, the dairy & dairy products segment is expected to dominate the food & beverage protective cultures market due to the wide consumption of dairy products such as cheese, yogurt, and butter across the globe. The cheese industry is also one of the major application areas of protective cultures. Companies such as Chr Hansen and DuPont Danisco have a significant presence in the dairy & dairy products segment with a wide array of dairy protective cultures.
By composition, the multi-strain mixed protective cultures segment is projected to dominate the market during the forecast period.
Based on composition, the market of multi-strain mixed protective cultures is projected to hold the largest market share by 2023, owing to the fact that each microorganism in these cultures performs specific functions, and hence, there is no need to use multiple single-strain cultures.
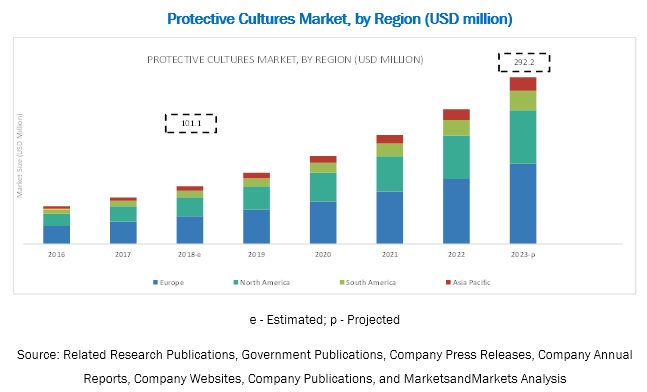
The increasing demand for protective cultures in the North American and European regions is driving the growth of the protective market.
Europe accounted for the largest share of the market. The dominant status of Europe can be attributed to the strong dairy industry in the region. . The strong demand for milk products in the global market and the decision to increase output have had a positive impact on the European dairy market. The support from the European dairy market has played a key role in driving the growth of the protective cultures market.
Key Market Players
The key players in this market include Chr Hansen (Denmark), DowDuPont (US), Sacco S.R.L (Italy), CSK Food Enrichment B.V. (Netherlands), THT S.A. (Belgium), Dalton Biotechnologies (Italy), Biochem S.R.L (Italy), Meat Cracks Technology GmbH (Germany), Royal DSM N.V. (Netherlands), Bioprox (France), Aristomenis D. Phikas & Co SA. (Greece), and Soyuzsnab Group of Companies (Russia). The key market players, along with other players, adopted various business strategies such as new product launches, expansions, and agreements & partnerships in the last few years to meet the growing demand for protective cultures.
Recent Developments:
- In November 2018, DSM expanded its Delvo Guard protective cultures to reinforce safety standards for clean label products. The culture is designed to prevent the formation of yeasts & molds in dairy products to extend the shelf life of products without any effect on the taste and texture
- In October 2018, The DuPont Nutrition & Health Team in South America launched the DuPont Danisco Lactobacillus Plus which combines strains of L. paracasei, helveticus, and acidophilus in the production of fermented milk. These strains provide a better balance in terms of flavor and acidity while optimizing the production process through rapid fermentation.
- In June 2018, Meat Cracks Technologies GmbH launched a new variant of its M-Culture bioprotective cultures to combat listeria and other pathological strains in the meat products. The new product is designed to meet regulations barring the product from exceeding the listeria cell count limit value of 100 cfu/g to improve safety and the shelf life of the product.
- In April 2018, DuPont Nutrition & Health launched a new line of cheese cultures for industrial producers of cheese products. The CHOOZIT SWIFT 600 and CHOOZIT AMERI-FLEX can be sampled in pizza cheese and are designed to offer better consistency and reliability in the manufacturing process.
- In November 2017, Chr. Hansen launched the second generation of its FreshQ line of bio-protective cultures. The new line of protective cultures offers improved solutions in terms of applicability and benefits. It is designed to withstand higher temperatures and maintain the product’s integrity for a longer period of time.
- In December 2017, CSK Food Enrichment B.V. expanded its presence with the opening of a new facility in Wageningen University and Research campus (Netherlands). The new facility is home to the company’s R&D department. The campus would be directly responsible for the launch of the next generation products in the CSK product portfolio.
Key questions addressed by the report:
- What are the new application areas for the global market that companies are exploring?
- Who are some of the key players operating in the protective cultures and how intense is the competition?
- What kind of competitors and stakeholders would be interested in this market? What will be their go-to-market strategy, and which emerging market will be of significant interest?
- How are the current R&D activities and M&A’s in the protective cultures projected to create a disrupting environment in the coming years?
- What will be the level of impact of new product launches on the revenues of stakeholders, due to the benefits offered by protective cultures market, such as increasing revenue, environmental regulatory compliance, and sustainable profits for the suppliers?
To speak to our analyst for a discussion on the above findings, click Speak to Analyst
 Exclusive indicates content/data unique to MarketsandMarkets and not available with any competitors.
Table of Contents
1 Introduction (Page No. - 15)
1.1 Objectives of the Study
1.2 Market Definition
1.3 Market Segmentation
1.4 Protective Cultures Market, By Region
1.5 Periodization Considered
1.6 Currency
1.7 Stakeholders
2 Research Methodology (Page No. - 19)
2.1 Research Data
2.1.1 Secondary Data
2.1.2 Primary Data
2.1.2.1 Breakdown of Primaries
2.2 Market Size Estimation
2.2.1 Bottom-Up Approach
2.2.2 Top-Down Approach
2.3 Data Triangulation
2.3.1 Market Breakdown and Data Triangulation
2.4 Research Assumptions
2.5 Research Limitations
3 Executive Summary (Page No. - 26)
4 Premium Insights (Page No. - 32)
4.1 Opportunities in this Market
4.2 Market, By Key Country
4.3 Developed vs Developing Markets for Protective Cultures
4.4 Protective Cultures Market, By Product Form
4.5 Market, By Target Microorganism
4.6 Europe: Protective Cultures Market, By Composition and Country, 2017
5 Market Overview (Page No. - 36)
5.1 Introduction
5.2 Industry Trends
5.2.1 Demand for Clean Label Products
5.2.2 Sustainable Nutrition
5.2.3 Consumer Preference Toward an Active Lifestyle
5.2.4 Improving Transparency
5.2.5 Reducing Food Spoilage
5.3 Patent Analysis
5.4 Market Dynamics
5.4.1 Drivers
5.4.1.1 Increasing Demand for Natural, Preservative-Free Products
5.4.1.2 Technological Developments to Promote Protective Cultures
5.4.1.3 Demand for Extending the Shelf Life of Perishable Products
5.4.1.4 Growing Need to Control Food Wastage
5.4.2 Restraints
5.4.2.1 Stringent Regulations Concerning the Use of Protective Cultures
5.4.2.1.1 World Trade Organization
5.4.2.1.2 European Food Safety Authority & Qualified Presumption of Safety
5.4.2.1.3 European Food & Feed Cultures Association (Effca)
5.4.2.1.4 Regulatory and Safety Requirements for Food Cultures
5.4.2.2 High Price of Protective Cultures
5.4.3 Opportunities
5.4.3.1 Emerging Markets: New Growth Frontiers
5.4.3.2 Growth Prospects for Untapped Industrial Applications
5.4.4 Challenges
5.4.4.1 Lack of Consumer Awareness
6 Market for Protective Cultures, By Product Form (Page No. - 47)
6.1 Introduction
6.2 Freeze-Dried
6.2.1 Freeze-Dried Protective Cultures Gaining Momentum Due to Easy Storage and Handling
6.3 Frozen
6.3.1 Freezing Protective Cultures With Cryoprotectants is Commonly Used Preservation Method for Protective Cultures
7 Market for Protective Cultures, By Target Microorganism (Page No. - 52)
7.1 Introduction
7.2 Yeasts & Molds
7.2.1 Molds is the Primary Food Spoilage Agent in Dairy Products
7.3 Bacteria
7.3.1 Heterofermentative Lactic Acid Bacteria is A Major Food Spoilage Source in Meat Products
8 Protective Cultures Market, By Composition (Page No. - 57)
8.1 Introduction
8.2 Single-Strain
8.2.1 Lactic Acid Bacteria (Labs) are Mostly Used in Single-Strain Protective Cultures
8.3 Multi-Strain
8.3.1 for Commercial Applications, Lactobacillus Strains are Mostly Used Together in Multi-Strain Protective Cultures
8.4 Multi-Strain Mixed
8.4.1 Multi-Strain Mixed Cultures are the Most Commonly Used Protective Cultures
9 Market for Protective Cultures, By Application (Page No. - 62)
9.1 Introduction
9.2 Dairy & Dairy Products
9.2.1 Cheese
9.2.2 Fermented Milk Products
9.2.3 Butter and Spreads
9.3 Meat & Poultry Products
9.4 Seafood
9.5 Others
10 Market for Protective Cultures, By Region (Page No. - 72)
10.1 Introduction
10.2 North America
10.2.1 US
10.2.1.1 US Cheese Production to Boost the Demand for Protective Cultures
10.2.2 Canada
10.2.2.1 Growth in Demand for Natural Preservatives is Expected to Drive the Global Market
10.2.3 Mexico
10.2.3.1 Rise in Dairy & Dairy Product Production is Driving the Market for Protective Cultures in Mexico
10.3 Europe
10.3.1 Germany
10.3.1.1 Increasing Dairy Exports and Manufacturer’s Participation to Drive the Market in Germany
10.3.2 UK
10.3.2.1 Fermented Milk Products and Increasing Yogurt Consumption Driving the Use of Protective Cultures
10.3.3 France
10.3.3.1 Strong Demand for Clean Label Products in the Dairy and Meat Segments Drive the Growth of the French Protective Cultures Market
10.3.4 Italy
10.3.4.1 Increasing Exports of Italian Cheese Products to Improve the Prospects for Protective Cultures in the Country
10.3.5 Netherlands
10.3.5.1 International Trade to Play A Key Role in Influencing the Growth of the this Market in the Netherlands
10.3.6 Denmark
10.3.6.1 Manufacturer Presence and Increasing Demand for Protective Cultures to Contribute to Danish Exports
10.3.7 Rest of Europe
10.3.7.1 Changing Consumer Lifestyles and Increasing Demand for Clean Label to Positively Impact the Protective Cultures Market
10.4 Asia Pacific
10.4.1 China
10.4.1.1 Meat Industry Expected to Create Opportunities for Protective Cultures
10.4.2 India
10.4.2.1 Lack of Organized Cold Chain to Drive Freeze-Dried Protective Cultures Growth Prospects
10.4.3 Australia & New Zealand
10.4.3.1 Well Established Dairy and Meat Industry is Expected to Create Future Demand for Protective Cultures
10.4.4 Japan
10.4.4.1 Seafood Poses A Potential Opportunity to Be Explored By Protective Cultures’ Manufacturers
10.4.5 Rest of Asia Pacific
10.4.5.1 Increasing Consumption of Dairy and Seafood Products Expected to Drive the Demand for Protective Cultures
10.5 South America
10.5.1 Brazil
10.5.1.1 Increasing the Consumption of Dairy Products to Benefit the Protective Cultures Industry in Brazil
10.5.2 Argentina
10.5.2.1 Argentina’s Economic Recovery to Positively Impact the Use of Protective Cultures in the Nation’s Dairy Industry
10.5.3 Rest of South America
10.5.3.1 Meat & Seafood Products Pose Untapped Growth Opportunities for Protective Cultures in South America
10.6 Rest of the World
10.6.1 Middle East
10.6.1.1 Demand for Protein-Based Meat and Dairy Products Drives the Middle East Protective Cultures Market Growth
10.6.2 Africa
10.6.2.1 High Consumption of Cheese and High-Fat Foods to Drive the African Protective Cultures Market Growth
11 Competitive Landscape (Page No. - 112)
11.1 Overview
11.2 Market Ranking
11.3 Competitive Scenario
11.3.1 New Product Launches
11.3.2 Expansions
11.3.3 Agreements and Partnerships
12 Company Profiles (Page No. - 118)
(Business Overview, Products Offered, Recent Developments, SWOT Analysis, MnM View)*
12.1 Chr. Hansen
12.2 Dowdupont
12.3 DSM
12.4 Sacco S.R.L
12.5 CSK Food Enrichment B.V.
12.6 THT S.A
12.7 Meat Cracks Technologie GmbH
12.8 Dalton Biotechnologies S.R.L
12.9 Bioprox
12.10 Biochem S.R.L
12.11 Aristomenis D. Phikas & Co S.A
12.12 Soyuzsnab Group of Companies
*Details on Business Overview, Products Offered, Recent Developments, SWOT Analysis, MnM View Might Not Be Captured in Case of Unlisted Companies.
13 Appendix (Page No. - 139)
13.1 Discussion Guide
13.1 Knowledge Store: Marketsandmarkets’ Subscription Portal
13.2 Available Customizations
13.3 Related Reports
13.4 Author Details
List of Tables (72 Tables)
Table 1 US Dollar Exchange Rates Considered for the Study, 2015–2017
Table 2 Patents Pertaining to Protective Cultures
Table 3 Market Size for Protective Cultures, By Product Form, 2016–2023 (USD Million)
Table 4 Freeze-Dried: Protective Cultures Market Size, By Region, 2016–2023 (USD Million)
Table 5 Frozen: Market Size for Protective Cultures, By Region, 2016–2023 (USD Million)
Table 6 Market Size for Protective Cultures, By Target Microorganism, 2016–2023 (USD Million)
Table 7 Food Spoilage Yeasts Species
Table 8 Food Spoilage Molds Species
Table 9 Yeasts & Molds: Protective Cultures Market Size, By Region, 2016–2023 (USD Million)
Table 10 Bacteria: Protective Cultures Market Size, By Region, 2016–2023 (USD Million)
Table 11 Market Size for Protective Cultures, By Composition, 2016–2023 (USD Million)
Table 12 Single-Strain: Market Size for Protective Cultures, By Region, 2016–2023 (USD Million)
Table 13 Multi-Strain: Protective Cultures Market Size, By Region, 2016–2023 (USD Million)
Table 14 Multi-Strain Mixed: Market Size for Protective Cultures, By Region, 2016–2023 (USD Million)
Table 15 Market Size for Protective Cultures, By Application, 2016–2023 (USD Million)
Table 16 Dairy & Dairy Products: Protective Cultures Market Size, By Region, 2016–2023 (USD Million)
Table 17 Cheese: Market Size for Protective Cultures, By Region, 2016–2023 (USD Million)
Table 18 Fermented Milk Products: Protective Cultures Market Size, By Region, 2016–2023 (USD Million)
Table 19 Butter and Spreads: Market Size for Protective Cultures, By Region, 2016–2023 (USD Million)
Table 20 Meat & Poultry Products: Protective Cultures Market Size, By Region, 2016–2023 (USD Million)
Table 21 Seafood: Protective Cultures Market Size, By Region, 2016–2023 (USD Million)
Table 22 Others: Market Size for Protective Cultures, By Region, 2016–2023 (USD Million)
Table 23 Market Size for Protective Cultures, By Region, 2016–2023 (USD Million)
Table 24 North America: Protective Cultures Market Size, By Country, 2016–2023 (USD Million)
Table 25 North America: Market Size, By Application, 2016–2023 (USD Million)
Table 26 North America: Market Size, By Composition, 2016–2023 (USD Million)
Table 27 North America: Market Size, By Target Microorganism, 2016–2023 (USD Million)
Table 28 North America: Market Size, By Product Form, 2016–2023 (USD Million)
Table 29 US: Market Size for Protective Cultures, By Product Form, 2016–2023 (USD Million)
Table 30 Canada: Market Size for Protective Cultures, By Product Form, 2016–2023 (USD Million)
Table 31 Mexico: Percentage of Food Waste , By Food Product, 2014
Table 32 Mexico: Market Size for Protective Cultures, By Product Form, 2016–2023 (USD Million)
Table 33 Europe: Protective Cultures Market Size, By Country, 2016–2023 (USD Million)
Table 34 Europe: Market Size, By Application, 2016–2023 (USD Million)
Table 35 Europe: Market Size, By Composition, 2016–2023 (USD Million)
Table 36 Europe: Market Size, By Target Microorganism, 2016–2023 (USD Million)
Table 37 Europe: Market Size, By Product Form, 2016–2023 (USD Million)
Table 38 Germany: Protective Cultures Market Size, By Product Form, 2016–2023 (USD Million)
Table 39 UK: Market Size for Protective Cultures, By Product Form, 2016–2023 (USD Million)
Table 40 France: Protective Cultures Market Size, By Product Form, 2016–2023 (USD Million)
Table 41 Italy: Market Size for Protective Cultures, By Product Form, 2016–2023 (USD Million)
Table 42 Netherlands: Protective Cultures Market Size, By Product Form, 2016–2023 (USD Million)
Table 43 Denmark: Protective Cultures Market Size, By Product Form, 2016–2023 (USD Million)
Table 44 Rest of Europe: Market Size for Protective Cultures, By Product Form, 2016–2023 (USD Million)
Table 45 Asia Pacific: Market Size for Protective Cultures, By Country, 2016–2023 (USD Million)
Table 46 Asia Pacific: Market Size, By Application, 2016–2023 (USD Million)
Table 47 Asia Pacific: Market Size, By Composition, 2016–2023 (USD Million)
Table 48 Asia Pacific: Market Size, By Target Microorganism, 2016–2023 (USD Million)
Table 49 Asia Pacific: Market Size, By Product Form, 2016–2023 (USD Million)
Table 50 China: Market Size for Protective Cultures, By Product Form, 2016–2023 (USD Million)
Table 51 India: Market Size for Protective Cultures, By Product Form, 2016–2023 (USD Million)
Table 52 Australia & New Zealand: Protective Cultures Market Size, By Product Form, 2016–2023 (USD Million)
Table 53 Japan: Market Size for Protective Cultures, By Product Form, 2016–2023 (USD Million)
Table 54 Rest of Asia Pacific: Protective Cultures Market Size, By Product Form, 2016–2023 (USD Million)
Table 55 South America: Market Size for Protective Cultures, By Country, 2016–2023 (USD Million)
Table 56 South America: Market Size, By Application, 2016–2023
Table 57 South America: Market Size, By Composition, 2016–2023 (USD Million)
Table 58 South America: Market Size, By Target Microorganism, 2016–2023 (USD Million)
Table 59 South America: Market Size, By Product Form, 2016–2023 (USD Million)
Table 60 Brazil: Market Size for Protective Cultures, By Product Form, 2016–2023 (USD Million)
Table 61 Argentina: Protective Cultures Market Size, By Product Form, 2016–2023 (USD Million)
Table 62 Rest of South America: Market Size for Protective Cultures, By Product Form, 2016–2023 (USD Million)
Table 63 RoW:Market Size for Protective Cultures, By Country, 2016–2023 (USD Million)
Table 64 RoW: Market Size, By Application, 2016–2023 (USD Million)
Table 65 RoW: Market Size, By Composition, 2016–2023 (USD Million)
Table 66 RoW: Market Size, By Target Microorganism, 2016–2023 (USD Million)
Table 67 RoW: Market Size, By Product Form, 2016–2023 (USD Million)
Table 68 Middle East: Market Size for Protective Cultures, By Product Form, 2016–2023 (USD Million)
Table 69 Africa: Protective Cultures Market Size, By Product Form, 2016–2023 (USD Million)
Table 70 New Product Launches, 2013–2017
Table 71 Expansions, 2013–2018
Table 72 Agreements and Partnerships, 2013-2015
List of Figures (63 Figures)
Figure 1 Research Design
Figure 2 Market for Protective Cultures: Bottom-Up Approach
Figure 3 Protective Cultures Market: Top-Down Approach
Figure 4 Market Snapshot, By Target Microorganism, 2018 vs 2023
Figure 5 Market Size for Protective Cultures, By Application, 2018 vs 2023
Figure 6 Market Size, By Product Form, 2018 vs 2023
Figure 7 Protective Cultures Market Size, By Composition, 2018 vs 2023
Figure 8 Asia Pacific to Grow at the Highest CAGR in the Protective Cultures Market, 2018–2023
Figure 9 Market for Protective Cultures, By Region
Figure 10 Increasing Demand for Clean Label Products and Food Safety Regulations to Drive the Demand for Protective Cultures
Figure 11 Europe Was the Largest Market for Protective Cultures in 2017
Figure 12 Developing Countries to Exhibit High-Growth Potential During the Forecast Period
Figure 13 Freeze-Dried Segment to Witness Higher Customer Preference Compared to Frozen Cultures
Figure 14 Yeasts & Molds Segment to Dominate the Global Market
Figure 15 Germany Accounted for the Largest Share in 2017
Figure 16 Patent Insights
Figure 17 Market Dynamics
Figure 18 New Product Launches With Natural, Gmo-Free, No Additives/No Preservatives, and Organic Label Claims, 2013–2015
Figure 19 New Product Launches With Clean Label Claims, By Region, 2013 vs 2014
Figure 20 Confidence in Safety of US Food Supply, 2017
Figure 21 Comparison of Contamination Levels in Food Through the Use of Bioprotective Cultures
Figure 22 Breakdown of Food Waste Generation By Supply Chain Stage, 2015
Figure 23 Breakdown of Total Food Waste in the Us, By Food Category, 2017
Figure 24 Milk Production Summary for Major Exporters (Mt)
Figure 25 Market Size for Protective Cultures, By Product Form, 2018 vs 2023 (USD Million)
Figure 26 Freeze-Dried: Protective Cultures Market Size, By Region, 2018 vs 2023 (USD Million)
Figure 27 Protective Cultures Market Size, By Target Microorganism, 2018 vs 2023 (USD Million)
Figure 28 Yeasts & Molds: Protective Cultures Market Size, By Region, 2018 vs 2023 (USD Million)
Figure 29 Market Size for Protective Cultures, By Composition, 2018 vs 2023 (USD Million)
Figure 30 Multi-Strain Mixed: Protective Cultures Market Size, By Region, 2018 vs 2023 (USD Million)
Figure 31 Top Five Milk Producers in the EU in 2017
Figure 32 Global Dairy Product Output Growth, 2017 (%)
Figure 33 Global Cheese Production, 2017 (1000 Mt)
Figure 34 Eu-28 Production of Acidified Milk (Yoghurts and Others) (Tons)
Figure 35 Global Butter Production, 2017 (1000 Mt)
Figure 36 China to Record the Fastest Growth Rate During the Forecast Period in the Protective Cultures Market
Figure 37 North America: Market Snapshot
Figure 38 Cheese Production in the US Reached A Record High in 2017
Figure 39 US: Per Capita Consumption of Cheese, 2006–2016 (Pounds)
Figure 40 US: Per Capita Consumption of Butter, 2013–2016 (Pounds)
Figure 41 Mexico: Fluid Milk Production, 2015–2017 (Million Metric Tons)
Figure 42 Mexico: Cheese & Butter Production, 2015–2017
Figure 43 Europe: Market Snapshot, 2017
Figure 44 Global Per Capita Cheese Consumption, 2016 (LB/Person)
Figure 45 Asia Pacific Protective Cultures Market Snapshot, 2017
Figure 46 Australia: Cheese Consumption, 2011–2016 (Kg Per Capita)
Figure 47 New Zealand: Cheese Consumption, 2011 vs 2016 (Kg Per Capita)
Figure 48 Australia & New Zealand: Poultry Meat Consumption, 2013–2017 (Kg Per Capita)
Figure 49 Japanese Household Expenditure for Yogurt (Two Or More Person Household), 2013–2016 (Jpy)
Figure 50 Japanese Household Expenditure for Cheese, (Two Or More Person Household) 2013–2016 (Jpy)
Figure 51 Argentina Exports: Market Share Per Product, 2016
Figure 52 Key Developments of the Leading Players in the Protective Cultures Market For, 2013-2018
Figure 53 Top Five Companies in theGlobal Market, 2016
Figure 54 Ranking of Industry Players and Industry Concentration
Figure 55 Market Evaluation Framework
Figure 56 Chr. Hansen: Company Snapshot
Figure 57 Chr. Hansen: SWOT Analysis
Figure 58 Dowdupont: Company Snapshot
Figure 59 Dowdupont: SWOT Analysis
Figure 60 DSM: Company Snapshot
Figure 61 DSM: SWOT Analysis
Figure 62 Sacco S.R.L.: SWOT Analysis
Figure 63 CSK Food Enrichment B.V.: SWOT Analysis
The study involves four major activities to estimate the current market size of the protective cultures market. Exhaustive secondary research was done to collect information on the market, peer market, and parent market. These findings, assumptions, and market sizes were validated with industry experts across the value chain through primary research. Both the top-down and bottom-up approaches were employed to estimate the complete market size. Thereafter, the market breakdown and data triangulation approaches were used to estimate the market size of segments and subsegments.
Secondary Research
In the secondary research process, various secondary sources such as Hoovers, Bloomberg BusinessWeek, and Dun & Bradstreet were referred to, in order to identify and collect information for this study. These secondary sources included annual reports, press releases & investor presentations of companies, white papers, certified publications, articles by recognized authors, gold standard & silver standard websites, food safety organizations, regulatory bodies, trade directories, and databases.
Primary Research
The protective cultures market comprises several stakeholders such as manufacturers, importers and exporters, traders, distributors, and suppliers of protective cultures, food and beverage protective cultures, dairy protective cultures, bioprotective food cultures, EuropaBio, European Association for Bioindustries, government bodies and research organizations. It also includes manufacturers of pharmaceuticals and nutraceutical companies. The demand side of the market is characterized by the presence of importers/exporters, distributers, and manufacturers of dairy & dairy products, meat, poultry, and seafood products, and alcoholic beverages. The supply side is characterized by the presence of key providers of protective cultures. Various primary sources from the supply and demand sides of both markets have been interviewed to obtain qualitative and quantitative information:
To know about the assumptions considered for the study, download the pdf brochure
Market Size Estimation
Both the top-down and bottom-up approaches were used to estimate and validate the total size of the protective culture market. These methods were also used extensively to estimate the size of various subsegments in the market. The research methodology used to estimate the market size includes the following:
- The key players in the industry and markets were identified through extensive secondary research.
- The industry’s supply chain and market size, in terms of value, was determined through primary and secondary research processes.
- All percentage shares, splits, and breakdowns were determined using secondary sources and verified through primary respondents
Data Triangulation
After arriving at the overall market size—using the market size estimation processes as explained above—the market was split into several segments and subsegments. In order to complete the overall market engineering process and arrive at the exact statistics of each market segment and subsegment, the data triangulation and market breakdown procedures were employed. The data was triangulated by studying various factors and trends from both the demand and supply sides in the protective cultures market.
Report Objectives
- To define, segment, and project the global market size of the protective cultures.
- To understand the protective cultures market by identifying its various subsegments
- To provide detailed information about the key factors influencing the growth of the market (drivers, restraints, opportunities, and industry-specific challenges)
- To analyze the micromarkets with respect to individual growth trends, future prospects, and their contribution to the total market
- To project the size of the market and its submarkets, in terms of value, with respect to the regions (along with their respective key countries)
- To profile key players and comprehensively analyze their core competencies
- To understand the competitive landscape and identify major growth strategies adopted by players across key regions
- To analyze the competitive developments such as expansions & investments, mergers & acquisitions, new product launches, partnerships, joint ventures, and agreements
Scope of the report
|
Report Metric |
Details |
|
Market size available for years |
2016-2023 |
|
Base year considered |
2017 |
|
Forecast period |
2018-2023 |
|
Forecast units |
Value (USD) |
|
Segments covered |
Product Form, Target Microorganism, Composition, Application, and Region |
|
Geographies covered |
North America, Europe, Asia Pacific, South America and RoW |
|
Companies covered |
Chr Hansen (Denmark), DowDuPont (US), Sacco S.R.L (Italy), CSK Food Enrichment B.V. (Netherlands), THT S.A. (Belgium), Dalton Biotechnologies (Italy), Biochem S.R.L (Italy), Meat Cracks Technology GmbH (Germany), Royal DSM N.V. (Netherlands), Bioprox (France), Aristomenis D. Phikas & Co SA. (Greece), and Soyuzsnab Group of Companies (Russia). |
This research report categorizes the protective cultures market based on product form, target microorganism, composition, application, and region.
On the basis of product form, the protective cultures market has been segmented as follows:
- Freeze-dried
- Frozen
On the basis of target microorganism, the protective cultures market has been segmented as follows:
- Yeasts & molds
- Bacteria
On the basis of composition, the protective cultures market has been segmented as follows:
- Single strain
- Multi-strain
- Multi-strain mixed
On the basis of application, the protective cultures market has been segmented as follows:
- Dairy & dairy products
- Meat & poultry products
- Seafood
- Others (alcoholic beverages and fermented vegetable products)
On the basis of region, the protective cultures market has been segmented as follows:
- North America
- Europe
- Asia Pacific
- South America
- Rest of World (RoW)*
*Rest of the World (RoW) includes Middle East & Africa
Available Customizations
With the given market data, MarketsandMarkets offers customizations according to the company’s specific scientific needs.
The following customization options are available for the report:
Product Analysis
- Product matrix, which gives a detailed comparison of the product portfolio of each company
Geographic Analysis
- Further breakdown of the Rest of Europe protective cultures market into Belgium, Spain, Sweden, Greece, Austria, Switzerland, Bulgaria, Ireland, Romania, Poland, Finland, and Russia
- Further breakdown of the Rest of Asia Pacific protective cultures market into Indonesia, Philippines, Bangladesh, Singapore, Korea, Sri Lanka, Malaysia, Vietnam, Thailand, and Pakistan
- Further breakdown of the South America protective cultures market into Chile, Paraguay, Peru, Colombia, Ecuador, Bolivia, Uruguay, and Venezuela
- Further breakdown of the RoW protective cultures market into Middle East and Africa
Company Information
- · Detailed analyses and profiling of additional market players (up to five)


Growth opportunities and latent adjacency in Protective Cultures Market