Protein Labeling Market by Product (Reagents, Kits, & Services), Labeling Method (In Vitro Labeling, In Vivo Labeling), Application (Cell-Based Assay, Fluorescence Microscopy, Immunological Technique), & Region - Global Forecast to 2020


The protein labeling market is expected to reach USD 1,894.5 Million by 2020 from USD 1,089.5 Million in 2015, at a CAGR of 11.7%. Protein labeling is carried out using labeling reagents and kits to label an antibody or other protein, to make a fluorescent probe, enzyme conjugate, biotinylated binding reagent, or iodine-labeled tracer for detecting proteins in tissues, cells, and biochemical assays.
The major drivers for the protein labeling market include the increasing healthcare expenditure, rising R&D spending, and increasing proteomics research.
In this report, the protein labelling market is segmented on the basis of products, applications, labeling methods, and regions. On the basis of products, the protein labeling market includes reagents, kits, and services.
Based on application, the protein labelling market is segmented into cell-based assays, fluorescence microscopy, immunological techniques, mass spectrometry, and protein microarray; while, on the basis of labeling methods, the protein labeling market is categorized into in vitro labeling, in vivo labeling, and bioorthogonal labeling.
Geographically, the protein labeling market is segmented into North America, Europe, Asia, and the Rest of the World (RoW). North America is further segmented into the U.S. and Canada.
The major players in the global protein labeling market are Thermo Fisher Scientific, Inc. (U.S.), Merck KGaA (Germany), PerkinElmer, Inc. (U.S.), General Electric Company (U.S.), F. Hoffmann-La Roche AG (Switzerland), New England Biolabs (U.S.), Kaneka Corporation (Japan), Promega Corporation (U.S.), LI-COR, Inc. (U.S.), and SeraCare Life Sciences, Inc. (U.S.).
Protein Labeling Market : Scope of the Report
This report categorizes the global protein labeling market into the following segments:
Protein Labeling Market, by Product
- Reagents
- Enzymes
- Monoclonal Antibodies
- Probes/Tags
- Protein
- Other Reagents
- Kits
- Services
Protein Labeling Market, by Application
- Cell-based Assays
- Fluorescence Microscopy
- Immunological Techniques
- Mass Spectrometry
- Protein Microarray
Protein Labeling Market, by Labeling Method
- In Vitro Labeling Methods
- Cotranslational Labeling
- Dye-based
- Enzymatic Labeling
- Nanoparticle Labeling
- Site-specific Labeling
- In Vivo Labeling Methods
- Photoreactive Labeling
- Radioactive Labeling
- Bioorthogonal Labeling
Protein Labeling Market, by Region
- North America
- U.S.
- Canada
- Europe
- Asia
- Rest of the World
The protein labeling market is expected to reach USD 1,894.5 Million by 2020 from USD 1,089.5 Million in 2015, growing at a CAGR of 11.7% from 2015 to 2020. A strong trend of increasing healthcare expenditure will majorly drive the growth of the market. Other growth factors include increasing R&D spending and growth in proteomics research. The increasing use of protein labeling in in vitro labeling, in vivo labeling, and bioorthogonal labeling methods will provide opportunities for market growth.
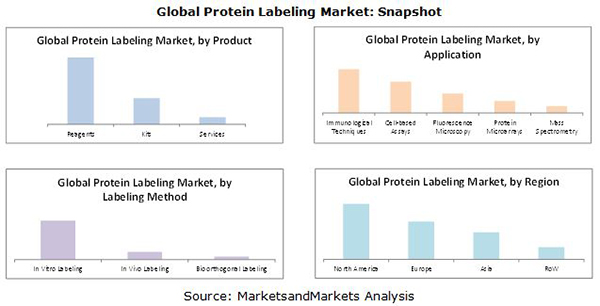
This report segments the protein labeling market by product, application, and labeling method. On the basis of products, the global market is segmented into reagents, kits, and services. In 2015, the reagents segment is expected to account for the largest share of the global protein labeling market.
The application segments of protein labeling market are cell-based assays, fluorescence microscopy, immunological techniques, mass spectrometry, and protein microarray. In 2015, the immunological techniques segment is expected to account for the largest share of the global protein labeling market.
On the basis of labeling methods, the protein labeling market is segmented into in vitro labeling, in vivo labeling, and bioorthogonal labeling. In 2015, the in vitro labeling methods segment is expected to account for the largest share of the global protein labeling market.
The geographic segments included in this report are North America, Europe, Asia, and the Rest of the World (RoW). North America is further subsegmented into the U.S. and Canada. In 2015, North America is expected to command the largest share of the global protein labeling market. However, Asia is expected to register the highest growth rate due to the increasing healthcare expenditure and rising R&D spending in this region.
Major players in the global protein labeling market are Thermo Fisher Scientific, Inc. (U.S.), Merck KGaA (Germany), PerkinElmer, Inc. (U.S.), General Electric Company (U.S.), F. Hoffmann-La Roche AG (Switzerland), New England Biolabs (U.S.), Kaneka Corporation (Japan), Promega Corporation (U.S.), LI-COR, Inc. (U.S.), and SeraCare Life Sciences, Inc. (U.S.).
 Exclusive indicates content/data unique to MarketsandMarkets and not available with any competitors.
Table of Contents
1 Introduction (Page No. - 15)
1.1 Objectives of the Study
1.2 Market Definition
1.3 Markets Covered
1.3.1 Years Considered in the Report
1.4 Currency
1.5 Limitations
1.6 Stakeholders
2 Research Methodology (Page No. - 18)
2.1 Market Size Estimation
2.2 Market Breakdown and Data Triangulation
2.2.1 Key Data From Secondary Sources
2.2.2 Key Data From Primary Sources
2.2.3 Assumptions for the Study
3 Executive Summary (Page No. - 25)
4 Premium Insights (Page No. - 28)
4.1 Lucrative Opportunities in the Global Market
5 Market Overview (Page No. - 30)
5.1 Introduction
5.2 Market Segmentation
5.2.1 By Product
5.2.2 By Application
5.2.3 By Labeling Method
5.3 Market Dynamics
5.3.1 Drivers
5.3.1.1 Growth in Healthcare Expenditure
5.3.1.2 Increasing Proteomics Research
5.3.1.3 Increase in R&D Spending
5.3.2 Restraints
5.3.2.1 High Degree of Market Consolidation
5.3.2.2 Lack of Skilled Professionals
5.3.3 Opportunities
5.3.3.1 Growing Opportunities in Emerging Markets
6 Protein Labeling Market, By Product (Page No. - 38)
6.1 Introduction
6.2 Reagents
6.2.1 Enzymes
6.2.2 Monoclonal Antibodies
6.2.3 Proteins
6.2.4 Probes/Tags
6.2.5 Other Reagents
6.3 Kits
6.4 Services
7 Protein Labeling Market, By Application (Page No. - 50)
7.1 Introduction
7.2 Immunological Techniques
7.3 Cell-Based Assays
7.4 Fluorescence Microscopy
7.5 Protein Microarrays
7.6 Mass Spectrometry
8 Protein Labeling Market, By Labeling Method (Page No. - 60)
8.1 Introduction
8.2 In Vitro Labeling
8.2.1 Enzymatic Labeling
8.2.2 Dye-Based Labeling
8.2.3 Cotranslational Labeling
8.2.4 Site-Specific Labeling
8.2.5 Nanoparticle Labeling
8.3 In Vivo Labeling
8.3.1 Photoreactive Labeling
8.3.2 Radioactive Labeling
8.4 Bioorthogonal Labeling
9 Protein Labeling Market, By Region (Page No. - 74)
9.1 Introduction
9.2 North America
9.2.1 U.S.
9.2.2 Canada
9.3 Europe
9.4 Asia
9.5 Rest of the World (RoW)
10 Competitive Landscape (Page No. - 106)
10.1 Introduction
10.2 Strategic Overview
10.3 Market Share Analysis
10.4 Competitive Situation and Trends
10.4.1 New Product & Service Launches and Product Upgrades
10.4.2 Expansions
10.4.3 Agreements and Collaborations
10.4.4 Acquisitions
11 Company Profiles (Page No. - 114)
11.1 Introduction
11.2 Thermo Fisher Scientific, Inc.
11.2.1 Business Overview
11.2.2 Products Offered
11.2.3 Recent Developments
11.2.4 MnM View
11.2.4.1 Financial Analysis
11.2.4.2 Strategic Analysis
11.3 Merck KGaA (Germany)
11.3.1 Business Overview
11.3.2 Products Offered
11.3.3 Recent Developments
11.3.4 MnM View
11.3.4.1 Financial Analysis
11.3.4.2 Strategic Analysis
11.4 Perkinelmer, Inc.
11.4.1 Business Overview
11.4.2 Products & Services Offered
11.4.3 Recent Developments
11.4.4 MnM View
11.4.4.1 Financial Analysis
11.4.4.2 Strategic Analysis
11.5 F. Hoffman-La Roche AG
11.5.1 Business Overview
11.5.2 Products Offered
11.5.3 Recent Development
11.5.4 MnM View
11.5.4.1 Financial Analysis
11.5.4.2 Strategic Analysis
11.6 General Electric Company
11.6.1 Business Overview
11.6.2 Products Offered
11.6.3 Recent Development
11.6.4 MnM View
11.6.4.1 Financial Analysis
11.6.4.2 Strategic Analysis
11.7 Kaneka Corporation
11.7.1 Business Overview
11.7.2 Products Offered
11.7.3 Recent Developments
11.7.4 MnM View
11.7.4.1 Financial Analysis
11.8 Li-Cor, Inc.
11.8.1 Business Overview
11.8.2 Products Offered
11.8.3 Recent Developments
11.8.4 MnM View
11.8.4.1 Strategic Analysis
11.9 New England Biolabs
11.9.1 Business Overview
11.9.2 Products Offered
11.9.3 Recent Developments
11.9.4 MnM View
11.9.4.1 Strategic Analysis
11.10 Promega Corporation
11.10.1 Business Overview
11.10.2 Products Offered
11.10.3 Recent Developments
11.10.4 MnM View
11.10.4.1 Strategic Analysis
11.11 Seracare Life Sciences, Inc.
11.11.1 Business Overview
11.11.2 Products Offered
11.11.3 Recent Developments
11.11.4 MnM View
11.11.4.1 Strategic Analysis
12 Appendix (Page No. - 138)
12.1 Insights of Industry Experts
12.2 Discussion Guide
12.3 Introducing RT: Real-Time Market Intelligence
12.4 Available Customizations
12.5 Related Reports
List of Tables (71 Tables)
Table 1 Market Summary
Table 2 Increase in Healthcare Expenditure is Propelling the Growth of the Market
Table 3 High Degree of Consolidation to Restrict Market Growth
Table 4 Emerging Markets Presents Significant Growth Opportunities for the Market
Table 5 Market Size, By Product, 2013�2020 (USD Million)
Table 6 Market Size for Reagents, By Type, 2013�2020 (USD Million)
Table 7 Market Size for Reagents, By Region, 2013�2020 (USD Million)
Table 8 Market Size for Enzymes, By Region, 2013�2020 (USD Million)
Table 9 Market Size for Monoclonal Antibodies, By Region, 2013�2020 (USD Million)
Table 10 Market Size for Proteins, By Region, 2013�2020 (USD Million)
Table 11 Market Size for Probes/Tags, By Region, 2013�2020 (USD Million)
Table 12 Market Size for Other Reagents, By Region, 2013�2020 (USD Million)
Table 13 Market Size for Kits, By Region, 2013�2020 (USD Million)
Table 14 Market Size for Services, By Region, 2013�2020 (USD Million)
Table 15 Market Size, By Application, 2013�2020 (USD Million)
Table 16 Market Size for Immunological Techniques, By Region, 2013�2020 (USD Million)
Table 17 Market Size for Cell-Based Assays, By Region, 2013�2020 (USD Million)
Table 18 Market Size for Fluorescence Microscopy, By Region, 2013�2020 (USD Million)
Table 19 Market Size for Protein Microarrays, By Region, 2013�2020 (USD Million)
Table 20 Market Size for Mass Spectrometry, By Region, 2013�2020 (USD Million)
Table 21 Market Size, By Labeling Method, 2013�2020 (USD Million)
Table 22 Protein Labeling for In Vitro Labeling Market Size, By Labeling Method, 2013�2020 (USD Million)
Table 23 Market Size for In Vitro Labeling, By Region, 2013�2020 (USD Million)
Table 24 Market Size for Enzymatic Labeling, By Region, 2013�2020 (USD Million)
Table 25 Market Size for Dye-Based Labeling, By Region, 2013�2020 (USD Million)
Table 26 Market Size for Cotranslational Labeling, By Region, 2013�2020 (USD Million)
Table 27 Market Size for Site-Specific Labeling, By Region, 2013�2020 (USD Million)
Table 28 Market Size for Nanoparticle Labeling, By Region, 2013�2020 (USD Million)
Table 29 Protein Labeling for In Vivo Labeling Market Size, By Labeling Method, 2013�2020 (USD Million)
Table 30 Market Size for In Vivo Labeling, By Region, 2013�2020 (USD Million)
Table 31 Market Size for Photoreactive Labeling, By Region, 2013�2020 (USD Million)
Table 32 Market Size for Radioactive Labeling, By Region, 2013�2020 (USD Million)
Table 33 Market Size for Bioorthogonal Labeling, By Region, 2013�2020 (USD Million)
Table 34 Global Protein Labeling Market Size, By Region, 2013�2020 (USD Million)
Table 35 North America: Market Size, By Country, 2013�2020 (USD Million)
Table 36 North America: Market Size, By Product, 2013�2020 (USD Million)
Table 37 North America: Market Size, By Application, 2013�2020 (USD Million)
Table 38 North America: Market Size, By Labeling Method, 2013�2020 (USD Million)
Table 39 North America: Market Size for In Vitro Labeling, By Labeling Method, 2013�2020 (USD Million)
Table 40 North America: Market Size for In Vivo Labeling, By Labeling Method, 2013�2020 (USD Million)
Table 41 U.S.: Market Size, By Product, 2013�2020 (USD Million)
Table 42 U.S.: Market Size, By Application, 2013�2020 (USD Million)
Table 43 U.S.: Market Size, By Labeling Method, 2013�2020 (USD Million)
Table 44 U.S.: Market Size for In Vitro Labeling, By Labeling Method, 2013�2020 (USD Million)
Table 45 U.S.: Market Size for In Vivo Labeling, By Labeling Method, 2013�2020 (USD Million)
Table 46 Canada: Market Size, By Product, 2013�2020 (USD Million)
Table 47 Canada: Market Size, By Application, 2013�2020 (USD Million)
Table 48 Canada: Market Size, By Labeling Method, 2013�2020 (USD Million)
Table 49 Canada: Market Size for In Vitro Labeling, By Labeling Method, 2013�2020 (USD Million)
Table 50 Canada: Protein Labeling Market Size for In Vivo Labeling, By Labeling Method, 2013�2020 (USD Million)
Table 51 Europe: Protein Labeling Market Size, By Product, 2013�2020 (USD Million)
Table 52 Europe: Protein Labeling Market Size, By Application, 2013�2020 (USD Million)
Table 53 Europe: Protein Labeling Market Size, By Labeling Method, 2013�2020 (USD Million)
Table 54 Europe: Protein Labeling Market Size for In Vitro Labeling, By Labeling Method, 2013�2020 (USD Million)
Table 55 Europe: Protein Labeling Market Size for In Vivo Labeling, By Labeling Method, 2013�2020 (USD Million)
Table 56 Asia: Protein Labeling Market Size, By Product, 2013�2020 (USD Million)
Table 57 Asia: Protein Labeling Market Size, By Application, 2013�2020 (USD Million)
Table 58 Asia: Protein Labeling Market Size, By Labeling Method, 2013�2020 (USD Million)
Table 59 Asia: Protein Labeling Market Size for In Vitro Labeling, By Labeling Method, 2013�2020 (USD Million)
Table 60 Asia: Protein Labeling Market Size for In Vivo Labeling, By Labeling Method, 2013�2020 (USD Million)
Table 61 RoW: Protein Labeling Market Size, By Product, 2013�2020 (USD Million)
Table 62 RoW: Protein Labeling Market Size, By Application, 2013�2020 (USD Million)
Table 63 RoW: Protein Labeling Market Size, By Labeling Method, 2013�2020 (USD Million)
Table 64 RoW: Protein Labeling Market Size for In Vitro Labeling, By Labeling Method, 2013�2020 (USD Million)
Table 65 RoW: Protein Labeling Market Size for In Vivo Labeling, By Labeling Method, 2013�2020 (USD Million)
Table 66 Protein Labeling Market Share Analysis, By Key Player, 2014
Table 67 Market Developments Between January 2013 and August 2015
Table 68 New Product & Service Launches and Product Upgrades, 2013�2015
Table 69 Expansions, 2013�2015
Table 70 Agreements and Collaborations , 2013�2015
Table 71 Acquisitions, 2013�2015
List of Figures (70 Figures)
Figure 1 Protein Labeling Market
Figure 2 Research Design
Figure 3 Market Size Estimation Methodology: Bottom-Up Approach
Figure 4 Market Size Estimation Methodology: Top-Down Approach
Figure 5 Breakdown of Primary Interviews: By Company Type, Designation, and Region
Figure 6 Data Triangulation Methodology
Figure 7 Protein Labeling Market Size, By Product, 2015 vs 2020 (USD Million)
Figure 8 Protein Labeling Market Size, By Application, 2015 vs 2020 (USD Million)
Figure 9 Protein Labeling Market Size, By Labeling Method, 2015 vs 2020 (USD Million)
Figure 10 Protein Labeling Market Size, By Region, 2015 vs 2020 (USD Million)
Figure 11 Global Protein Labeling Market to Witness High Growth During the Forecast Period
Figure 12 Reagents Product Segment to Account for the Largest Market Share in 2015
Figure 13 Asia to Grow at the Highest Rate From 2015 to 2020
Figure 14 Protein Labeling Market Segmentation, By Product
Figure 15 Protein Labeling Market Segmentation, By Application
Figure 16 Protein Labeling Market Segmentation, By Labeling Method
Figure 17 Protein Labeling Market: Drivers, Restraints, and Opportunities
Figure 18 Increase in the Global Healthcare Expenditure to Drive the Protein Labeling Market
Figure 19 Increasing R&D Spending is Boosting the Growth of the Protein Labeling Market
Figure 20 Protein Labeling Market Segmentation, By Product
Figure 21 Protein Labeling Market, By Product, 2015 (USD Million)
Figure 22 Enzymes to Command the Largest Share of the Reagents Segment By 2020
Figure 23 North America is Expected to Be the Largest Regional Segment for Reagents By 2020
Figure 24 North America is Expected to Be the Largest Regional Segment for Kits By 2020
Figure 25 North America is Expected to Be the Largest Regional Segment for Services By 2020
Figure 26 Protein Labeling Market, By Application
Figure 27 Protein Labeling Market Size, By Application, 2015 (USD Million)
Figure 28 Immunological Techniques Segment to Witness Highest Growth in Asia By 2020
Figure 29 The Cell-Based Assays Segment to Witness Highest Growth in Asia By 2020
Figure 30 Fluorescence Microscopy Segment to Witness Highest Growth in Asia By 2020
Figure 31 Protein Microarrays Segment to Witness Highest Growth in Asia By 2020
Figure 32 Mass Spectrometry Segment to Witness Highest Growth in Asia By 2020
Figure 33 Protein Labeling Market Segmentation, By Labeling Method
Figure 34 Protein Labeling Market, By Labeling Method, 2015 (USD Million)
Figure 35 Enzymatic Labeling to Command the Largest Share of the In Vitro Labeling Segment By 2020
Figure 36 North America to Command the Largest Share of the In Vitro Labeling Segment By 2020
Figure 37 Photoreactive Labeling to Command the Largest Share of the In Vivo Labeling Segment By 2020
Figure 38 North America to Command the Largest Share of the In Vivo Labeling Segment By 2020
Figure 39 North America to Command the Largest Share of the Bioorthogonal Labeling Segment By 2020
Figure 40 Asia to Grow at the Highest Rate During the Forecast Period
Figure 41 Geographic Snapshot (2015)
Figure 42 North America: Economic Indicators
Figure 43 North America: Market Snapshot
Figure 44 North American Geographic Snapshot (2015)
Figure 45 Reagents Expected to Hold the Largest Share of the North American Market, By Product, in 2020
Figure 46 Immunological Techniques, the Dominant Application Segment in 2015
Figure 47 In Vitro Labeling to Be the Largest Labeling Method Segment of the North American Protein Labeling Market in 2015
Figure 48 U.S.: Economic Indicators
Figure 49 Canada: Economic Indicators
Figure 50 Europe: Economic Indicators
Figure 51 Reagents Expected to Be the Largest Product Segment in Europe By 2020
Figure 52 Immunological Techniques to Be the Largest Application Segment in Europe in 2015
Figure 53 In Vitro Labeling to Be the Largest Labeling Method Segment of the European Protein Labeling Market in 2015
Figure 54 Asia: Economic Indicators
Figure 55 Asia: Market Snapshot
Figure 56 The Reagents Segment to Dominate the Asian Market in 2015
Figure 57 Immunological Techniques to Be the Largest Application Segment in Asia in 2015
Figure 58 In Vitro Labeling, the Largest Labeling Method Segment in 2015
Figure 59 RoW: Economic Indicators
Figure 60 The Reagents Product Segment is Expected to Command the Largest Market Share in 2015
Figure 61 Immunological Techniques to Be the Largest Application Segment in RoW in 2015
Figure 62 In Vitro Labeling to Be the Largest Labeling Method Segment of the RoW Protein Labeling Market in 2015
Figure 63 New Product Launches & Product Upgrades is the Key Growth Strategy Adopted By Players in the Protein Labeling Market, 2013-2015
Figure 64 Financial Performances of the Leading Market Players
Figure 65 Company Snapshot: Thermo Fisher Scientific, Inc.
Figure 66 Company Snapshot: Merck KGaA (Germany).
Figure 67 Company Snapshot: Perkinelmer, Inc.
Figure 68 Company Snapshot: F. Hoffman-La Roche AG
Figure 69 Company Snapshot: General Electric Company
Figure 70 Company Snapshot: Kaneka Corporation

 Generating Response ...


Growth opportunities and latent adjacency in Protein Labeling Market