Public Safety Analytics Market by Component (Solution and Service), Analytics Type (Predictive, Prescriptive, and Descriptive), Application, Deployment Mode (On-premises and hosted), Industry Vertical, and Region - Global Forecast to 2022


[146 Pages Report] The public safety analytics market size expected to grow from USD 4.59 Billion in 2016 to USD 11.29 Billion by 2022, at a Compound Annual Growth Rate (CAGR) of 16.7% during the forecast period. The base year considered for the study is 2016 and the forecast period is from 2017 to 2022.
Objectives of the Study
The main objective of the report is to define, describe, and forecast the public safety analytics market size based on component (solutions and services), analytics type, application, deployment mode, industry vertical, and region. The report provides detailed information on the major factors, such as drivers, restraints, opportunities, and challenges, influencing the market growth. The report attempts to forecast the market size with respect to the 5 main regions, namely, North America, Europe, Asia Pacific (APAC), Middle East and Africa (MEA), and Latin America. The report strategically profiles the key market players and comprehensively analyzes their core competencies. In addition, it tracks and analyzes the competitive developments, such as joint ventures, mergers and acquisitions, and new product developments, in the market.
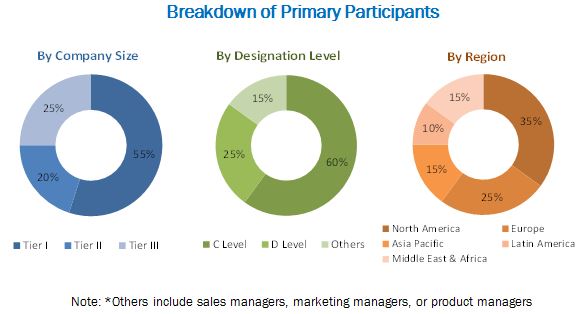
The research methodology used to estimate and forecast the public safety analytics market size initiated with the collection and analysis of data on the key vendor revenues through secondary sources, including the annual reports and press releases; investor presentations, conferences, and associations, such as International Multitopic Conference (INMIC), RSA Conference 2017, International Computer Security Association, and National Computer Security Association (NCSA); technology journals, certified publications, and articles from recognized authors, directories, and databases. In addition, vendor offerings were taken into consideration to determine the market segmentation. The bottom-up procedure was employed to arrive at the overall market size of the market from the revenue of the key players and their market shares. The factors that are considered to arrive at the overall market size include market expenditures across all the regions along with the geographical division in various industry verticals. Post-arrival at the overall market size, the total market was divided into several segments and subsegments, which were then verified through primary research by conducting extensive interviews with key people, such as Chief Executive Officers (CEOs), Vice Presidents (VPs), directors, and executives. The data triangulation and market breakdown procedures were employed to complete the overall market engineering process and arrive at the exact statistics for all the segments and subsegments. The breakdown of the profiles of the primary participants is depicted in the below figure:
To know about the assumptions considered for the study, download the pdf brochure
The public safety analytics market includes various vendors providing security assessment services to commercial clients across the globe. The companies, such as Hexagon (Sweden), IBM (US), Cisco (US), NEC (Japan), SAP (Germany), Esri (US), SAS (US), Nice Systems (Israel), Splunk (US), Verint Systems (US), Hitachi Vantara (US), and Haystax (US) have adopted partnerships, agreements, and collaborations as their key strategies to enhance their market reach.
Key Target Audience
- Government agencies
- Consulting firms
- Public safety solution vendors
- Systems integrators
- Independent software vendors
- Information Technology (IT) physical security agencies
- Value-added Resellers (VARs)
- Managed security service providers
- Investors and venture capitalists
The study answers several questions for the stakeholders; primarily, which market segments to focus on in the next 2 to 5 years for prioritizing efforts and investments.
Scope of the Public Safety Analytics Market Report
|
Report Metrics |
Details |
|
Market size available for years |
2016�2022 |
|
Base year considered |
2016 |
|
Forecast period |
2017�2022 |
|
Forecast units |
Billion (USD) |
|
Segments covered |
Component, Analytics Type, Application, Deployment Mode, Industry Vertical, and Region |
|
Geographies covered |
North America, Europe, APAC, MEA, and Latin America |
|
Companies covered |
Hexagon (Sweden), IBM (US), Cisco (US), NEC (Japan), SAP (Germany), Esri (US), SAS (US), Nice Systems (Israel), Splunk (US), Verint Systems (US), Hitachi Vantara (US), and Haystax (US) |
The research report segments the public safety analytics market into the following submarkets:
Public Safety Analytics Market By Component
- Solutions
- Services
- Solutions
- Video analytics
- Social media analytics
- Identity analytics
- Sensor data analytics
- Others (crowd analytics, speech analytics, and text analytics)
- Services
- System integration
- Support and maintenance
- Consulting services
- Managed services
- Solutions
Public Safety Analytics Market By Analytics Type:
- Predictive analytics
- Prescriptive analytics
- Descriptive analytics
Market By Application:
- Pattern Recognition
- Incident detection
- Person of Interest Screening
- Surveillance
Public Safety Analytics Market By Deployment
- On-premises
- Hosted
Market By Industry Vertical:
- Law Enforcement and Intelligence Agencies
- Border Control (Land, Sea, and Air)
- Public Transportation Security
- Critical Infrastructure Security
- Others (manufacturing and emergency services)
Public Safety Analytics Market By Region:
- North America
- Europe
- APAC
- MEA
- Latin America
Available Customizations
With the given market data, MarketsandMarkets offers customizations as per the company�s specific needs. The following customization options are available for the report:
Geographic Analysis
- Further breakdown of the North American Public Safety Analytics Market
- Further breakdown of the European Market
- Further breakdown of the APAC Market
- Further breakdown of the MEA Market
- Further breakdown of the Latin America Market
Company Information
- Detailed analysis and profiling of additional market players
MarketsandMarkets expects the global public safety analytics market size to grow from USD 5.22 Billion in 2017 to USD 11.29 Billion by 2022, at a Compound Annual Growth Rate (CAGR) of 16.7% during the forecast period. The rise in criminal activities and terrorist attacks has led to the introduction of data analytics in public safety solutions and services, with an objective to make them ultra-efficient. The hosted deployment mode segment has gained high traction in the market, as it requires less capital investment, helps decrease the operational and maintenance costs, and reduce the management�s efforts. This hosted public safety analytics services have been made available according to the customers� demand, wherein customers could start or stop any service according to their will. Public safety agencies have leveraged advanced analytics solutions to provide better services and protect the public and the nation from direct threats.
Public safety analytics offers solutions, which includes video analytics, social media analytics, sensor data analytics, identity analytics, and others (crowd analytics, speech analytics, and text analytics). These solutions have been designed to identify, prevent, respond, and prepare for an emergency event. The identity analytics solutions segment is expected to dominate the public safety analytics market and is estimated to contribute a largest market share in 2017. The social media analytics solutions segment is expected to play a key role in changing the market landscape and grow at the highest CAGR during the forecast period, the rise in the social media analytics platforms could be attributed to the rapid adoption of social media analytics solutions among organizations to prevent citizens from emergencies, such as fire, overcrowding, criminal activities, and natural calamities.
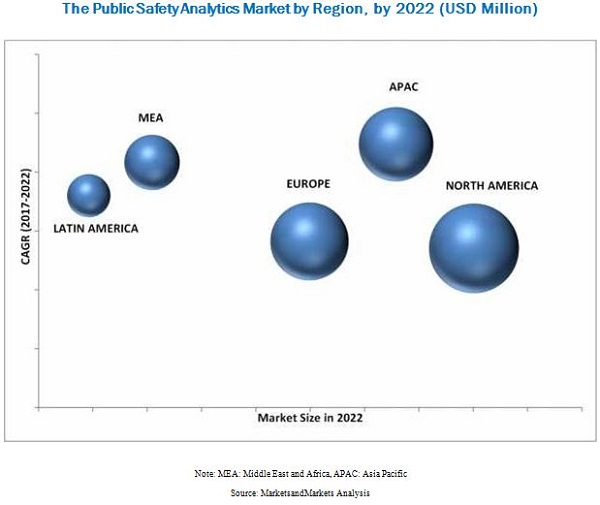
North America is estimated to account for the largest market size in 2017. This is majorly due to the concentrated presence of public safety security solution providers in the region that offer this solutions to various public safety agencies in the region. Furthermore, rapid economic growth in the developing countries along with improvement in the regulatory reforms and economic stability has driven the public safety analytics market growth in APAC. Furthermore, public transportation security, law enforcement and intelligence agencies, critical infrastructure securities, border controls, manufacturing and emergency services are expected to increase investments and adoption of public safety analytics platform, in Latin America.
However, the economic constraints and lack of awareness of public safety solutions and services across the industry verticals are the major restraints for the market growth. The Research and Development (R&D) expends more to develop advanced analytical solutions, this expenditure leads to high pricing of such public safety solution and services.
As the frequency of criminal activities and terrorist attacks has increased over the past 5 years, public safety organizations have increased their public safety investments to better protect the nation and the public.
Furthermore, with the rise in population, the cost of providing public safety and security systems, and the data analytics that comes with it has also increased. Some public safety agencies have confronted severe budget cuts and low funding, such as high installation costs for the citizens� safety systems may restrain the market growth of the public safety analytics market.
Technological proliferation and the resulting evolution of the physical threat landscape is expected to provide significant growth opportunities to the public safety analytics solution and service vendors. There are several established players in this market, such as Hexagon (Sweden), IBM (US), Cisco (US), NEC (Japan), SAP (Germany), Esri (US), SAS (US), Nice Systems (Israel), Splunk (US), Verint Systems (US), Hitachi Vantara (US), Haystax (US).
To speak to our analyst for a discussion on the above findings, click Speak to Analyst
 Exclusive indicates content/data unique to MarketsandMarkets and not available with any competitors.
Table of Contents
1 Introduction (Page No. - 14)
1.1 Objectives of the Study
1.2 Market Definition
1.3 Market Scope
1.4 Years Considered for the Study
1.5 Currency
1.6 Stakeholders
2 Research Methodology (Page No. - 17)
2.1 Research Data
2.1.1 Secondary Data
2.1.2 Primary Data
2.1.2.1 Breakdown of Primary Interviews
2.1.2.2 Key Industry Insights
2.2 Market Size Estimation
2.3 Research Assumptions and Limitations
2.3.1 Limitations
3 Executive Summary (Page No. - 24)
4 Premium Insights (Page No. - 28)
4.1 Attractive Market Opportunities in the Public Safety Analytics Market
4.2 Market By Region, 2017 vs 2022
4.3 Market By Component, 2017 vs 2022
4.4 Market By Solution, 2017 vs 2022
4.5 Market By Service, 2017 vs 2022
4.6 Market By Analytics Type, 2017 vs 2022
4.7 Market By Application, 2017 vs 2022
4.8 Market By Deployment Mode, 2017 vs 2022
4.9 Market By Industry Vertical, 2017 vs 2022
4.10 Life Cycle Analysis, By Region, 2017
5 Market Overview and Industry Trends (Page No. - 34)
5.1 Market Dynamics
5.1.1 Drivers
5.1.1.1 Increasing Direct Threats to National Security and Public Safety
5.1.1.2 Rising Investments in Smart City Initiatives
5.1.1.3 Growing Adoption of IoT and Connected Devices for Public Safety
5.1.2 Restraints
5.1.2.1 Budget Constraints in Adopting Public Safety Analytics Services
5.1.3 Opportunities
5.1.3.1 Proliferation of Hosted Public Safety Analytics Solutions and Services
5.1.3.2 Introduction of Ml/AI-Based Public Safety Solutions and Services
5.1.4 Challenges
5.1.4.1 Lack of Awareness of Public Safety Analytics Solutions and Services
5.2 Use Cases
5.2.1 Introduction
5.2.1.1 Use Case #1: Allgovision: Indian Railways
5.2.1.2 Use Case #2: Talkwalker: Beyondcsr
5.3 Innovation Spotlight
5.3.1 Phonexia
5.3.2 Iomniscient
5.3.3 Viisights
6 Public Safety Analytics Market, By Component (Page No. - 40)
6.1 Introduction
6.2 Solutions
6.2.1 Video Analytics
6.2.2 Social Media Analytics
6.2.3 Sensor Data Analytics
6.2.4 Identity Analytics
6.2.5 Others
6.3 Services
6.3.1 System Integration
6.3.2 Support and Maintenance
6.3.3 Consulting Services
6.3.4 Managed Services
7 Public Safety Analytics Market, By Analytics Type (Page No. - 53)
7.1 Introduction
7.2 Predictive Analytics
7.3 Prescriptive Analytics
7.4 Descriptive Analytics
8 Market By Application (Page No. - 58)
8.1 Introduction
8.2 Pattern Recognition
8.3 Incident Detection
8.4 Person of Interest Screening
8.5 Surveillance
9 Public Safety Analytics Market, By Deployment Mode (Page No. - 64)
9.1 Introduction
9.2 On-Premises
9.3 Hosted
10 Market By Industry Vertical (Page No. - 68)
10.1 Introduction
10.2 Law Enforcement and Intelligence Agencies
10.3 Border Control (Land, Sea, and Air)
10.4 Public Transportation Security
10.5 Critical Infrastructure Security
10.6 Others
11 Public Safety Analytics Market, By Region (Page No. - 75)
11.1 Introduction
11.2 North America
11.3 Europe
11.4 Asia Pacific
11.5 Middle East and Africa
11.6 Latin America
12 Competitive Landscape (Page No. - 97)
12.1 Overview
12.2 Key Players Operating in the Public Safety Analytics Market
12.3 Competitive Scenario
12.3.1 Partnerships/Agreements/Collaborations
12.3.2 New Product Launches
12.3.3 Mergers and Acquisitions
12.3.4 Business Expansions
13 Company Profiles (Page No. - 103)
(Overview, Products Offered, Recent Developments, SWOT Analysis, MnM View)*
13.1 Hexagon
13.2 IBM
13.3 Cisco
13.4 NEC
13.5 SAP
13.6 ESRI
13.7 SAS
13.8 Nice Systems
13.9 Splunk
13.10 Verint Systems
*Details on Overview, Products Offered, Recent Developments, SWOT Analysis, MnM View Might Not Be Captured in Case of Unlisted Companies.
13.11 Key Innovators
13.11.1 Hitachi Vantara
13.11.2 Haystax
14 Appendix (Page No. - 138)
14.1 Discussion Guide
14.2 Knowledge Store: Marketsandmarkets� Subscription Portal
14.3 Introducing RT: Real-Time Market Intelligence
14.4 Available Customizations
14.5 Related Reports
14.6 Author Details
List of Tables (73 Tables)
Table 1 Public Safety Analytics Market Size and Growth, 2015�2022 (USD Million, Y-O-Y %)
Table 2 Market Size By Component, 2015�2022 (USD Million)
Table 3 Solutions: Market Size By Region, 2015�2022 (USD Million)
Table 4 Solutions: Market Size By Type, 2015�2022 (USD Million)
Table 5 Video Analytics Market Size, By Region, 2015�2022 (USD Million)
Table 6 Social Media Analytics Market Size, By Region, 2015�2022 (USD Million)
Table 7 Sensor Data Analytics Market Size, By Region, 2015�2022 (USD Million)
Table 8 Identity Analytics Market Size, By Region, 2015�2022 (USD Million)
Table 9 Others Market Size, By Region, 2015�2022 (USD Million)
Table 10 Services: Market Size By Region, 2015�2022 (USD Million)
Table 11 Services: Market Size By Type, 2015�2022 (USD Million)
Table 12 System Integration Market Size, By Region, 2015�2022 (USD Million)
Table 13 Support and Maintenance Market Size, By Region, 2015�2022 (USD Million)
Table 14 Consulting Services Market Size, By Region, 2015�2022 (USD Million)
Table 15 Managed Services Market Size, By Region, 2015�2022 (USD Million)
Table 16 Public Safety Analytics Market Size, By Analytics Type, 2015�2022 (USD Million)
Table 17 Predictive Analytics Market Size, By Region, 2015�2022 (USD Million)
Table 18 Prescriptive Analytics Market Size, By Region, 2015�2022 (USD Million)
Table 19 Descriptive Analytics Market Size, By Region, 2015�2022 (USD Million)
Table 20 Market Size, By Application, 2015�2022 (USD Million)
Table 21 Pattern Recognition: Market Size By Region, 2015�2022 (USD Million)
Table 22 Incident Detection: Market Size By Region, 2015�2022 (USD Million)
Table 23 Person of Interest Screening: Market Size By Region, 2015�2022 (USD Million)
Table 24 Surveillance: Market Size By Region, 2015�2022 (USD Million)
Table 25 Market Size, By Deployment Mode, 2015�2022 (USD Million)
Table 26 On-Premises: Market Size By Region, 2015�2022 (USD Million)
Table 27 Hosted: Market Size By Region, 2015�2022 (USD Million)
Table 28 Market Size, By Industry Vertical, 2015�2022 (USD Million)
Table 29 Law Enforcement and Intelligence Agencies: Market Size By Region, 2015�2022 (USD Million)
Table 30 Border Control (Land, Sea, and Air): Market Size By Region, 2015�2022 (USD Million)
Table 31 Public Transportation Security: Market Size By Region, 2015�2022 (USD Million)
Table 32 Critical Infrastructure Security: Market Size By Region, 2015�2022 (USD Million)
Table 33 Others: Market Size By Region, 2015�2022 (USD Million)
Table 34 Public Safety Analytics Market Size, By Region, 2015�2022 (USD Million)
Table 35 North America: Market Size By Component, 2015�2022 (USD Million)
Table 36 North America: Market Size By Solution, 2015�2022 (USD Million)
Table 37 North America: Market Size By Service, 2015�2022 (USD Million)
Table 38 North America: Market Size By Analytics Type, 2015�2022 (USD Million)
Table 39 North America: Market Size By Application, 2015�2022 (USD Million)
Table 40 North America: Market Size By Deployment Mode, 2015�2022 (USD Million)
Table 41 North America: Market Size By Industry Vertical, 2015�2022 (USD Million)
Table 42 Europe: Public Safety Analytics Market Size, By Component, 2015�2022 (USD Million)
Table 43 Europe: Market Size By Solution, 2015�2022 (USD Million)
Table 44 Europe: Market Size By Service, 2015�2022 (USD Million)
Table 45 Europe: Market Size By Analytics Type, 2015�2022 (USD Million)
Table 46 Europe: Market Size By Application, 2015�2022 (USD Million)
Table 47 Europe: Market Size By Deployment Mode, 2015�2022 (USD Million)
Table 48 Europe: Market Size By Industry Vertical, 2015�2022 (USD Million)
Table 49 Asia Pacific: Public Safety Analytics Market Size, By Component, 2015�2022 (USD Million)
Table 50 Asia Pacific: Market Size By Analytics Type, 2015�2022 (USD Million)
Table 51 Asia Pacific: Market Size By Service, 2015�2022 (USD Million)
Table 52 Asia Pacific: Market Size By Analytics Type, 2015�2022 (USD Million)
Table 53 Asia Pacific: Market Size By Application, 2015�2022 (USD Million)
Table 54 Asia Pacific: Market Size By Deployment Mode, 2015�2022 (USD Million)
Table 55 Asia Pacific: Market Size By Industry Vertical, 2015�2022 (USD Million)
Table 56 Middle East and Africa: Public Safety Analytics Market Size, By Component, 2015�2022 (USD Million)
Table 57 Middle East and Africa: Market Size By Solution, 2015�2022 (USD Million)
Table 58 Middle East and Africa: Market Size By Service, 2015�2022 (USD Million)
Table 59 Middle East and Africa: Market Size By Analytics Type, 2015�2022 (USD Million)
Table 60 Europe: Market Size By Application, 2015�2022 (USD Million)
Table 61 Middle East and Africa: Market Size By Deployment Mode, 2015�2022 (USD Million)
Table 62 Middle East and Africa: Market Size By Industry Vertical, 2015�2022 (USD Million)
Table 63 Latin America: Public Safety Analytics Market Size, By Component, 2015�2022 (USD Million)
Table 64 Latin America: Market Size By Solution, 2015�2022 (USD Million)
Table 65 Latin America: Market Size By Service, 2015�2022 (USD Million)
Table 66 Latin America: Market Size By Analytics Type, 2015�2022 (USD Million)
Table 67 Latin America: Market Size By Application, 2015�2022 (USD Million)
Table 68 Latin America: Market Size By Deployment Mode, 2015�2022 (USD Million)
Table 69 Latin America: Market Size By Industry Vertical, 2015�2022 (USD Million)
Table 70 Partnerships/Agreements/Collaborations, 2017
Table 71 New Product Launches, 2017
Table 72 Mergers and Acquisitions, 2017
Table 73 Business Expansions, 2017
List of Figures (45 Figures)
Figure 1 Global Public Safety Analytics Market Segmentation
Figure 2 Global Market: Research Design
Figure 3 Data Triangulation
Figure 4 Market Size Estimation Methodology: Bottom-Up Approach
Figure 5 Market Size Estimation Methodology: Top-Down Approach
Figure 6 Public Safety Analytics Market: Assumptions
Figure 7 Law Enforcement and Intelligence Agencies Industry Vertical is Estimated to Hold the Largest Market Share in 2017
Figure 8 North America is Estimated to Hold the Largest Market Share in 2017
Figure 9 Rising Instances of Targeted-Attacks and Threats, and Increasing Investments in Smart Cities are Expected to Boost the Market
Figure 10 Asia Pacific is Expected to Grow at the Highest CAGR During the Forecast Period
Figure 11 Services Segment is Expected to Grow at A Higher CAGR During the Forecast Period
Figure 12 Social Media Analytics Solution is Expected to Grow at the Highest CAGR During the Forecast Period
Figure 13 Managed Services Segment is Expected to Grow at the Highest CAGR During the Forecast Period
Figure 14 Predictive Analytics Segment is Expected to Grow at the Highest CAGR During the Forecast Period
Figure 15 Person of Interest Screening Application is Expected to Grow at the Highest CAGR During the Forecast Period
Figure 16 Hosted Deployment Mode is Expected to Grow at A Higher CAGR During the Forecast Period
Figure 17 Public Transportation Security Industry Vertical is Expected to Grow at the Highest CAGR During the Forecast Period
Figure 18 Asia Pacific is Expected to Offer Immense Growth Opportunities for the Market
Figure 19 Public Safety Analytics Market: Drivers, Restraints, Opportunities, and Challenges
Figure 20 Public Safety Initiatives During 2016�2017
Figure 21 Services Segment is Expected to Grow at A Higher CAGR During the Forecast Period
Figure 22 Social Media Analytics Solution is Expected to Grow at the Highest CAGR During the Forecast Period
Figure 23 Consulting Services Segment is Expected to Grow at the Highest CAGR During the Forecast Period
Figure 24 Predictive Analytics Segment is Expected to Grow at the Highest CAGR During the Forecast Period
Figure 25 Person of Interest Screening Application is Expected to Grow at the Highest CAGR During the Forecast Period
Figure 26 Hosted Deployment Mode is Expected to Grow at A Higher CAGR During the Forecast Period
Figure 27 Public Transportation Security Industry Vertical is Expected to Grow at the Highest CAGR During the Forecast Period
Figure 28 Asia Pacific is Expected to Grow at the Highest CAGR During the Forecast Period
Figure 29 North America: Market Snapshot
Figure 30 Asia Pacific: Market Snapshot
Figure 31 Market Evaluation Framework
Figure 32 Hexagon: Company Snapshot
Figure 33 Hexagon: SWOT Analysis
Figure 34 IBM: Company Snapshot
Figure 35 IBM: SWOT Analysis
Figure 36 Cisco: Company Snapshot
Figure 37 Cisco: SWOT Analysis
Figure 38 NEC: Company Snapshot
Figure 39 NEC: SWOT Analysis
Figure 40 SAP: Company Snapshot
Figure 41 SAP: SWOT Analysis
Figure 42 SAS: Company Snapshot
Figure 43 Nice Systems: Company Snapshot
Figure 44 Splunk: Company Snapshot
Figure 45 Verint Systems: Company Snapshot


Growth opportunities and latent adjacency in Public Safety Analytics Market