Purified Terephthalic Acid (PTA) Market by Application (Polyester, Polybutylene Terephthalate, Plasticizers), and Region (Asia Pacific, North America, Europe, Middle East & Africa, South America) - Global Forecast to 2023


The purified terephthalic acid market is projected to reach USD 61.78 billion by 2023, at a CAGR of 5.1%. Purified Terephthalic Acid (PTA) is an organic compound produced commercially through the oxidation of paraxylene by the oxygen in the air. A majority of PTA is consumed in the development of polyester resins, such as polyester films, polyester fiber & yarn, and PET material bottles. PTA is also used as an intermediate in the manufacturing of liquid crystal polymers, plasticizers, polybutylene terephthalate, and others (that include cyclohexane dimethanol, terephthaloyl chloride, polytrimethylene terephthalate, and copolyester ether elastomers). Polyesters manufactured using PTA are used in various industries, such as textiles and packaging.
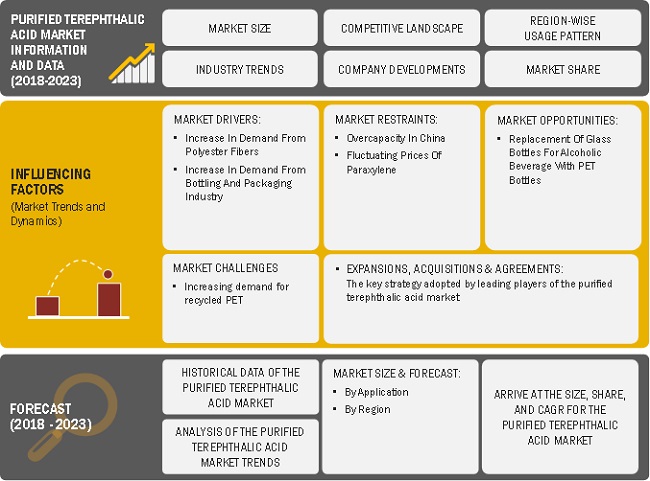
Market Dynamics
Drivers
- Rising demand for polyester fibers
- Increasing demand for PET from the bottling and packaging industry
Restraints
- Overcapacity of PTA in China
- Fluctuation in the prices of paraxylene
Opportunities
- Replacement of glass bottles for alcoholic beverages with PET bottles
Challenges
- Increasing demand for recycled PET
Increasing Use of purified terephthalic acid (PTA) in polyester fiber industry drives the global purified terephthalic acid market
PTA is primarily used to produce polyester fibers and yarn. It is also used to manufacture plasticizers, liquid crystal polymers, and polybutylene terephthalate. Polyester fibers are man-made fibers and are increasingly adopted by the textile industry, owing to their recyclability and versatility, as well as their affordability as compared to other fibers. Over the past few years, the polyester industry has been accounting for the largest share of the textile industry.
The consumption of PTA from the polyester industry in Asia Pacific countries, such as India and China, is higher as compared to other countries. By 2023, the demand for PTA is anticipated to increase globally, thereby contributing to the growth of the PTA market.
Objectives of this study are:
- To estimate and forecast the purified terephthalic acid market, in terms of value and volume.
- To provide a detailed segmentation of the purified terephthalic acid market on the basis of application, and region
- To analyze and forecast the segments of the purified terephthalic acid market and present an overall view of the market
- To identify emerging trends and opportunities in the purified terephthalic acid market
- To analyze the market with focus on high growth applications and fast growing segments
- To analyze factors that drive and restrain the growth of the purified terephthalic acid market
- To provide a comprehensive competitive landscape of the market and profile key market players with respect to their market shares/ranking
The years considered for the study are:
- Base Year � 2017
- Estimated Year � 2018
- Projected Year � 2023
- Forecast Period � 2018 to 2023
For company profiles in the report, 2017 has been considered as the base year. In cases wherein information is unavailable for the base year, the years prior to it have been considered.
Research Methodology
The research methodology used to estimate and forecast the global purified terephthalic acid market began with capturing data on key vendor revenues through secondary sources, such as Hoovers, Bloomberg, Chemical Weekly, Factiva, and various other government and private websites. Vendor offerings have also been taken into consideration to determine market segmentation. After arriving at the overall market size, the total market was split into several segments and subsegments, which were later verified through primary research by conducting extensive interviews with key personnel, such as CEOs, VPs, directors, and executives. Data triangulation and market breakdown procedures were employed to complete the overall market engineering process and arrive at the exact statistics for all the segments and subsegments of the market. The breakdown of profiles of primaries is depicted in the figure below.
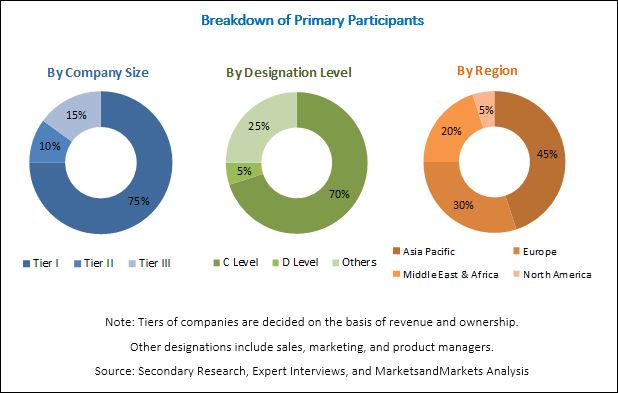
To know about the assumptions considered for the study, download the pdf brochure
The purified terephthalic acid market has a diversified ecosystem of upstream players, including raw material suppliers, along with downstream stakeholders, vendors, and government organizations. Companies operating in the PTA market include Reliance Industries Limited (India), Sinopec Corporation (China), British Petroleum (UK), Indorama Ventures Public Company (Thailand), SABIC (Saudi Arabia), and Jiaxing Petrochemical Co., Ltd. (China), among others.
Target Audience
- Manufacturers, Dealers, and Suppliers of PTA
- End Users of PTA
- Government and Research Organizations
- Companies Operational in Material R&D
- Associations and Industrial Bodies
- Investment Banks
- Consulting Companies/Consultants in Chemical and Material Sectors
�This study answers several questions for stakeholders, primarily the market segments, which they need to focus on during the next 2 to 5 years so that they may prioritize their efforts and investments accordingly.�
Purified Terephthalic Acid Market Report Scope
This research report categorizes the PTA market based on application, and region, and forecasts revenues as well as analyzes trends in each of the submarkets.
On the Basis of Application
- Polyester
- By Grade
- Fiber & Yarn Grade
- Polybutylene terephthalate (PET) Grade
- Film Grade
- By End User
- Textile
- PET Bottles
- Packaging
- By Grade
- Polybutylene Terephthalate (PBT)
- Plasticizers
- Others
On the Basis of Region:
- Asia Pacific
- North America
- Europe
- Middle East & Africa
- South America
The following customization options are available for the report:
Along with the given market data, MarketsandMarkets offers customizations as per the company�s specific needs. The following customization options are available for the report:Product Analysis
- Product matrix, which provides a detailed comparison of the product portfolio of each company
Geographic Analysis
- Further breakdown of the Rest of Asia Pacific, Rest of the Middle East & Africa, Rest of Europe, and Rest of South America PTA markets
Company Information
- Detailed analysis and profiles of additional market players (up to five companies)
This research study involved extensive use of secondary sources, directories, and databases such as D&B Hoovers, Bloomberg, Chemical Weekly, Factiva, and other government and private websites to identify and collect information useful for this technical, market-oriented, and commercial study of the purified terephthalic acid (PTA) market.
As a part of the primary research process, various experts from both the supply and demand sides have been interviewed to obtain qualitative and quantitative information. Primary sources from the supply side include industry experts such as CEOs, vice presidents, marketing directors, technology & innovation directors, and related key executives from various major companies and organizations operating in the purified terephthalic acid (PTA) market. Primary sources from the demand side include experts and key personnel from end-use industries.
As part of the market engineering process, both the top-down and bottom-up approaches have been extensively used along with the data triangulation method to estimate and forecast the overall market segments listed in this report. Extensive qualitative and quantitative data have been analyzed on the complete market engineering process to provide key information and insights throughout the report.
Key Questions
- Will concerns over excess capacity of purified terephthalic acid in China ease out in near future?
- Will purified terephthalic acid producers in Asia look for alternate markets like Middle East and South America?
- Most of the suppliers have opted acquisition & expansion as the key strategies as could be seen from the recent developments. Where will it take the industry in the mid to long term?
- What will be the impact of increasing trends in PET recycling on purified terephthalic acid (PTA) demand?
The purified terephthalic acid market is projected to grow from an estimated USD 48.14 billion in 2018 to USD 61.78 billion by 2023, at a CAGR of 5.1% from 2018 to 2023. Purified terephthalic acid is extensively used to manufacture polyester resins such as polyester fibre & yarn, PET, and polyester film.
The purified terephthalic acid unit market, by application is segmented into polyester, plasticizers, polybutylene terephthalate, among others. The polyester segment has been further divided into grade and end user. The grade polyester subsegment has been further divided into fiber & yarn grade, polyethylene terephthalate (PET) grade, and film grade. Based on application, the polyester segment, accounts for a major share of the PTA market, due to the increase in demand for polyester fiber & yarn in the textile yarn industry.
Based on end user, the polyester segment of purified terephthalic acid market is segmented into textile, PET bottles, and packaging. The increasing demand for polyester fiber & yarn from the textile industry in countries such as India, China, Malaysia, etc., is driving the growth of the purified terephthalic acid market. The increase in demand for polyester resins to manufacture polyester fiber & yarn is fueling the growth of the PTA market. PTA is majorly used to manufacture polyester yarn and fiber.
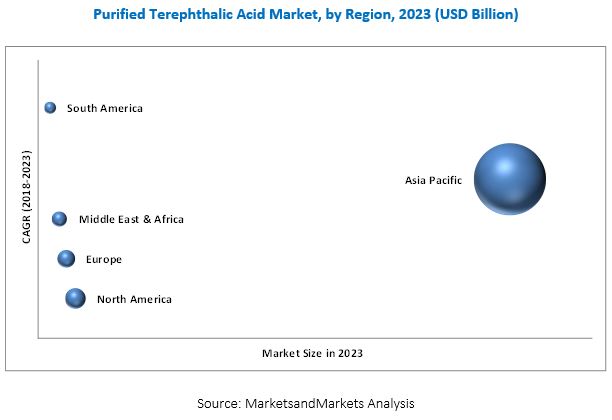
South America is expected to be the fastest-growing market for purified terephthalic acid during the forecast period. This growth can be attributed to the increased demand for PTA from the PET grade resin producers in South America.
Asia Pacific is the largest market for PTA. The growing demand for PET material bottles, coupled with the increase in the demand for PTA from bottling and packaging industries is driving the Asia Pacific PTA market. Rapid industrialization in the region is also fueling the growth of the PTA market. PTA is used to manufacture various chemical intermediates, such as liquid crystal polymers, cyclohexane dimethanol, polytrimethylene terephthalate, etc.
Purified terephthalic acid (PTA) applications in the polyester to drive the growth of Purified terephthalic acid market
Polyester
Polyester is classified into 3 grades, namely, fiber & yarn grade, Polyethylene Terephthalate (PET) grade, and film grade. It is used to produce PET resins, polyester fibers, and packaging films. PET resins are used as packaging materials for food & beverage products, such as chips, pickles, jams, fruit juices, and soft drinks.
PET is replacing traditional packaging materials, such as glass, paper, metal, and aluminum, owing to its properties that include high strength, lightweight, improved clarity, long-term durability, and improved design plasticity. The unique properties of PET and its eco-friendly nature have contributed to PET resins becoming the preferred choice of packaging material.
Polybutylene Terephthalate (PBT)
Polybutylene Terephthalate (PBT) is the second-largest application segment of the PTA market. PBT, as an engineering plastic, features thermal, dimensional, and molding stability. It has high heat resistance and superior electrical properties, which enhance its applicability in the automotive and electronics industries. In the automotive industry, the use of PBT enables weight reduction and fuel efficiency. PBT replaces nylon in electronic components, as it meets the requirement of tighter part tolerance.
Criitical questions the report answers:
- Where will all these developments take the industry in the mid to long term?
- What are the upcoming industry applications for purified terephthalic acid?
However, concerns over the overcapacity of PTA in China can cause the decline to the global operating rate of PTA. This can adversely affect the growth of the PTA market. The demand for PTA is the highest in the polyester segment, which includes PET, owing to the growing soft drinks industry.
There are large-scale developed players in the market such as Reliance Industries Limited (India), British Petroleum (UK), Sinopec Corporation (China), Indorama Ventures Public Company (Thailand), SABIC (Saudi Arabia), among others. These companies have undertaken various organic and inorganic business strategies such as agreements, acquisitions and expansions in the past few years as far as purified terephthalic acid market is concerned.
To speak to our analyst for a discussion on the above findings, click Speak to Analyst
 Exclusive indicates content/data unique to MarketsandMarkets and not available with any competitors.
Table of Contents
1 Introduction (Page No. - 16)
1.1 Objectives of the Study
1.2 Market Definition
1.3 Scope of the Study
1.3.1 Regional Scope
1.3.2 Years Considered for the Study
1.4 Currency
1.5 Limitations
1.6 Stakeholders
2 Research Methodology (Page No. - 19)
2.1 Research Data
2.1.1 Secondary Data
2.1.1.1 Key Data From Secondary Sources
2.1.2 Primary Data
2.1.2.1 Key Data From Primary Sources
2.1.2.2 Key Industry Insights
2.1.2.3 Breakdown of Primary Interviews
2.2 Market Size Estimation
2.2.1 Bottom-Up Approach
2.2.2 Top-Down Approach
2.3 Data Triangulation
2.4 Assumptions
3 Executive Summary (Page No. - 27)
4 Premium Insights (Page No. - 31)
4.1 Significant Growth Opportunities in the PTA Market
4.2 PTA Market, By Region
4.3 Asia Pacific PTA Market, By Country and Polyester Grade
4.4 PTA Market, By Application and Region
4.5 Top 6 Countries in the PTA Market
5 Market Overview (Page No. - 34)
5.1 Introduction
5.2 Market Dynamics
5.2.1 Drivers
5.2.1.1 Rising Demand for Polyester Fibers
5.2.1.2 Increasing Demand for Pet From the Bottling and Packaging Industry
5.2.2 Restraints
5.2.2.1 Overcapacity of PTA in China
5.2.2.2 Fluctuation in the Prices of Paraxylene
5.2.3 Opportunities
5.2.3.1 Replacement of Glass Bottles for Alcoholic Beverages With Pet Bottles
5.2.4 Challenges
5.2.4.1 Increasing Demand for Recycled Pet
5.3 Porter�s Five Forces Analysis
5.3.1 Threat of New Entrants
5.3.2 Bargaining Power of Suppliers
5.3.3 Threat of Substitutes
5.3.4 Bargaining Power of Buyers
5.3.5 Intensity of Competitive Rivalry
5.4 Macroeconomic Indicators
5.4.1.1 Textile Yarn Market
5.4.1.2 Pet Packaging Market
5.5 Manufacturing Process of Purified Terephthalic Acid
5.5.1 Introduction
5.5.2 Amoco Process
5.5.3 BP PTA Technology
5.5.4 IPT Technology
5.5.5 Mitsubishi Chemical Technology Process
5.5.6 Eastman Chemical PTA Technology Process
5.5.7 Henkel PTA Technology Process
5.6 Price Analysis
5.6.1 Short-Term Price Trend
5.6.2 Long-Term Price Trend
6 PTA Market, By Application (Page No. - 45)
6.1 Introduction
6.2 Polyester
6.2.1 Polyester Application, By Grade
6.2.2 Polyester Application, By End User
6.3 Polybutylene Terephthalate (PBT)
6.4 Plasticizers
6.5 Others
7 PTA Market, By Region (Page No. - 51)
7.1 Introduction
7.2 Asia Pacific
7.2.1 China
7.2.2 India
7.2.3 Japan
7.2.4 South Korea
7.2.5 Taiwan
7.2.6 Thailand
7.2.7 Indonesia
7.2.8 Rest of Asia Pacific
7.3 North America
7.3.1 US
7.3.2 Canada
7.3.3 Mexico
7.4 Europe
7.4.1 Germany
7.4.2 Italy
7.4.3 France
7.4.4 UK
7.4.5 Russia
7.4.6 The Netherlands
7.4.7 Poland
7.4.8 Rest of Europe
7.5 Middle East & Africa
7.5.1 Saudi Arabia
7.5.2 Iran
7.5.3 Turkey
7.5.4 Rest of Middle East & Africa
7.6 South America
7.6.1 Brazil
7.6.2 Argentina
7.6.3 Rest of South America
8 Competitive Landscape (Page No. - 97)
8.1 Overview
8.2 Market Share Analysis
8.3 Competitive Situations & Trends
8.3.1 Expansions
8.3.2 Agreements
8.3.3 Acquisitions
9 Company Profiles (Page No. - 103)
(Business Overview, Products Offered, Recent Developments, SWOT Analysis, and MnM View)*
9.1 British Petroleum
9.2 Reliance Industries Limited
9.3 Sinopec Corporation
9.4 Indorama Ventures Public Company
9.5 SABIC
9.6 Alpek
9.7 Eastman Chemical Company
9.8 Indian Oil Corporation
9.9 Lotte Chemical Corporation
9.10 Mitsubishi Chemical Corporation
9.11 Petkim Petrokimya Holding A.�.
9.12 JBF Petrochemicals
9.13 MCPI
9.14 Jiaxing Petrochemical Co., Ltd. (JPCL)
9.15 Other Leading Players
9.15.1 China Prosperity (Jiangyin) Petrochemical Co. Ltd.,
9.15.2 Hanwha General Chemical Co., Ltd.
9.15.3 Hengli Petrochemical Co., Ltd.
9.15.4 Ompet
9.15.5 Oriental Petrochemical (Taiwan)
9.15.6 Oriental Petrochemical (Shanghai) Corporation
9.15.7 Shahid Tondgooyan Petrochemical Company (STPC)
9.15.8 PKN Orlen S.A.
9.15.9 PT Energi Mega Persada (EMP)
9.15.10 Taekwang Industrial Co., Ltd.
9.15.11 Zhejiang Hengyi Group Co., Ltd.
*Details on Business Overview, Products Offered, Recent Developments, SWOT Analysis, and MnM View Might Not Be Captured in Case of Unlisted Companies.
10 Appendix (Page No. - 131)
10.1 Discussion Guide
10.2 Knowledge Store: Marketsandmarkets� Subscription Portal
10.3 Introducing RT: Real-Time Market Intelligence
10.4 Available Customizations
10.5 Related Reports
10.6 Author Details
List of Tables (90 Tables)
Table 1 Textile Yarn Market, By Region, 2014�2021 (USD Million)
Table 2 Purified Terephthalic Acid (PTA) Market, By Application, 2016�2023 (USD Billion)
Table 3 Purified Terephthalic Acid Market, By Application, 2016�2023 (Kilotons)
Table 4 PTA Market in Polyester Application, By Region, 2016�2023 (USD Million)
Table 5 Purified Terephthalic Acid (PTA) Market in Polyester Application, By Region, 2016�2023 (Kilotons)
Table 6 Purified Terephthalic Acid Market in Polybutylene Terephthalate Application, By Region, 2016�2023 (USD Million)
Table 7 PTA Market in Polybutylene Terephthalate Application, By Region, 2016�2023 (Kilotons)
Table 8 Purified Terephthalic Acid (PTA) Market in Plasticizers Application, By Region, 2016�2023 (USD Million)
Table 9 Purified Terephthalic Acid Market in Plasticizers Application, By Region, 2016�2023 (Kilotons)
Table 10 PTA Market in Other Applications, By Region, 2018�2023 (USD Million)
Table 11 Purified Terephthalic Acid (PTA) Market in Other Applications, By Region, 2018�2023 (Kilotons)
Table 12 Purified Terephthalic Acid Market, By Region, 2016�2023 (USD Billion)
Table 13 PTA Market, By Region, 2016�2023 (Kilotons)
Table 14 Purified Terephthalic Acid (PTA) Market, By Application, 2016�2023 (USD Billion)
Table 15 Purified Terephthalic Acid Market, By Application, 2016�2023 (Million Tons)
Table 16 Asia Pacific PTA Market, By Country, 2016�2023 (USD Million)
Table 17 Asia Pacific Purified Terephthalic Acid (PTA) Market, By Country, 2016�2023 (Kilotons)
Table 18 Asia Pacific: Purified Terephthalic Acid Market By Application, 2016�2023 (USD Million)
Table 19 Asia Pacific: Market By Application, 2016�2023 (Kilotons)
Table 20 China Market, By Application, 2016�2023 (USD Million)
Table 21 China Market By Application, 2016�2023 (Kilotons)
Table 22 India Market, By Application, 2016�2023 (USD Million)
Table 23 India Market, By Application, 2016�2023 (Kilotons)
Table 24 Japan Market By Application, 2016�2023 (USD Million)
Table 25 Japan Market By Application, 2016�2023 (Kilotons)
Table 26 South Korea Market By Application, 2016�2023 (USD Million)
Table 27 South Korea Market By Application, 2016�2023 (Kilotons)
Table 28 Taiwan Market, By Application, 2016�2023 (USD Million)
Table 29 Taiwan Market By Application, 2016�2023 (Kilotons)
Table 30 Thailand Market, By Application, 2016�2023 (USD Million)
Table 31 Thailand Market By Application, 2016�2023 (Kilotons)
Table 32 Indonesia Market, By Application, 2016�2023 (USD Million)
Table 33 Indonesia Market By Application, 2016�2023 (Kilotons)
Table 34 Rest of Asia Pacific Market, By Application, 2016�2023 (USD Million)
Table 35 Rest of Asia Pacific Market By Application, 2016�2023 (Kilotons)
Table 36 North America Purified Terephthalic Acid (PTA) Market By Country, 2016�2023 (USD Million)
Table 37 North America Purified Terephthalic Acid Market By Country, 2016�2023 (Kilotons)
Table 38 North America PTA Market By Application, 2016�2023 (USD Million)
Table 39 North America Market By Application, 2016�2023 (Kilotons)
Table 40 US Market By Application, 2016�2023 (USD Million)
Table 41 US Market By Application, 2016�2023 (Kilotons)
Table 42 Canada Market By Application, 2016�2023 (USD Million)
Table 43 Canada Market By Application, 2016�2023 (Kilotons)
Table 44 Mexico Market By Application, 2016�2023 (USD Million)
Table 45 Mexico Market By Application, 2016�2023 (Kilotons)
Table 46 Europe PTA Market By Country, 2016�2023 (USD Million)
Table 47 Europe Purified Terephthalic Acid (PTA) Market By Country, 2016�2023 (Kilotons)
Table 48 Europe Purified Terephthalic Acid Market By Application, 2016�2023 (USD Million)
Table 49 Europe Market By Application, 2016�2023 (Kilotons)
Table 50 Germany Market By Application, 2016�2023 (USD Million)
Table 51 Germany Market By Application, 2016�2023 (Kilotons)
Table 52 Italy Market By Application, 2016�2023 (USD Million)
Table 53 Italy Market By Application, 2016�2023 (Kilotons)
Table 54 France Market By Application, 2016�2023 (USD Million)
Table 55 France Market By Application, 2016�2023 (Kilotons)
Table 56 UK Market By Application, 2016�2023 (USD Million)
Table 57 UK Market By Application, 2016�2023 (Kilotons)
Table 58 Russia Market By Application, 2016�2023 (USD Million)
Table 59 Russia Market By Application, 2016�2023 (Kilotons)
Table 60 Netherlands Market By Application, 2016�2023 (USD Million)
Table 61 Netherlands Market By Application, 2016�2023 (Kilotons)
Table 62 Poland Market, By Application, 2016�2023 (USD Million)
Table 63 Poland Market, By Application, 2016�2023 (Kilotons)
Table 64 Rest of Europe Market By Application, 2016�2023 (USD Million)
Table 65 Rest of Europe Market By Application, 2016�2023 (Kilotons)
Table 66 Middle East & Africa Purified Terephthalic Acid (PTA) Market By Country, 2016�2023 (USD Million)
Table 67 Middle East & Africa Purified Terephthalic Acid Market By Country, 2016�2023 (Kilotons)
Table 68 Middle East & Africa PTA Market By Application, 2016�2023 (USD Million)
Table 69 Middle East & Africa: Market By Application,2016�2023 (Kilotons)
Table 70 Saudi Arabia Market By Application, 2016�2023 (USD Million)
Table 71 Saudi Arabia Market By Application, 2016�2023 (Kilotons)
Table 72 Iran Market By Application, 2016�2023 (USD Million)
Table 73 Iran Market By Application, 2016�2023 (Kilotons)
Table 74 Turkey Market By Application, 2016�2023 (USD Million)
Table 75 Turkey Market By Application, 2016�2023 (Kilotons)
Table 76 Rest of Middle East & Africa Market By Application, 2016�2023 (USD Million)
Table 77 Rest of Middle East & Africa Market By Application, 2016�2023 (Kilotons)
Table 78 South America PTA Market By Country, 2016�2023 (USD Million)
Table 79 South America Purified Terephthalic Acid Market By Country, 2016�2023 (Kilotons)
Table 80 South America Purified Terephthalic Acid (PTA) Market By Application, 2016�2023 (USD Million)
Table 81 South America Market By Application, 2016�2023 (Kilotons)
Table 82 Brazil Market By Application, 2016�2023 (USD Million)
Table 83 Brazil Purified Terephthalic Acid (PTA) Market By Application, 2016�2023 (Kilotons)
Table 84 Argentina Market By Application, 2016�2023 (USD Million)
Table 85 Argentina Purified Terephthalic Acid Market By Application, 2016�2023 (Kilotons)
Table 86 Rest of South America Market By Application, 2016�2023 (USD Million)
Table 87 Rest of South America Market By Application, 2016�2023 (Kilotons)
Table 88 Expansions, January 2013�January 2018
Table 89 Agreements, January 2013�January 2018
Table 90 Acquisitions, January 2013�January 2018
List of Figures (40 Figures)
Figure 1 PTA Market Segmentation
Figure 2 Purified Terephthalic Acid Market: Research Design
Figure 3 Purified Terephthalic Acid (PTA) Market: Data Triangulation
Figure 4 Polyester Application Segment is Expected to Lead the PTA Market Between 2018 and 2023
Figure 5 Polyethylene Terephthalate (Pet) Grade Subsegment of the Polyester Application Segment is Expected to Grow at the Highest CAGR Between 2018 and 2023
Figure 6 Asia Pacific is Expected to Lead the PTA Market During the Forecast Period
Figure 7 Increase in Demand for PTA From the Polyester Industry is Projected to Drive the Growth of the Purified Terephthalic Acid Market During the Forecast Period
Figure 8 The Purified Terephthalic Acid (PTA) Market in South America is Projected to Grow at the Highest CAGR From 2018 to 2023
Figure 9 The Fiber & Yarn Segment is Expected to Lead the Asia Pacific PTA Market in 2018
Figure 10 The Polyester Application Segment is Estimated to Account for the Largest Share Across All Regions in Purified Terephthalic Acid Market, in 2018
Figure 11 China is Projected to Lead the Purified Terephthalic Acid (PTA) Market Between 2018 and 2023
Figure 12 Purified Terephthalic Acid Market: Drivers, Restraints, Opportunities, and Challenges
Figure 13 Global Fiber Consumption (2015)
Figure 14 Global Pet Production (2014 vs 2020)
Figure 15 PTA Market: Porter�s Five Forces Analysis
Figure 16 Amoco Process
Figure 17 History of BP PTA-Technology
Figure 18 Block Diagram of Mitsubishi PTA Technology Process
Figure 19 Monthly Average Price Variation for PTA in China in 2018
Figure 20 Region-Wise Average PTA Price Trend, 2016�2023
Figure 21 The Polyester Application Segment is Projected to Lead the PTA Market During the Forecast Period
Figure 22 Regional Snapshot
Figure 23 Asia Pacific Purified Terephthalic Acid Market Snapshot
Figure 24 North America Purified Terephthalic Acid (PTA) Market Snapshot
Figure 25 Europe Purified Terephthalic Acid Market Snapshot
Figure 26 Middle East & Africa PTA Market Snapshot
Figure 27 South America PTA Market Snapshot
Figure 28 Companies Adopted Organic Growth Strategies Between January 2013 and January 2018
Figure 29 Market Share Analysis of Top Players in the PTA Market, in 2017
Figure 30 British Petroleum: Company Snapshot
Figure 31 Reliance Industries Limited: Company Snapshot
Figure 32 Sinopec: Company Snapshot
Figure 33 Indorama Ventures Public Company: Company Snapshot
Figure 34 SABIC: Company Snapshot
Figure 35 Alpek: Company Snapshot
Figure 36 Eastman Chemical Company: Company Snapshot
Figure 37 Indian Oil Corporation: Company Snapshot
Figure 38 Lotte Chemical: Company Snapshot
Figure 39 Mitsubishi Chemical Corporation: Company Snapshot
Figure 40 Petkim Petrokimya Holding A.S.: Company Snapshot


Growth opportunities and latent adjacency in Purified Terephthalic Acid (PTA) Market
Do you know of any company that is producing recycled PTA?