Q-TOF Mass Spectrometry Market by Application (Biotech Applications, Pharmaceutical Applications, Food & Beverage Testing, Environmental Testing, Petrochemical Applications), and Region (North America, Europe, APAC, and Row) & Geography


The global Q-TOF mass spectrometry market is expected to grow at a CAGR of 7.7%. The rising applications of Q-TOF mass spectrometers in pharmaceuticals and biotechnological industries, coupled with the increasing R&D activities in these sectors, would result in high adoption of this technology. In addition, favorable government initiatives and increased focus on producing high-quality products are the major factors that contribute to the market growth. This is particularly evident in the high-growth emerging nations in Asia Pacific and Latin America. Base year considered for the report is 2016, and the forecast period is during 2017–2022.
Objectives of the Study:
- To define, describe, and forecast the global Q-TOF mass spectrometry market segmented on the basis of application and region
- To provide detailed information regarding the major factors (such as drivers, restraints, growth opportunities and challenges) influencing the growth of the Q-TOF mass spectrometry market
- To analyze the opportunities in the market for stakeholders and provide details of the competitive landscape for market leaders
- To strategically analyze the market structure and profile the key players in the market and comprehensively analyze their core competencies
- To forecast the size of the Q-TOF mass spectrometry market segments with respect to 4 major regions, namely, North America, Europe, Asia Pacific, and Rest of the World (RoW)
- To analyze competitive developments such as product launches, expansions, acquisitions, and partnerships & collaborations
Research Methodology
Top-down and bottom-up approaches hav been used to validate the size of the global market and estimate the size of other dependent submarkets. Various secondary sources that include associations such as the American Society for Mass Spectrometry (ASMS), the Canadian Society for Mass Spectrometry (CSMS), the International Mass Spectrometry Society (IMSS), the British Mass Spectrometry Society (BMSS), directories, industry journals, databases, and annual reports of the companies have been used to identify and collect information useful for the study of this market. Primary sources such as experts from both supply and demand sides have been interviewed to obtain and validate information as well as to assess dynamics of Q-TOF mass spectrometry industry. The breakdown of profiles of primaries is shown in the figure below:

To know about the assumptions considered for the study, download the pdf brochure
Waters Corporation (US), Agilent Technologies (US), and SCIEX [(a part of Danaher Corporation (US)] are the key players in the Q-TOF mass spectrometry market. The other players involved in this market include Bruker Corporation (US) and Shimadzu Corporation (Japan).
Target Audience:
- Mass spectrometry and related device manufacturing companies
- Suppliers and distributors of mass spectrometry systems
- Research institutes and academic centers
- Pharmaceutical and biopharmaceutical companies
- Biotechnology companies
- Environment protection agencies and institutes
- Food, beverage, and agricultural analyses companies
- Cosmetic companies
Q-TOF Mass Spectrometry Market Scope
The research report categorizes the mass spectrometry market into the following segments and subsegments:
By Application
- Biotechnology Applications
- Pharmaceutical Applications
- Food & Beverage Testing
- Environmental Testing
- Petrochemical Applications
- Other Applications
By Region
-
North America
- US
- Canada
-
Europe
- UK
- Germany
- Spain
- Italy
- France
- Rest of Europe (RoE)
-
Asia Pacific
- Japan
- China
- India
- Rest of Asia Pacific
- Rest of the World (RoW)
Available Customizations:
With the given market data, MarketsandMarkets offers customizations according to the company’s specific needs. The following customization option is available for the report:
Company Information
- Detailed analysis and profiling of additional market players (Up to 5)
The growth of this market is majorly driven by the technological advancements pertaining to Q-TOF mass spectrometry technology, government initiatives for pollution control and environmental testing, high expenditure on R&D activities of mass spectrometry supplements in pharmaceutical and biotechnological applications, stringent government regulations regarding drug safety, and increased focus on producing high-quality food. However, the high costs of Q-TOF instruments is restraining the growth of the market.
The availability of government funding for various research projects in a number of countries such as the US and Canada will open new opportunities for market players. In the US, the National Institute of Health (NIH) has provided a grant of USD 694 million for Environmental Health Sciences (NIEHS) and USD 344 million for Biomedical Imaging/Bioengineering (NIBIB). In March 2016, the Minister of State for Science and Technology announced an investment of USD 23 million for supporting 95 research projects at 26 universities across Canada.
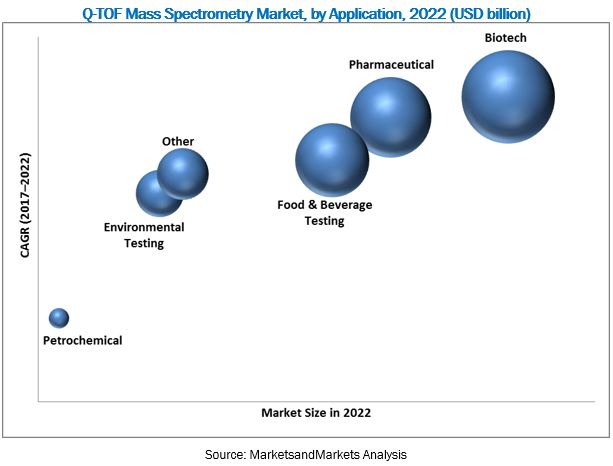
The report analyzes the market by application and region. On the basis of application, the Q-TOF mass spectrometry market has been segmented into biotech applications, pharmaceutical applications, food and beverage testing, environmental testing, petrochemical applications, and other applications. In 2017, biotech applications are expected to account for the largest share of the market and this segment is also projected to register the highest CAGR during the forecast period.
Geographically, North America is estimated to account for the largest share of the global Q-TOF mass spectrometry market, followed by Europe. The growing government funding and increasing biotech and biopharma R&D in the US are the major factors driving the growth of the North American market. The increasing funding for R&D in Canada is expected to propel the market growth during the forecast period. However, the high costs of Q-TOF mass spectrometry instruments is restraining the growth of this market at present.
As of 2017, the global market was dominated by Waters Corporation (US), Agilent Technologies (US), and SCIEX (Subsidiary of Danaher) (US). These companies accounted for a majority share of the global Q-TOF mass spectrometry market in 2017. Other players involved in this market include Bruker (US), and Shimadzu Corporation (Japan).
To speak to our analyst for a discussion on the above findings, click Speak to Analyst
 Exclusive indicates content/data unique to MarketsandMarkets and not available with any competitors.
Table of Contents
1 Q-TOF Mass Spectrometry Market: Introduction (Page No. - 13)
1.1 Objectives of Study
1.2 Market Definition
1.3 Market Scope
1.3.1 Markets Covered
1.3.2 Years Considered for the Study
1.4 Currency
1.5 Limitations
1.6 Stakeholders
2 Q-TOF Mass Spectrometry Market: Research Methodology (Page No. - 16)
2.1 Research Methodology Steps
2.2 Secondary and Primary Research Methodology
2.2.1 Secondary Research
2.2.1.1 Key Data From Secondary Sources
2.2.2 Primary Research
2.2.2.1 Primary Sources
2.2.2.2 Key Insights From Primary Sources
2.3 Market Size Estimation Methodology
2.4 Market Forecast Methodology
2.5 Market Data Validation and Triangulation
2.6 Assumptions for the Study
3 Q-TOF Mass Spectrometry Market: Executive Summary (Page No. - 25)
4 Q-TOF Mass Spectrometry Market: Premium Insights (Page No. - 27)
4.1 Q-TOF Mass Spectrometry: Market Overview
4.2 Asia Pacific Market, By Application, 2017
4.3 Market, By Application, 2017 vs 2022 (USD Million)
4.4 Geographic Snapshot of the Q-TOF Mass Spectrometry Market
5 Q-TOF Mass Spectrometry Market: Overview (Page No. - 31)
5.1 Introduction
5.2 Market Dynamics
5.2.1 Drivers
5.2.1.1 Technological Advancements in Q-TOF Mass Spectrometry
5.2.1.2 Government Initiatives for Pollution Control and Environmental Testing
5.2.1.3 Increasing Spending on Pharmaceutical and Biotechnological R&D
5.2.1.4 Government Regulations on Drug Safety
5.2.1.5 Growing Focus on Ensuring Food Quality
5.2.2 Restraint
5.2.2.1 High Cost of Q-TOF Mass Spectrometers
5.2.3 Opportunity
5.2.3.1 Opportunities in Emerging Markets
5.2.4 Challenge
5.2.4.1 Dearth of Skilled Professionals
6 Q-TOF Mass Spectrometry Market, By Application (Page No. - 37)
6.1 Introduction
6.2 Biotechnology Applications
6.3 Pharmaceutical Applications
6.4 Food & Beverage Testing
6.5 Environmental Testing
6.6 Petrochemical Applications
6.7 Other Applications
7 Q-TOF Mass Spectrometry Market, By Region (Page No. - 50)
7.1 Introduction
7.2 North America
7.2.1 US
7.2.2 Canada
7.3 Europe
7.3.1 Germany
7.3.2 UK
7.3.3 France
7.3.4 Spain
7.3.5 Italy
7.3.6 Rest of Europe (RoE)
7.4 Asia Pacific
7.4.1 China
7.4.2 Japan
7.4.3 India
7.4.4 Rest of Asia Pacific
7.5 Rest of the World (RoW)
8 Q-TOF Mass Spectrometry Market: Competitive Landscape (Page No. - 78)
8.1 Overview
8.2 Ranking of Players, 2017
8.3 Competitive Scenario
8.3.1 Expansions
8.3.2 Product Launches
8.3.3 Collaborations and Agreements
8.3.4 Acquisitions
9 Company Profiles (Page No. - 82)
(Introduction, Products & Services, Strategy, & Analyst Insights, Developments, MnM View)*
9.1 Waters Corporation
9.2 Agilent Technologies
9.3 Sciex (A Subsidiary of Danaher)
9.4 Bruker
9.5 Shimadzu Corporation
*Details on Marketsandmarkets View, Introduction, Product & Services, Strategy, & Analyst Insights, New Developments Might Not Be Captured in Case of Unlisted Companies.
10 Appendix (Page No. - 95)
10.1 Discussion Guide of the Global Q-TOF Mass Spectroscopy Market
10.2 Knowledge Store: Marketsandmarkets’ Subscription Portal
10.3 Introducing RT: Real-Time Market Intelligence
10.4 Available Customizations
10.5 Related Reports
10.6 Author Details
List of Tables (46 Tables)
Table 1 Indicative List of Recent Product Launches
Table 2 Government Initiatives
Table 3 Funding for Environmental Testing and Pollution Control Programs
Table 4 Q-TOF Mass Spectrometry Market, By Application, 2015–2022 (USD Million)
Table 5 Market for Biotechnology Applications, By Region, 2015–2022 (USD Million)
Table 6 Market for Biotechnology Applications, By Country, 2015–2022 (USD Million)
Table 7 Market for Pharmaceutical Applications, By Region, 2015–2022 (USD Million)
Table 8 Q-TOF Mass Spectrometry Market for Pharmaceutical Applications, By Country, 2015–2022 (USD Million)
Table 9 Market for Food & Beverage Testing, By Region, 2015–2022 (USD Million)
Table 10 Market for Food & Beverage Testing, By Country, 2015–2022 (USD Million)
Table 11 Market for Environmental Testing, By Region, 2015–2022 (USD Million)
Table 12 Q-TOF Mass Spectrometry Market for Environmental Testing, By Country, 2015–2022 (USD Million)
Table 13 Market for Petrochemical Applications, By Region, 2015–2022 (USD Million)
Table 14 Market for Petrochemical Applications, By Country, 2015–2022 (USD Million)
Table 15 Market for Other Applications, By Region, 2015–2022 (USD Million)
Table 16 Q-TOF Mass Spectrometry Market for Other Applications, By Country, 2015–2022 (USD Million)
Table 17 QMarket, By Region, 2015–2022 (USD Million)
Table 18 North America: Market, By Country, 2015–2022 (USD Million)
Table 19 North America: Q-TOF Mass Spectrometry Market, By Country, 2015–2022 (Units)
Table 20 North America: Market, By Application, 2015–2022 (USD Million)
Table 21 Funding Initiatives Towards Research Activities in Life Sciences
Table 22 US: Market, By Application, 2015–2022 (USD Million)
Table 23 Private and Government Grants Towards Research & Development in Canada
Table 24 Canada: Market, By Application, 2015–2022 (USD Million)
Table 25 Europe: Q-TOF Mass Spectrometry Market, By Country, 2015–2022 (USD Million)
Table 26 Europe: Market, By Country, 2015–2022 (Units)
Table 27 Europe: Market, By Application, 2015–2022 (USD Million)
Table 28 Germany: Market, By Application, 2015–2022 (USD Million)
Table 29 UK: Q-TOF Mass Spectrometry Market, By Application, 2015–2022 (USD Million)
Table 30 France: Market, By Application, 2015–2022 (USD Million)
Table 31 Spain: Market, By Application, 2015–2022 (USD Million)
Table 32 Italy: Market, By Application, 2015–2022 (USD Million)
Table 33 RoE: Q-TOF Mass Spectrometry Market, By Application, 2015–2022 (USD Million)
Table 34 Asia Pacific: Market, By Country, 2015–2022 (USD Million)
Table 35 Asia Pacific: Market, By Country, 2015–2022 (Units)
Table 36 Asia Pacific: Market, By Application, 2015–2022 (USD Million)
Table 37 China: Market, By Application, 2015–2022 (USD Million)
Table 38 Japan: Q-TOF Mass Spectrometry Market, By Application, 2015–2022 (USD Million)
Table 39 Study Results Regarding R&D Expenditure of 25 Pharmaceutical Companies
Table 40 India: Market, By Application, 2015–2022 (USD Million)
Table 41 RoAPAC: Market, By Application, 2015–2022 (USD Million)
Table 42 RoW: Q-TOF Mass Spectrometry Market, By Application, 2015–2022 (USD Million)
Table 43 Expansions
Table 44 Product Launches
Table 45 Partnerships, Agreements, and Collaborations
Table 46 Acquisitions
List of Figures (26 Figures)
Figure 1 Q-TOF Mass Spectrometry Market: Research Methodology Steps
Figure 2 Breakdown of Primary Interviews: By Company Type, Designation, and Region
Figure 3 Market Size Estimation Methodology: Bottom-Up Approach
Figure 4 Market Size Estimation Methodology: Top-Down Approach
Figure 5 Research Design
Figure 6 Data Triangulation Methodology
Figure 7 Biotech Applications Segment to Register the Highest CAGR During the Forecast Period
Figure 8 Geographical Snapshot of the Q-TOF Mass Spectrometry Market
Figure 9 Rising Adoption of Q-TOF Mass Spectrometry in Pharmaceutical and Environmental Analysis Will Drive Market Growth
Figure 10 China Accounted for the Largest Share of the APAC Market in 2017
Figure 11 Biotechnology Applications Segment is Expected to Account for the Largest Market Share in 2022
Figure 12 North America to Register the Highest Growth Rate in the Forecast Period
Figure 13 Mass Spectrometry Market: Drivers, Restraints, Opportunities, and Challenges
Figure 14 Biotechnology Applications to Register the Highest Growth Rate in the Market During the Forecast Period
Figure 15 North America Dominated the Largest Share of the Market in 2017
Figure 16 North America: Q-TOF Mass Spectrometry Market Snapshot
Figure 17 Europe: Market Snapshot
Figure 18 Asia Pacific: Q-TOF Mass Spectrometry Market Snapshot
Figure 19 RoW: Market Snapshot
Figure 20 Waters Corporation Led the Market in 2017
Figure 21 Key Developments of the Prominent Players in the Market (2015–2018)
Figure 22 Waters Corporation: Company Snapshot (2017)
Figure 23 Agilent Technologies: Company Snapshot (2017)
Figure 24 Danaher Corporation: Company Snapshot (2017)
Figure 25 Bruker: Company Snapshot (2017)
Figure 26 Shimadzu Corporation: Company Snapshot (2017)

 Generating Response ...


Growth opportunities and latent adjacency in Q-TOF Mass Spectrometry Market