Rare Earth Metals Leaching Chemicals Market

Rare Earth Metals Leaching Chemicals Market by Type (Hydrochloric Acid, Sulfuric Acid, Nitric Acid, Ammonium Sulfate, Citric Acid), and Region (North America, Europe, Asia Pacific, Middle East and Africa, South America) - Global Forecast to 2027

Report Code: MM 8821 Oct, 2023, by marketsandmarkets.com

The rare earth metals leaching chemicals market is estimated to be USD 417 million in 2021 and is projected to reach USD 749 million by 2027, at a CAGR of 7.7% between 2022 and 2027. The major driving factors for the growth of the rare earth metals leaching chemicals market are the rising demand for electric vehicles, discovery of new rare earth deposits, and increasing incentives by governments for renewable energy systems.

Attractive Opportunities in the Rare Earth Metals Leaching Chemicals Market

Rare Earth Metals Leaching Chemicals Market

To know about the assumptions considered for the study, Request for Free Sample Report

Rare Earth Metals Leaching Chemicals Market

Rare earth metals leaching chemicals market Dynamics

Driver: Rising demand for electric vehicles

Rare earth metals play a crucial role in electric vehicles (EVs), finding applications in components like motors, batteries, and electronic systems. According to the International Energy Agency (IEA), approximately 0.5 kg of rare earth elements are used in the production of a single electric vehicle. Notably, elements like neodymium and dysprosium enhance the performance of electric motor magnets, improving power-to-weight ratios, while cerium and lanthanum serve as catalysts in batteries to enhance their efficiency and lifespan. Rare earth metals are also instrumental in enhancing the performance and reliability of various electronic systems in EVs, including sensors and control systems. This applies to both electric vehicles and hybrid electric vehicles (HEVs).

The rare earth metals market is further propelled by changing regulations and government policies supporting electric vehicle adoption. During the COVID-19 pandemic, European EV sales surged by 137%, driven by incentives offered under green recovery funds. In terms of sales, Europe has surpassed China and is poised for significant growth. In 2021, global EV sales, including battery electric vehicles (BEVs) and plug-in hybrid electric vehicles (PHEVs), reached 18.6 million units, marking a remarkable 166.6% year-on-year increase compared to 2020. The increasing global demand for electric vehicles is a key driver for the rare earth metals market, consequently increasing the demand for rare earth metals leaching chemicals.

Restraint: Environmental impacts of leaching chemicals for rare earth metals

Environmental concerns surrounding leaching chemicals used in rare earth metal production have prompted the imposition of regulations in various regions. These chemicals generate substantial toxic waste, contributing to global water pollution and ecological imbalances when disposed of improperly. The combination of rare earth metals with these chemicals contaminates air, water, and soil. A single ton of rare earth metals yields an alarming 2,000 tons of toxic waste, along with dust, waste gas, wastewater, and radioactive residue, resulting in severe health and environmental consequences. This cycle of pollution disrupts the water system, affecting both humans and aquatic life. Consequently, regulations have been introduced worldwide to address these issues, posing challenges to the rare earth metals market.

Opportunities: Rare earth metals recovery from secondary sources

Recovering rare earth metals from secondary sources, known as recycling, involves extracting these metals from discarded items like electronics, catalytic converters, and industrial waste. This approach is often more cost-effective and environmentally friendly than mining for new rare earth metals. One significant source of rare earth metal recovery is from discarded permanent magnets like those found in electric motors, wind turbines, and headphones. Additionally, extracting rare earth elements from coal samples, using diluted mineral acid solutions, has proven effective due to its high concentration and leaching recovery rates. This method reduces energy requirements compared to conventional mining and lessens the environmental impact.

Recovering rare earth metals from secondary sources also reduces dependence on China, a major supplier. For example, recycling neodymium and dysprosium from discarded wind turbine magnets can lessen the need for fresh mining of these metals in China, as they are crucial components in wind turbines. This shift helps reduce industry dependency on Chinese rare earth metals and lowers the environmental footprint while enhancing resource efficiency.

Challenges:  Safety of workers in rare earth elements mining

Extreme caution is essential in rare earth metals mining due to the presence of hazardous compounds, posing health risks to workers. Exposure to leaching chemicals can lead to skin irritation and harm respiratory, nervous, and cardiovascular systems. Long-term exposure to harmful chemicals and toxic waste can even result in severe illnesses like cancer. Many governments have addressed health concerns related to rare earth metal mining. China, for instance, acknowledged the presence of "cancer villages" where mining-related pollution has caused a disproportionate number of cancer cases. In Yulin, a Chinese region with rare earth mining, farmers protested in 2018 as they observed adverse effects on their crops and livelihoods due to rare earth element extraction.

ECOSYSTEM

Rare Earth Metals Leaching Chemicals Market Ecosystem

By Type, Nitric Acid segment accounted for the second highest market share in 2021

Nitric acid plays a pivotal role in the leaching process for extracting rare earth elements (REES) from their mineral source by disrupting their chemical bonds. This strong mineral acid efficiently dissolves rare earth elements, transforming them from solid to aqueous form through a chemical reaction. Monazite, a phosphate-rich mineral containing REES, is often subjected to nitric acid leaching. The process's effectiveness is enhanced by adjusting factors like nitric acid concentration, temperature, and leaching duration as needed. Additionally, nitric acid can be combined with other acids, such as hydrochloric acid and sulfuric acid, to improve the leaching efficiency when dealing with specific rare earth element-bearing minerals.

Asia Pacific is projected to account for the highest CAGR in the rare earth metals leaching chemicals market during the forecast period

APAC is estimated to be the largest market for rare earth metals leaching chemicals  and is also projected to register the fastest CAGR of 7.9% during the forecast period. China is expected to account for the largest share of the market in APAC till 2028. China’s significant industrial growth and urbanization are mainly driving the rare earth metals leaching chemicals market in the country. The emergence of China as a global manufacturing hub has increased the demand for rare earth metals leaching chemicals.

Rare Earth Metals Leaching Chemicals Market by Region

To know about the assumptions considered for the study, download the pdf brochure

Key Market Players

Rare earth metals leaching chemicals market comprises key manufacturers such as BASF SE (Germany), OxyChem (US), Olin Corporation (US), Aurubis (Germany), Solvay S. A. (Belgium), UBE Corporation (Japan), LANXESS AG (Germany), Westlake Chemical Partners (US), Gujarat Alkalies and Chemical Limited (GACL) (India), Gujarat State Fertilizers & Chemicals Limited (GSFC) (India) and others. Expansions, acquisitions, and new product developments are some of the major strategies adopted by these key players to enhance their positions in the rare earth metals leaching chemicals market.

Get online access to the report on the World's First Market Intelligence Cloud

  • Easy to Download Historical Data & Forecast Numbers
  • Company Analysis Dashboard for high growth potential opportunities
  • Research Analyst Access for customization & queries
  • Competitor Analysis with Interactive dashboard
  • Latest News, Updates & Trend analysis
Request Sample

Scope of the Report

:

Report Metric

Details

Years Considered

2020–2027

Base year

2021

Forecast period

2022–2027

Unit considered 

Value (USD Million)

Segments

Type and Region

Regions

North America, Europe, Asia-Pacific, Middle East and Africa, and South America

Companies

BASF SE (Germany), OxyChem (US), Olin Corporation (US), Aurubis (Germany), Solvay S. A. (Belgium), UBE Corporation (Japan), LANXESS AG (Germany), Westlake Chemical Partners (US), Gujarat Alkalies and Chemical Limited (GACL) (India), Gujarat State Fertilizers & Chemicals Limited (GSFC) (India), among others are covered in the rare earth metals leaching chemicals market.

This research report categorizes the global rare earth metals leaching chemicals market on the basis of Type and Region.

Rare earth metals leaching chemicals market, By Type
RARE EARTH METALS LEACHING CHEMICALS market, By Region
  • North America
  • Europe
  • Asia Pacific
  • Middle East and Africa
  • South America

The market has been further analyzed for the key countries in each of these regions.

Recent Developments

  • In January 2023, Against the background of significantly weaker earnings in Europe, especially in Germany, as well as the deteriorating framework conditions in the region, BASF SE initiated a cost savings program focusing on Europe and particularly Germany to be implemented from 2023 to 2024.
  • In December 2022, BASF SE and StePac partnered to develop sustainable packaging for the shelf-life extension of fresh produce.
  • In October 2022, Oxy Low Carbon Ventures (OLCV), a subsidiary of Occidental (NYSE: OXY), and Natural Resource Partners L.P. (NRP) entered into a CO2 sequestration agreement. The agreement provides OLCV with the exclusive rights to develop a CO2 sequestration hub on approximately 65,000 acres of pore space controlled by NRP.
  • In August 2022, OxyChem entered into a definitive agreement to sell non-strategic land in the Permian Basin to an entity of Colgate Energy Partners III, LLC for USD 508 million, subject to closing adjustments to reflect an effective date of April 1, 2021.
  • In December 2022, Intersect Capital LLC acquired 1,964 shares of Olin Corporation.
  • In July 2021, Olin Corporation entered into an agreement with ASHTA Chemicals, Inc. to buy and sell chlorine produced at ASHTA's Ohio facility in the US.
  • In May 2020, Aurubis acquired Metallo Group Holding, a Belgian-Spanish recycling company, for a purchase price of USD 449.3 million. Metallo Group Holding was owned by investment firm TowerBrook Capital Partners.

Frequently Asked Questions (FAQ):

To speak to our analyst for a discussion on the above findings, click Speak to Analyst

TABLE OF CONTENTS
 
1 INTRODUCTION (Page No. - 25)
    1.1 STUDY OBJECTIVES 
    1.2 MARKET DEFINITION 
    1.3 RARE EARTH METALS LEACHING CHEMICALS MARKET: INCLUSIONS AND EXCLUSIONS 
    1.4 STUDY SCOPE 
           1.4.1 RARE EARTH METALS LEACHING CHEMICALS MARKET SEGMENTATION
           1.4.2 REGIONAL SCOPE
           1.4.3 YEARS CONSIDERED
    1.5 CURRENCY CONSIDERED 
    1.6 UNITS CONSIDERED 
    1.7 LIMITATIONS 
    1.8 STAKEHOLDERS 
 
2 RESEARCH METHODOLOGY (Page No. - 29)
    2.1 RESEARCH DATA 
          FIGURE 1 RARE EARTH METALS LEACHING CHEMICALS MARKET: RESEARCH DESIGN
           2.1.1 SECONDARY DATA
                    2.1.1.1 Key data from secondary sources
           2.1.2 PRIMARY DATA
                    2.1.2.1 Key data from primary sources
                    2.1.2.2 Key industry insights
                    2.1.2.3 Breakdown of primary interviews
                                FIGURE 2 BREAKDOWN OF PRIMARY INTERVIEWS
    2.2 MARKET SIZE ESTIMATION 
           2.2.1 MARKET SIZE ESTIMATION BASED ON GLOBAL RARE EARTH METAL PRODUCTION
                    FIGURE 3 MARKET SIZE ESTIMATION BASED ON RARE EARTH METAL PRODUCTION
    2.3 DATA TRIANGULATION 
          FIGURE 4 RARE EARTH METALS LEACHING CHEMICALS MARKET: DATA TRIANGULATION
    2.4 ASSUMPTIONS 
           2.4.1 LIMITATIONS
           2.4.2 GROWTH RATE ASSUMPTIONS
           2.4.3 RECESSION IMPACT
                    TABLE 1 GDP GROWTH RATE OF REGIONS
 
3 EXECUTIVE SUMMARY (Page No. - 37)
    FIGURE 5 HYDROCHLORIC ACID ACCOUNTED FOR LARGEST MARKET SIZE IN 2021
    FIGURE 6 ASIA PACIFIC TO DOMINATE MARKET DURING FORECAST PERIOD
 
4 PREMIUM INSIGHTS (Page No. - 39)
    4.1 ASIA PACIFIC TO WITNESS HIGHER GROWTH RATE DUE TO GROWING MINING INDUSTRY 
          FIGURE 7 INCREASING DEMAND FOR RARE EARTH METALS ACROSS SEVERAL INDUSTRIES TO DRIVE MARKET
    4.2 RARE EARTH METALS LEACHING CHEMICALS MARKET, BY REGION AND TYPE 
          FIGURE 8 ASIA PACIFIC AND HYDROCHLORIC ACID LED RESPECTIVE MARKET SEGMENTS IN 2021
    4.3 RARE EARTH METALS LEACHING CHEMICALS MARKET, BY COUNTRY 
          FIGURE 9 RARE EARTH METALS LEACHING CHEMICALS MARKET IN CHINA PROJECTED TO REGISTER HIGHEST CAGR FROM 2022 TO 2027
 
5 MARKET OVERVIEW (Page No. - 42)
    5.1 INTRODUCTION 
    5.2 MARKET DYNAMICS 
          FIGURE 10 DRIVERS, RESTRAINTS, OPPORTUNITIES, AND CHALLENGES: RARE EARTH METALS LEACHING CHEMICALS MARKET
           5.2.1 DRIVERS
                    5.2.1.1 Rising demand for electric vehicles
                                TABLE 2 GLOBAL ELECTRIC VEHICLE (BEV AND PHEV) SALES, 2019–2021
                    5.2.1.2 Discovery of new rare earth deposits
                    5.2.1.3 Increasing incentives by governments for renewable energy systems
           5.2.2 RESTRAINTS
                    5.2.2.1 Environmental impact of leaching chemicals for rare earth metals
                    5.2.2.2 Government regulations on rare earth metals mining
           5.2.3 OPPORTUNITIES
                    5.2.3.1 Green solvent usage in rare earth metal mining
                    5.2.3.2 Rare earth metals recovery from secondary sources
           5.2.4 CHALLENGES
                    5.2.4.1 Safety of workers in rare earth elements mining
    5.3 PORTER’S FIVE FORCES ANALYSIS 
          FIGURE 11 RARE EARTH METALS LEACHING CHEMICALS MARKET: PORTER’S FIVE FORCES ANALYSIS
           5.3.1 BARGAINING POWER OF SUPPLIERS
           5.3.2 BARGAINING POWER OF BUYERS
           5.3.3 INTENSITY OF COMPETITIVE RIVALRY
           5.3.4 THREAT OF NEW ENTRANTS
           5.3.5 THREAT OF SUBSTITUTES
                    TABLE 3 RARE EARTH METALS LEACHING CHEMICALS MARKET: PORTER’S FIVE FORCES ANALYSIS
    5.4 TARIFF AND REGULATORY LANDSCAPE 
           5.4.1 NORTH AMERICAN REGULATORY INFORMATION
           5.4.2 EUROPEAN REGULATORY INFORMATION
           5.4.3 ASIA PACIFIC REGULATORY INFORMATION
           5.4.4 NORTH AMERICA REGULATORY INFORMATION
           5.4.5 EUROPEAN REGULATORY INFORMATION
           5.4.6 ASIA PACIFIC REGULATORY INFORMATION
           5.4.7 NORTH AMERICA REGULATORY INFORMATION
           5.4.8 EUROPEAN REGULATORY INFORMATION
           5.4.9 ASIA PACIFIC REGULATORY INFORMATION
    5.5 TECHNOLOGY ANALYSIS 
    5.6 AVERAGE SELLING PRICE TREND 
           5.6.1 HYDROCHLORIC ACID AND SULFURIC ACID PRICE TREND FOR 2022
                    5.6.1.1 Asia Pacific
                    5.6.1.2 Europe
                    5.6.1.3 North America
    5.7 TRENDS/DISRUPTIONS IMPACTING CUSTOMERS' BUSINESSES 
           FIGURE 12 GROWING DEMAND FOR RARE EARTH METALS IN END-USE INDUSTRIES TO BRING IN CHANGE IN FUTURE REVENUE MIX
    5.8 KEY STAKEHOLDERS AND BUYING CRITERIA 
           5.8.1 KEY STAKEHOLDERS IN BUYING PROCESS
                    FIGURE 13 INFLUENCE OF STAKEHOLDERS IN BUYING PROCESS
                    TABLE 4 INFLUENCE OF STAKEHOLDERS IN BUYING PROCESS OF RARE EARTH METALS LEACHING CHEMICALS FOR MINING INDUSTRY (%)
           5.8.2 BUYING CRITERIA
                    FIGURE 14 KEY BUYING CRITERIA OF RARE EARTH METALS LEACHING CHEMICALS FOR MINING INDUSTRY
                    TABLE 5 KEY BUYING CRITERIA FOR LEACHING CHEMICALS FOR MINING INDUSTRY
    5.9 KEY CONFERENCES AND EVENTS IN 2022–2023 
          TABLE 6 RARE EARTH METALS LEACHING CHEMICALS MARKET: DETAILED LIST OF CONFERENCES AND EVENTS IN 2023
    5.10 MACROECONOMIC OVERVIEW 
           5.10.1 GLOBAL GDP OUTLOOK
                     TABLE 7 WORLD GDP GROWTH PROJECTION, 2019–2026 (USD BILLION)
    5.11 TRADE ANALYSIS 
            TABLE 8 HYDROCHLORIC ACID EXPORTS, VALUE (BY COUNTRY), 2021
            TABLE 9 HYDROCHLORIC ACID IMPORTS, VALUE (BY COUNTRY), 2021
            TABLE 10 SULFURIC ACID EXPORTS, VALUE (BY COUNTRY), 2021
            TABLE 11 SULFURIC ACID IMPORTS, VALUE (BY COUNTRY), 2021
            TABLE 12 NITRIC ACID EXPORTS, VALUE (BY COUNTRY), 2021
            TABLE 13 NITRIC ACID IMPORTS, VALUE (BY COUNTRY), 2021
            TABLE 14 AMMONIUM SULFATE EXPORTS, VALUE (BY COUNTRY), 2021
            TABLE 15 AMMONIUM SULFATE IMPORTS, VALUE (BY COUNTRY), 2021
           5.11.1 ECOSYSTEM
                     FIGURE 15 LEACHING CHEMICALS FOR RARE EARTH METALS ECOSYSTEM
    5.12 VALUE CHAIN ANALYSIS 
    5.13 PATENT ANALYSIS 
           5.13.1 INTRODUCTION
           5.13.2 METHODOLOGY
           5.13.3 DOCUMENT TYPE (2018–2022)
                     FIGURE 16 DOCUMENT TYPE FOR HYDROCHLORIC ACID (2018–2022)
                     FIGURE 17 PUBLICATION TRENDS FOR HYDROCHLORIC ACID, 2018–2022
           5.13.4 INSIGHTS FOR HYDROCHLORIC ACID
                     FIGURE 18 JURISDICTION ANALYSIS FOR HYDROCHLORIC ACID (2018–2022)
           5.13.5 TOP APPLICANTS FOR HYDROCHLORIC ACID
                     FIGURE 19 TOP APPLICANTS FOR HYDROCHLORIC ACID, BY NUMBER OF PATENTS (TILL 2022)
                     TABLE 16 LIST OF PATENTS FOR HYDROCHLORIC ACID
           5.13.6 DOCUMENT TYPE FOR CITRIC ACID (2018–2022)
                     FIGURE 20 DOCUMENT TYPE FOR CITRIC ACID, (2018–2022)
                     FIGURE 21 PUBLICATION TRENDS FOR CITRIC ACID, 2018–2022
           5.13.7 INSIGHTS FOR CITRIC ACID
                     FIGURE 22 JURISDICTION ANALYSIS FOR CITRIC ACID (2018–2022)
           5.13.8 TOP APPLICANTS FOR CITRIC ACID
                     FIGURE 23 TOP APPLICANTS FOR CITRIC ACID, BY NUMBER OF PATENTS (TILL 2022)
                     TABLE 17 LIST OF PATENTS FOR CITRIC ACID
           5.13.9 DOCUMENT TYPE FOR NITRIC ACID (2018–2022)
                     FIGURE 24 DOCUMENT TYPE FOR NITRIC ACID (2018–2022)
                     FIGURE 25 PUBLICATION TRENDS FOR NITRIC ACID, 2018–2022
           5.13.10 INSIGHTS FOR NITRIC ACID
                      FIGURE 26 JURISDICTION ANALYSIS FOR NITRIC ACID (2018–2022)
           5.13.11 TOP APPLICANTS FOR NITRIC ACID
                      FIGURE 27 TOP APPLICANTS FOR NITRIC ACID, BY NUMBER OF PATENTS (TILL 2022)
                      TABLE 18 LIST OF PATENTS FOR NITRIC ACID
           5.13.12 DOCUMENT TYPE FOR SULFURIC ACID (2018–2022)
                      FIGURE 28 DOCUMENT TYPE FOR SULFURIC ACID (2018–2022)
                      FIGURE 29 PUBLICATION TRENDS FOR SULFURIC ACID, 2018–2022
           5.13.13 INSIGHTS FOR SULFURIC ACID
                      FIGURE 30 JURISDICTION ANALYSIS FOR SULFURIC ACID (2018–2022)
           5.13.14 TOP APPLICANTS FOR SULFURIC ACID
                      FIGURE 31 TOP APPLICANTS FOR SULFURIC ACID, BY NUMBER OF PATENTS (TILL 2022)
                      TABLE 19 LIST OF PATENTS FOR SULFURIC ACID
           5.13.15 DOCUMENT TYPE FOR ALUMINUM SULFATE (2018–2022)
                      FIGURE 32 DOCUMENT TYPE FOR ALUMINUM SULFATE (2018–2022)
                      FIGURE 33 PUBLICATION TRENDS FOR ALUMINUM SULFATE, 2018–2022
           5.13.16 INSIGHTS FOR ALUMINUM SULFATE
                      FIGURE 34 JURISDICTION ANALYSIS FOR ALUMINUM SULFATE (2018–2022)
           5.13.17 TOP APPLICANTS FOR ALUMINUM SULFATE
                      FIGURE 35 TOP APPLICANTS FOR ALUMINUM SULFATE, BY NUMBER OF PATENTS (TILL 2022)
                      TABLE 20 LIST OF PATENTS FOR ALUMINUM SULFATE
    5.14 ADJACENT MARKETS 
           5.14.1 GLOBAL RARE EARTH METALS MARKET
           5.14.2 GLOBAL HYDROCHLORIC ACID MARKET
    5.15 CASE ANALYSIS 
           5.15.1 GREEN SOLVENTS FOR PRODUCTION OF RARE EARTH METALS TO REDUCE USAGE OF HARMFUL CHEMICALS
 
6 RARE EARTH METALS LEACHING CHEMICALS MARKET, BY TYPE (Page No. - 85)
    6.1 INTRODUCTION 
          FIGURE 36 RARE EARTH METALS LEACHING CHEMICALS MARKET, BY TYPE, 2022–2027 (USD MILLION)
          TABLE 21 RARE EARTH METALS LEACHING CHEMICALS MARKET, BY TYPE, 2020–2027 (USD MILLION)
          TABLE 22 RARE EARTH METALS LEACHING CHEMICALS MARKET, BY TYPE, 2020–2027 (KILOTON)
    6.2 HYDROCHLORIC ACID 
           6.2.1 HIGH EFFICIENCY TO INCREASE HYDROCHLORIC ACID DEMAND FOR LEACHING OF RARE EARTH ELEMENTS
                    TABLE 23 HYDROCHLORIC ACID: RARE EARTH METALS LEACHING CHEMICALS MARKET, BY REGION, 2020–2027 (USD MILLION)
                    TABLE 24 HYDROCHLORIC ACID: RARE EARTH METALS LEACHING CHEMICALS MARKET, BY REGION, 2020–2027 (KILOTON)
    6.3 SULFURIC ACID 
           6.3.1 INCREASED DEMAND FOR LEACHING OF RARE EARTH ELEMENTS FROM SEVERAL MINERAL ORES TO DRIVE SEGMENT
                    TABLE 25 SULFURIC ACID: RARE EARTH METALS LEACHING CHEMICALS MARKET, BY REGION, 2020–2027 (USD MILLION)
                    TABLE 26 SULFURIC ACID: RARE EARTH METALS LEACHING CHEMICALS MARKET, BY REGION, 2020–2027 (KILOTON)
    6.4 AMMONIUM SULFATE 
           6.4.1 INCREASING USE IN SEVERAL LEACHING TECHNOLOGIES TO DRIVE DEMAND
                    TABLE 27 AMMONIUM SULFATE: RARE EARTH METALS LEACHING CHEMICALS MARKET, BY REGION, 2020–2027 (USD MILLION)
                    TABLE 28 AMMONIUM SULFATE: RARE EARTH METALS LEACHING CHEMICALS MARKET, BY REGION, 2020–2027 (KILOTON)
    6.5 NITRIC ACID 
           6.5.1 RISING USAGE IN COMBINATION WITH OTHER ACIDS, SUCH AS HYDROCHLORIC ACID AND SULFURIC ACID, TO DRIVE DEMAND
                    TABLE 29 NITRIC ACID: RARE EARTH METALS LEACHING CHEMICALS MARKET, BY REGION, 2020–2027 (USD MILLION)
                    TABLE 30 NITRIC ACID: RARE EARTH METALS LEACHING CHEMICALS MARKET, BY REGION, 2020–2027 (KILOTON)
    6.6 CITRIC ACID 
           6.6.1 AFFORDABILITY, ACCESSIBILITY, AND NON-TOXICITY TO DRIVE DEMAND
                    TABLE 31 CITRIC ACID: RARE EARTH METALS LEACHING CHEMICALS MARKET, BY REGION, 2020–2027 (USD MILLION)
                    TABLE 32 CITRIC ACID: RARE EARTH METALS LEACHING CHEMICALS MARKET, BY REGION, 2020–2027 (KILOTON)
    6.7 OTHERS 
          TABLE 33 OTHERS: RARE EARTH METALS LEACHING CHEMICALS MARKET, BY REGION, 2020–2027 (USD MILLION)
          TABLE 34 OTHERS: RARE EARTH METALS LEACHING CHEMICALS MARKET, BY REGION, 2020–2027 (KILOTON)
 
7 RARE EARTH METALS LEACHING CHEMICALS MARKET, BY REGION (Page No. - 95)
    7.1 INTRODUCTION 
          FIGURE 37 CHINA TO RECORD HIGHEST GROWTH RATE DURING FORECAST PERIOD
          TABLE 35 RARE EARTH METALS LEACHING CHEMICALS MARKET, BY REGION, 2020–2027 (USD MILLION)
          TABLE 36 RARE EARTH METALS LEACHING CHEMICALS MARKET, BY REGION, 2020–2027 (KILOTON)
    7.2 ASIA PACIFIC 
          FIGURE 38 ASIA PACIFIC: RARE EARTH METALS LEACHING CHEMICALS MARKET SNAPSHOT
          TABLE 37 ASIA PACIFIC: RARE EARTH METALS LEACHING CHEMICALS MARKET, BY COUNTRY, 2020–2027 (USD MILLION)
          TABLE 38 ASIA PACIFIC: RARE EARTH METALS LEACHING CHEMICALS MARKET, BY COUNTRY, 2020–2027 (KILOTON)
          TABLE 39 ASIA PACIFIC: RARE EARTH METALS LEACHING CHEMICALS MARKET, BY TYPE, 2020–2027 (USD MILLION)
          TABLE 40 ASIA PACIFIC: RARE EARTH METALS LEACHING CHEMICALS MARKET, BY TYPE, 2020–2027 (KILOTON)
           7.2.1 CHINA
                    7.2.1.1 Lack of environmental regulations and cheap labor and resources to drive market
                                TABLE 41 CHINA: RARE EARTH METALS LEACHING CHEMICALS MARKET, BY TYPE, 2020–2027 (USD MILLION)
                                TABLE 42 CHINA: RARE EARTH METALS LEACHING CHEMICALS MARKET, BY TYPE, 2020–2027 (KILOTON)
           7.2.2 AUSTRALIA
                    7.2.2.1 Increasing government investment in mineral and mining industries to drive market
                                TABLE 43 AUSTRALIA: RARE EARTH METALS LEACHING CHEMICALS MARKET, BY TYPE, 2020–2027 (USD MILLION)
                                TABLE 44 AUSTRALIA: RARE EARTH METALS LEACHING CHEMICALS MARKET, BY TYPE, 2020–2027 (KILOTON)
           7.2.3 INDIA
                    7.2.3.1 Favorable government policies for rare earth elements industry to drive market
                                TABLE 45 INDIA: RARE EARTH METALS LEACHING CHEMICALS MARKET, BY TYPE, 2020–2027 (USD MILLION)
                                TABLE 46 INDIA: RARE EARTH METALS LEACHING CHEMICALS MARKET, BY TYPE, 2020–2027 (KILOTON)
           7.2.4 MALAYSIA
                    7.2.4.1 Rising investments in rare earth elements industry to drive market
                                TABLE 47 MALAYSIA: RARE EARTH METALS LEACHING CHEMICALS MARKET, BY TYPE, 2020–2027 (USD MILLION)
                                TABLE 48 MALAYSIA: RARE EARTH METALS LEACHING CHEMICALS MARKET, BY TYPE, 2020–2027 (KILOTON)
           7.2.5 THAILAND
                    7.2.5.1 Rising awareness regarding technologies to produce rare earth metals from waste to drive market
                                TABLE 49 THAILAND: RARE EARTH METALS LEACHING CHEMICALS MARKET, BY TYPE, 2020–2027 (USD MILLION)
                                TABLE 50 THAILAND: RARE EARTH METALS LEACHING CHEMICALS MARKET, BY TYPE, 2020–2027 (KILOTON)
           7.2.6 REST OF ASIA PACIFIC
                    TABLE 51 REST OF ASIA PACIFIC: RARE EARTH METALS LEACHING CHEMICALS MARKET, BY TYPE, 2020–2027 (USD MILLION)
                    TABLE 52 REST OF ASIA PACIFIC: RARE EARTH METALS LEACHING CHEMICALS MARKET, BY TYPE, 2020–2027 (KILOTON)
    7.3 NORTH AMERICA 
           7.3.1 NORTH AMERICA: RECESSION IMPACT
                    FIGURE 39 NORTH AMERICA: RARE EARTH METALS LEACHING CHEMICALS MARKET SNAPSHOT
                    TABLE 53 NORTH AMERICA: RARE EARTH METALS LEACHING CHEMICALS MARKET, BY COUNTRY, 2020–2027 (USD MILLION)
                    TABLE 54 NORTH AMERICA: RARE EARTH METALS LEACHING CHEMICALS MARKET, BY COUNTRY, 2020–2027 (KILOTON)
                    TABLE 55 NORTH AMERICA: RARE EARTH METALS LEACHING CHEMICALS MARKET, BY TYPE, 2020–2027 (USD MILLION)
                    TABLE 56 NORTH AMERICA: RARE EARTH METALS LEACHING CHEMICALS MARKET, BY TYPE, 2020–2027 (KILOTON)
           7.3.2 US
                    7.3.2.1 Presence of leading manufacturers of rare earth metals leaching chemicals to drive market
                                TABLE 57 US: RARE EARTH METALS LEACHING CHEMICALS MARKET, BY TYPE, 2020–2027 (USD MILLION)
                                TABLE 58 US: RARE EARTH METALS LEACHING CHEMICALS MARKET, BY TYPE, 2020–2027 (KILOTON)
           7.3.3 CANADA
                    7.3.3.1 Need for clean energy applications to drive market
                                TABLE 59 CANADA: RARE EARTH METALS LEACHING CHEMICALS MARKET, BY TYPE, 2020–2027 (USD MILLION)
                                TABLE 60 CANADA: RARE EARTH METALS LEACHING CHEMICALS MARKET, BY TYPE, 2020–2027 (KILOTON)
           7.3.4 MEXICO
                    7.3.4.1 Growth in green technology and consumer electronics sectors to drive demand for rare earth metals
                                TABLE 61 MEXICO: RARE EARTH METALS LEACHING CHEMICALS MARKET, BY TYPE, 2020–2027 (USD MILLION)
                                TABLE 62 MEXICO: RARE EARTH METALS LEACHING CHEMICALS MARKET, BY TYPE, 2020–2027 (KILOTON)
    7.4 EUROPE 
           7.4.1 EUROPE: RECESSION IMPACT
                    TABLE 63 EUROPE: RARE EARTH METALS LEACHING CHEMICALS MARKET, BY COUNTRY, 2020–2027 (USD THOUSAND)
                    TABLE 64 EUROPE: RARE EARTH METALS LEACHING CHEMICALS MARKET, BY COUNTRY, 2020–2027 (TON)
                    TABLE 65 EUROPE: RARE EARTH METALS LEACHING CHEMICALS MARKET, BY TYPE, 2020–2027 (USD THOUSAND)
                    TABLE 66 EUROPE: RARE EARTH METALS LEACHING CHEMICALS MARKET, BY TYPE, 2020–2027 (TON)
           7.4.2 GERMANY
                    7.4.2.1 Presence of leading manufacturers of rare earth metals leaching chemicals to drive market
                                TABLE 67 GERMANY: RARE EARTH METALS LEACHING CHEMICALS MARKET, BY TYPE, 2020–2027 (USD THOUSAND)
                                TABLE 68 GERMANY: RARE EARTH METALS LEACHING CHEMICALS MARKET, BY TYPE, 2020–2027 (TON)
           7.4.3 UK
                    7.4.3.1 Rising domestic production of rare earth metals to drive market
                                TABLE 69 UK: RARE EARTH METALS LEACHING CHEMICALS MARKET, BY TYPE, 2020–2027 (USD THOUSAND)
                                TABLE 70 UK: RARE EARTH METALS LEACHING CHEMICALS MARKET, BY TYPE, 2020–2027 (TON)
           7.4.4 FRANCE
                    7.4.4.1 Increased demand for rare earth metals in nuclear power and automotive sectors
                                TABLE 71 FRANCE: RARE EARTH METALS LEACHING CHEMICALS MARKET, BY TYPE, 2020–2027 (USD THOUSAND)
                                TABLE 72 FRANCE: RARE EARTH METALS LEACHING CHEMICALS MARKET, BY TYPE, 2020–2027 (TON)
           7.4.5 RUSSIA
                    7.4.5.1 Rising automotive sector to boost demand
                                TABLE 73 RUSSIA: RARE EARTH METALS LEACHING CHEMICALS MARKET, BY TYPE, 2020–2027 (USD THOUSAND)
                                TABLE 74 RUSSIA: RARE EARTH METALS LEACHING CHEMICALS MARKET, BY TYPE, 2020–2027 (TON)
           7.4.6 SPAIN
                    7.4.6.1 Rising government policies to boost rare earth metals production
                                TABLE 75 SPAIN: RARE EARTH METALS LEACHING CHEMICALS MARKET, BY TYPE, 2020–2027 (USD THOUSAND)
                                TABLE 76 SPAIN: RARE EARTH METALS LEACHING CHEMICALS MARKET, BY TYPE, 2020–2027 (TON)
           7.4.7 REST OF EUROPE
                    TABLE 77 REST OF EUROPE: RARE EARTH METALS LEACHING CHEMICALS MARKET, BY TYPE, 2020–2027 (USD THOUSAND)
                    TABLE 78 REST OF EUROPE: RARE EARTH METALS LEACHING CHEMICALS MARKET, BY TYPE, 2020–2027 (TON)
    7.5 MIDDLE EAST & AFRICA 
           7.5.1 MIDDLE EAST & AFRICA: RECESSION IMPACT
                    TABLE 79 MIDDLE EAST & AFRICA: RARE EARTH METALS LEACHING CHEMICALS MARKET, BY COUNTRY, 2020–2027 (USD THOUSAND)
                    TABLE 80 MIDDLE EAST & AFRICA: RARE EARTH METALS LEACHING CHEMICALS MARKET, BY COUNTRY, 2020–2027 (TON)
                    TABLE 81 MIDDLE EAST & AFRICA: RARE EARTH METALS LEACHING CHEMICALS MARKET, BY TYPE, 2020–2027 (USD THOUSAND)
                    TABLE 82 MIDDLE EAST & AFRICA: RARE EARTH METALS LEACHING CHEMICALS MARKET, BY TYPE, 2020–2027 (TON)
           7.5.2 SOUTH AFRICA
                    7.5.2.1 Presence of leading manufacturers of rare earth metals to drive market
                                TABLE 83 SOUTH AFRICA: RARE EARTH METALS LEACHING CHEMICALS MARKET, BY TYPE, 2020–2027 (USD THOUSAND)
                                TABLE 84 SOUTH AFRICA: RARE EARTH METALS LEACHING CHEMICALS MARKET, BY TYPE, 2020–2027 (TON)
           7.5.3 MADAGASCAR
                    7.5.3.1 Rising investment in rare earth metals production to drive market
                                TABLE 85 MADAGASCAR: RARE EARTH METALS LEACHING CHEMICALS MARKET, BY TYPE, 2020–2027 (USD THOUSAND)
                                TABLE 86 MADAGASCAR: RARE EARTH METALS LEACHING CHEMICALS MARKET, BY TYPE, 2020–2027 (TON)
           7.5.4 SAUDI ARABIA
                    7.5.4.1 Rising demand for green technologies and consumer electronics to drive market
                                TABLE 87 SAUDI ARABIA: RARE EARTH METALS LEACHING CHEMICALS MARKET, BY TYPE, 2020–2027 (USD THOUSAND)
                                TABLE 88 SAUDI ARABIA: RARE EARTH METALS LEACHING CHEMICALS MARKET, BY TYPE, 2020–2027 (TON)
           7.5.5 REST OF MIDDLE EAST & AFRICA
                    TABLE 89 REST OF MIDDLE EAST & AFRICA: RARE EARTH METALS LEACHING CHEMICALS MARKET, BY TYPE, 2020–2027 (USD THOUSAND)
                    TABLE 90 REST OF MIDDLE EAST & AFRICA: RARE EARTH METALS LEACHING CHEMICALS MARKET, BY TYPE, 2020–2027 (TON)
    7.6 SOUTH AMERICA 
           7.6.1 SOUTH AMERICA: RECESSION IMPACT
                    TABLE 91 SOUTH AMERICA: RARE EARTH METALS LEACHING CHEMICALS MARKET, BY COUNTRY, 2020–2027 (USD THOUSAND)
                    TABLE 92 SOUTH AMERICA: RARE EARTH METALS LEACHING CHEMICALS MARKET, BY COUNTRY, 2020–2027 (TON)
                    TABLE 93 SOUTH AMERICA: RARE EARTH METALS LEACHING CHEMICALS MARKET, BY TYPE, 2020–2027 (USD THOUSAND)
                    TABLE 94 SOUTH AMERICA: RARE EARTH METALS LEACHING CHEMICALS MARKET, BY TYPE, 2020–2027 (TON)
           7.6.2 BRAZIL
                    7.6.2.1 Rising automotive sector to boost demand
                                TABLE 95 BRAZIL: RARE EARTH METALS LEACHING CHEMICALS MARKET, BY TYPE, 2020–2027 (USD THOUSAND)
                                TABLE 96 BRAZIL: RARE EARTH METALS LEACHING CHEMICALS MARKET, BY TYPE, 2020–2027 (TON)
           7.6.3 ARGENTINA
                    7.6.3.1 Rising technological development to drive rare earth metals production
                                TABLE 97 ARGENTINA: RARE EARTH METALS LEACHING CHEMICALS MARKET, BY TYPE, 2020–2027 (USD THOUSAND)
                                TABLE 98 ARGENTINA: RARE EARTH METALS LEACHING CHEMICALS MARKET, BY TYPE, 2020–2027 (TON)
           7.6.4 REST OF SOUTH AMERICA
                    TABLE 99 REST OF SOUTH AMERICA: RARE EARTH METALS LEACHING CHEMICALS MARKET, BY TYPE, 2020–2027 (USD THOUSAND)
                    TABLE 100 REST OF SOUTH AMERICA: RARE EARTH METALS LEACHING CHEMICALS MARKET BY TYPE, 2020–2027 (TON)
 
8 COMPETITIVE LANDSCAPE (Page No. - 140)
    8.1 INTRODUCTION 
          TABLE 101 EXPANSION STRATEGY WIDELY ADOPTED BY MARKET PLAYERS BETWEEN 2018 AND 2021
    8.2 KEY PLAYER STRATEGIES 
          TABLE 102 STRATEGIC POSITIONING OF KEY PLAYERS
    8.3 COMPANY EVALUATION QUADRANT 
           8.3.1 STARS
           8.3.2 PERVASIVE PLAYERS
           8.3.3 PARTICIPANTS
           8.3.4 EMERGING LEADERS
                    FIGURE 40 RARE EARTH METALS LEACHING CHEMICALS MARKET: COMPANY EVALUATION MATRIX, 2021
    8.4 START-UPS AND SMALL AND MEDIUM-SIZED ENTERPRISES (SMES) EVALUATION QUADRANT 
           8.4.1 RESPONSIVE COMPANIES
           8.4.2 DYNAMIC COMPANIES
           8.4.3 STARTING BLOCKS
           8.4.4 PROGRESSIVE COMPANIES
                    FIGURE 41 START-UPS AND SMES EVALUATION MATRIX, 2021
    8.5 REVENUE ANALYSIS OF TOP PLAYERS 
          FIGURE 42 REVENUE ANALYSIS OF KEY COMPANIES, 2017–2021
    8.6 COMPETITIVE BENCHMARKING 
          TABLE 103 RARE EARTH METALS LEACHING CHEMICALS MARKET: DETAILED LIST OF KEY START-UPS/SMES
          TABLE 104 RARE EARTH METALS LEACHING CHEMICALS MARKET: COMPETITIVE BENCHMARKING OF KEY PLAYERS
    8.7 COMPETITIVE SCENARIOS AND TRENDS 
           8.7.1 DEALS
                    TABLE 105 RARE EARTH METALS LEACHING CHEMICALS MARKET: DEALS, 2018–2022
           8.7.2 OTHER DEVELOPMENTS
                    TABLE 106 RARE EARTH METALS LEACHING CHEMICALS MARKET: EXPANSIONS, 2018–2022
 
9 COMPANY PROFILES (Page No. - 154)
    9.1 KEY PLAYERS 
(Business Overview, Products/Services/Solutions Offered, MnM View, Key Strengths and Right to Win, Strategic Choices Made, Weaknesses and Competitive Threats, Recent Developments)*
           9.1.1 BASF SE
                    TABLE 107 BASF SE: BUSINESS OVERVIEW
                    FIGURE 43 BASF SE: COMPANY SNAPSHOT
                    TABLE 108 BASF SE: OTHERS
           9.1.2 OXYCHEM
                    TABLE 109 OXYCHEM: BUSINESS OVERVIEW
                    FIGURE 44 OXYCHEM: COMPANY SNAPSHOT
                    TABLE 110 OXYCHEM: OTHERS
           9.1.3 OLIN CORPORATION
                    TABLE 111 OLIN CORPORATION: BUSINESS OVERVIEW
                    FIGURE 45 OLIN CORPORATION: COMPANY SNAPSHOT
                    TABLE 112 OLIN CORPORATION: DEALS
                    TABLE 113 OLIN CORPORATION: OTHERS
           9.1.4 AURUBIS
                    TABLE 114 AURUBIS.: BUSINESS OVERVIEW
                    FIGURE 46 AURUBIS: COMPANY SNAPSHOT
                    TABLE 115 AURUBIS: DEALS
                    TABLE 116 AURUBIS: OTHERS
           9.1.5 SOLVAY S.A.
                    TABLE 117 SOLVAY S.A.: COMPANY OVERVIEW
                    FIGURE 47 SOLVAY S.A.: COMPANY SNAPSHOT
           9.1.6 UBE CORPORATION
                    TABLE 118 UBE CORPORATION: BUSINESS OVERVIEW
                    FIGURE 48 UBE CORPORATION: COMPANY SNAPSHOT
                    TABLE 119 UBE CORPORATION: DEALS
                    TABLE 120 UBE CORPORATION: OTHERS
           9.1.7 LANXESS AG
                    TABLE 121 LANXESS AG: BUSINESS OVERVIEW
                    FIGURE 49 LANXESS AG: COMPANY SNAPSHOT
                    TABLE 122 LANXESS AG: DEALS
                    TABLE 123 LANXESS AG: OTHERS
           9.1.8 WESTLAKE CHEMICAL PARTNERS
                    TABLE 124 WESTLAKE CHEMICAL PARTNERS: BUSINESS OVERVIEW
                    FIGURE 50 WESTLAKE CHEMICAL PARTNERS: COMPANY SNAPSHOT
           9.1.9 GUJARAT STATE FERTILIZERS & CHEMICALS LIMITED
                    TABLE 125 GUJARAT STATE FERTILIZERS & CHEMICALS LIMITED: BUSINESS OVERVIEW
                    FIGURE 51 GUJARAT STATE FERTILIZERS & CHEMICALS LIMITED: COMPANY SNAPSHOT
           9.1.10 GUJARAT ALKALIES & CHEMICALS LTD.
                    TABLE 126 GUJARAT ALKALIES & CHEMICALS LTD.: BUSINESS OVERVIEW
                    FIGURE 52 GUJARAT ALKALIES & CHEMICALS LTD.: COMPANY SNAPSHOT
                    TABLE 127 GUJARAT ALKALIES & CHEMICALS LTD.: OTHERS
*Business Overview, Products/Services/Solutions Offered, MnM View, Key Strengths and Right to Win, Strategic Choices Made, Weaknesses and Competitive Threats, Recent Developments might not be captured in case of unlisted companies.
    9.2 OTHER PLAYERS 
           9.2.1 LANGYI CHEM
                    TABLE 128 LANGYI CHEM: COMPANY OVERVIEW
           9.2.2 INEOS GROUP AG
                    TABLE 129 INEOS GROUP AG: COMPANY OVERVIEW
           9.2.3 ERCO WORLDWIDE
                    TABLE 130 ERCO WORLDWIDE: COMPANY OVERVIEW
           9.2.4 SASOL
                    TABLE 131 SASOL: COMPANY OVERVIEW
           9.2.5 GRUPA AZOTY SA
                    TABLE 132 GRUPA AZOTY SA: COMPANY OVERVIEW
           9.2.6 TRONOX HOLDINGS PLC
                    TABLE 133 TRONOX HOLDINGS PLC: COMPANY OVERVIEW
           9.2.7 ARKEMA SA
                    TABLE 134 ARKEMA SA: COMPANY OVERVIEW
           9.2.8 LSB INDUSTRIES
                    TABLE 135 LSB INDUSTRIES: COMPANY OVERVIEW
           9.2.9 QATAR ACIDS COMPANY
                    TABLE 136 QATAR ACIDS COMPANY: COMPANY OVERVIEW
           9.2.10 WEYLCHEM GROUP OF COMPANIES
                    TABLE 137 WEYLCHEM GROUP OF COMPANIES: COMPANY OVERVIEW
           9.2.11 SUMITOMO CHEMICAL CO., LTD.
                    TABLE 138 SUMITOMO CHEMICAL CO., LTD.: COMPANY OVERVIEW
           9.2.12 TKG HUCHEMS CO., LTD.
                    TABLE 139 TKG HUCHEMS CO., LTD.: COMPANY OVERVIEW
           9.2.13 DOMO CHEMICALS
                    TABLE 140 DOMO CHEMICALS: COMPANY OVERVIEW
           9.2.14 CF INDUSTRIES HOLDINGS, INC.
                    TABLE 141 CF INDUSTRIES HOLDINGS, INC.: COMPANY OVERVIEW
           9.2.15 JONES-HAMILTON CO.
                    TABLE 142 JONES-HAMILTON CO.: COMPANY OVERVIEW
 
10 APPENDIX (Page No. - 200)
     10.1 DISCUSSION GUIDE 
     10.2 KNOWLEDGESTORE: MARKETSANDMARKETS’ SUBSCRIPTION PORTAL 
     10.3 CUSTOMIZATION OPTIONS 
     10.4 RELATED REPORTS 
     10.5 AUTHOR DETAILS 

This research study involves the use of extensive secondary sources, directories, and databases, such as Hoovers, ICIS articles, Factiva, and Bloomberg Businessweek, to identify and gather information for a technical, market-oriented, and commercial study of the rare earth metals leaching chemicals market. The primary sources include industry experts from core and related industries and preferred suppliers, regulatory bodies, and organizations related to all segments of the value chain of this industry. In-depth interviews have been conducted with different primary respondents, such as key industry participants, subject matter experts (SMEs), C-Level executives of key market players, and industry consultants, to obtain and verify critical qualitative and quantitative information, as well as to assess growth prospects.

Secondary Research

In the secondary research process, sources such as annual reports, press releases, investor presentations of companies; white papers; publications from recognized websites; and databases have been referred to for identifying and collecting information. Secondary research has been used to obtain key information about the supply chain of the industry, the total pool of key players, market classification, and segmentation according to industry trends to the bottom-most level, regional markets, and key developments from both the market- and technology-oriented perspectives.

Primary Research

After the complete market estimation process (which includes calculations for market statistics, market breakdown, market size estimations, market forecast, and data triangulation), extensive primary research has been conducted to gather information and to verify and validate the critical numbers arrived at. Primary research has also been conducted to identify the segmentation, industry trends, key players, competitive landscape, industry trends, strategies of key players, and key market dynamics such as drivers, restraints, opportunities, and challenges.

In the primary research process, different primary sources from the supply and demand sides have been interviewed to obtain qualitative and quantitative information. The primary sources include industry experts such as CEOs, vice presidents, marketing directors, technology & innovation directors, and related key executives from various companies and organizations operating in the rare earth metals leaching chemicals market.

Following is the breakdown of primary respondents—

Rare Earth Metals Leaching Chemicals Market Size, and Share

Notes: Others include sales, marketing, and product managers.

Tier 1: >USD 1 billion; Tier 2: USD 500 million–1 billion; and Tier 3: <USD 500 million.

To know about the assumptions considered for the study, download the pdf brochure

Market Size Estimation

In the market size estimation process, both the top-down and bottom-up approaches have been used, along with several data triangulation methods to carry out estimations and projections for the overall market and its sub-segments listed in this report. Extensive qualitative and quantitative analyses have been carried out on the complete process to list key information/insights throughout the report. The research methodology used to estimate the market size includes the following:

  • The key players in the industry were identified through extensive secondary research.
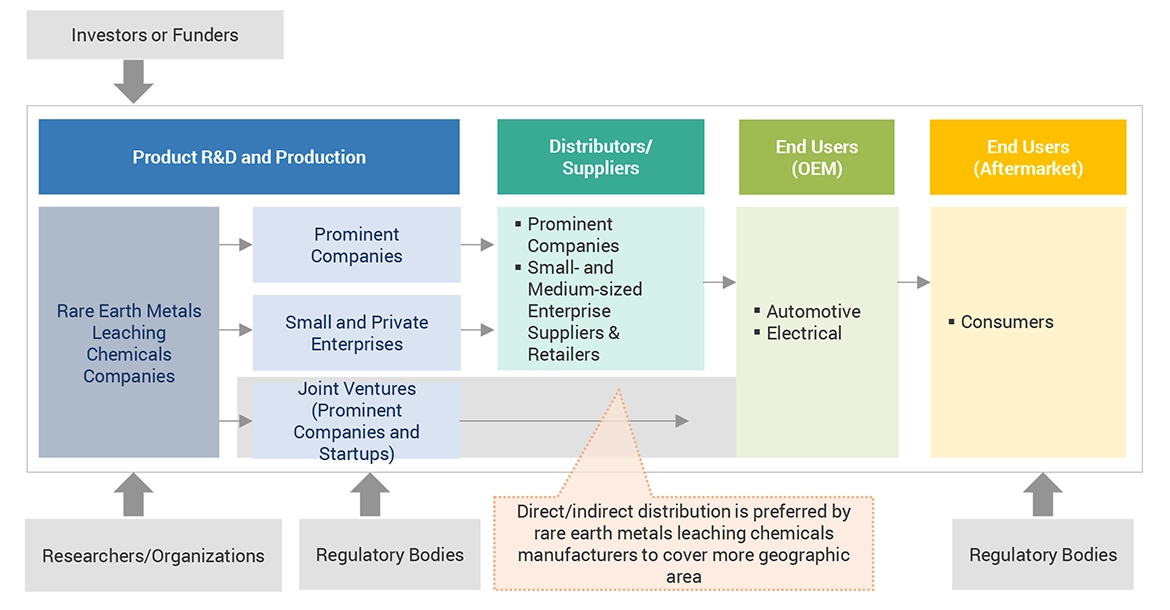
  • The supply chain of the industry and market size, in terms of value, were determined through primary and secondary research.
  • All percentage shares split, and breakdowns were determined using secondary sources and verified through primary sources.
  • All possible parameters that affect the markets covered in this research study were accounted for, viewed in extensive detail, verified through primary research, and analyzed to obtain the final quantitative and qualitative data.
  • The research includes the study of reports, reviews, and newsletters of key industry players along with extensive interviews with key officials, such as directors and marketing executives.

The overall market size has been used in the top-down approach to estimate the sizes of other individual markets mentioned in the segmentation through percentage splits derived using secondary and primary sources.

For calculating each type of specific market segment, the size of the most appropriate immediate parent market has been considered for implementing the top-down approach. The bottom-up approach has also been implemented for data extracted from secondary research to validate the market sizes, in terms of value and volume, obtained for each segment.

The exact values of the overall parent and individual markets have been determined and confirmed through the data triangulation procedure and validation of data through primary interviews. The data triangulation procedure implemented for this study is explained in the next section.

Data Triangulation

Following the estimating process described above to determine the total market size, the market was divided into a number of segments and sub-segments. In order to complete the process of estimating the overall market size and determine the precise statistics for all segments and sub-segments, the data triangulation and market breakdown processes were used, where applicable. By examining multiple factors and trends from both the supply and demand sides, the data was triangulated. In addition, both top-down and bottom-up methods were used to validate the market size. After that, it was verified through primary interviews. As a result, there are three sources for each data segment: a top-down approach, a bottom-up approach, and expert interviews. The data was assumed to be correct when the values arrived at from the three sources matched.

Market Definition

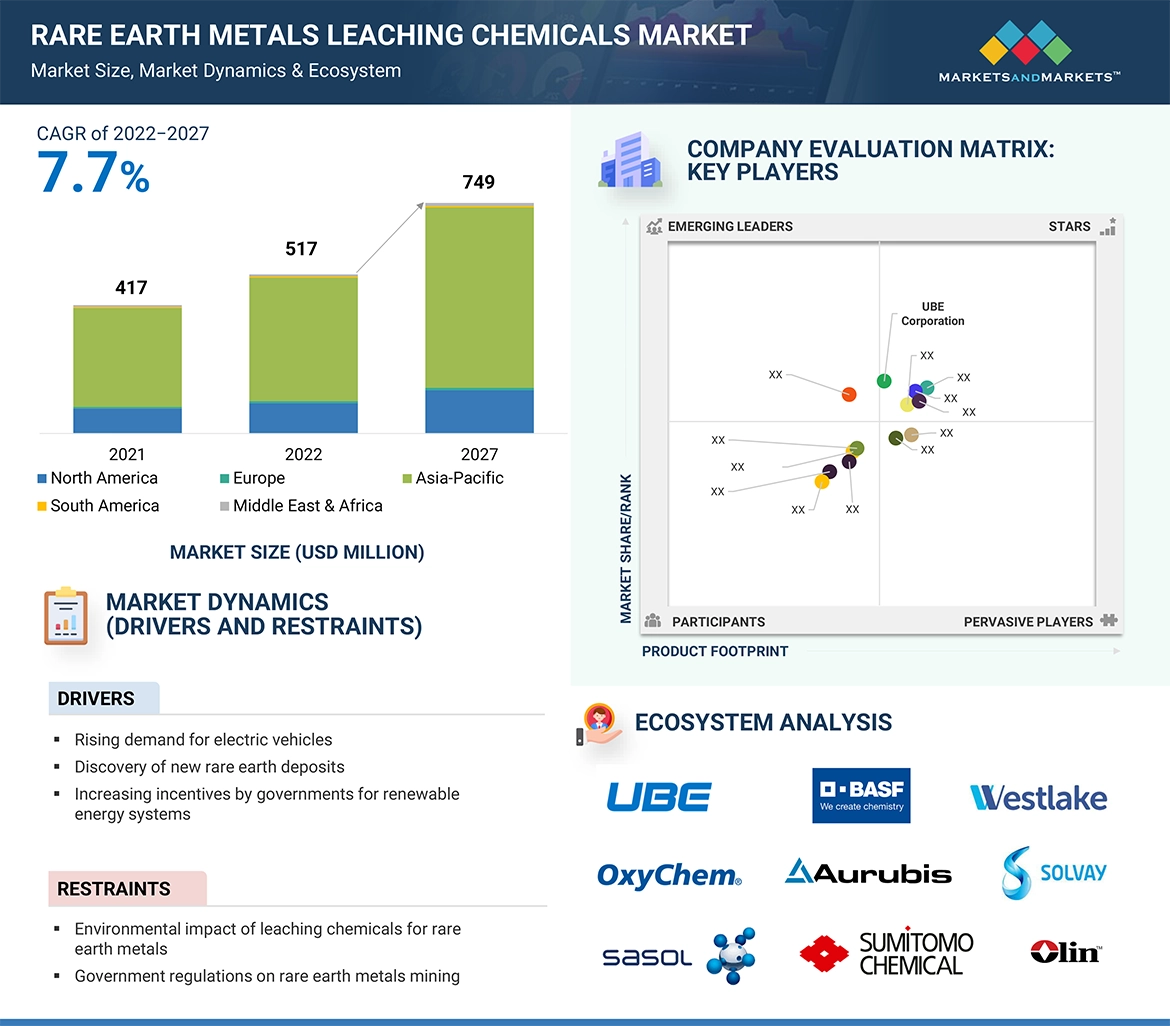
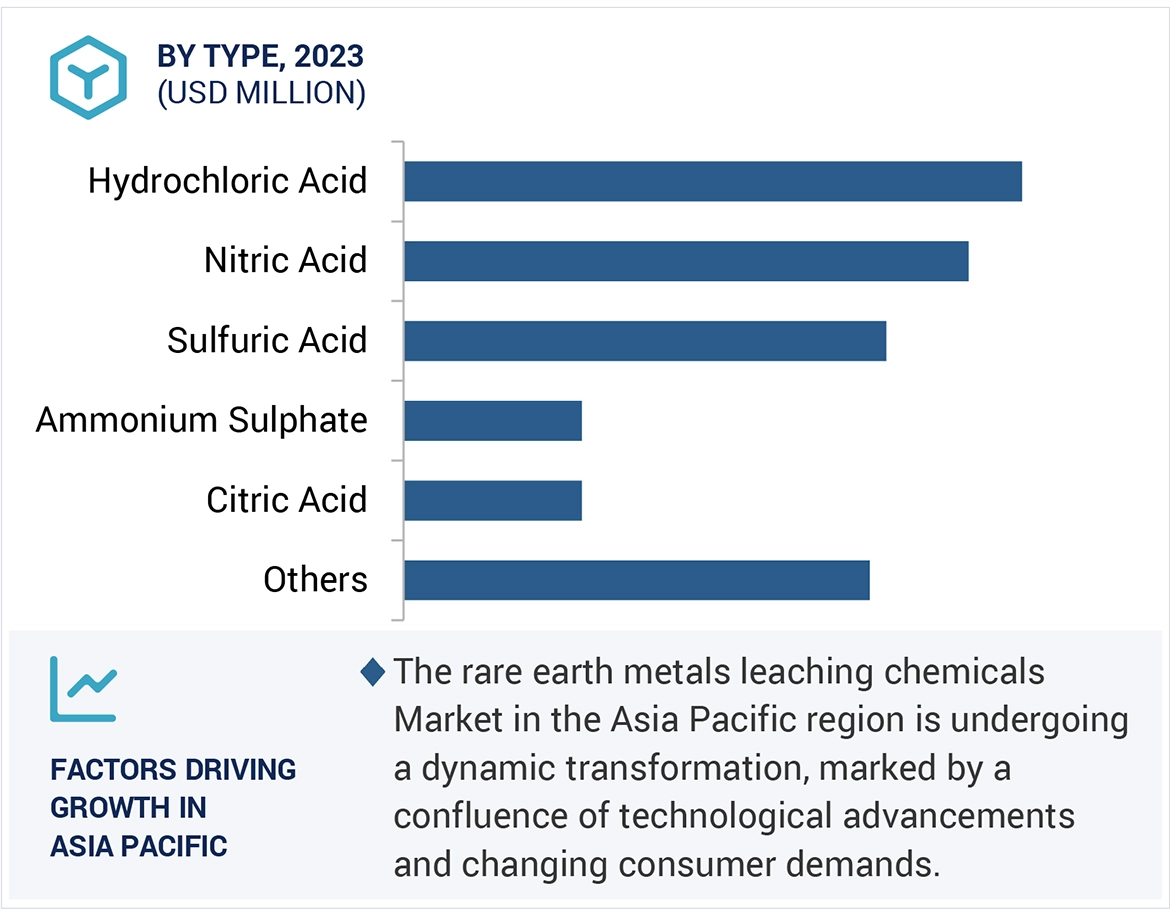
Rare earth elements are a group of 17 chemical elements that occur together. The group comprises yttrium and 15 lanthanide elements (lanthanum, cerium, praseodymium, neodymium, promethium, samarium, europium, gadolinium, terbium, dysprosium, holmium, erbium, thulium, ytterbium, and lutetium). These rare earth elements are present in small concentrations in mineral deposits (basanite and monazite) and ion clay. Therefore, the leaching process is employed to recover rare earth metals from sources. In the process of leaching, strong leaching agents that are required to separate and recover rare earth metals from their sources are known as rare earth metals leaching chemicals. These leaching chemicals are classified as hydrochloric acid, sulfuric acid, nitric acid, ammonium sulfate, citric acid, and others. The increasing demand for rare earth metals in end-use industries such as automotive and clean energy, and the increasing chemical market in Asia Pacific will lead to the growth of rare earth metals leaching chemicals in the forecast period.

Key Stakeholders

  • Manufacturers of rare earth metals leaching chemicals
  • Industry associations
  • Rare earth metals leaching chemicals traders, suppliers, and distributors
  • Regional manufacturers’ associations
  • Government and regional agencies and research organizations

Report Objectives

  • To define, describe, and forecast the rare earth metals leaching chemicals market in terms of value and volume.
  • To provide detailed information regarding the key factors influencing the growth of the market, such as drivers, restraints, opportunities, and challenges.
  • To analyze and forecast the market size in terms of value and volume, with respect to four main regions: North America, Europe, Asia-Pacific, Middle East and Africa, and South America.
  • To strategically analyze the micro markets with respect to individual growth trends, future prospects, and contribution to the total market
  • To analyze the opportunities in the market for stakeholders and draw a competitive landscape for market leaders
  • To analyze competitive developments, such as products & services offered, and expansion, in the market
  • To strategically profile key players and comprehensively analyze their core competencies

Available Customizations:

Along with the given market data, MarketsandMarkets offers customizations as per the specific needs of the companies. The following customization options are available for the report:

Product Analysis:

  • Product Matrix which gives a detailed comparison of the product portfolio of each company

Regional Analysis:

  • Further breakdown of the Rest of APAC Rare earth metals leaching chemicals market
  • Further breakdown of Rest of Europe Rare earth metals leaching chemicals market
  • Further breakdown of the Rest of Middle East & Africa Rare earth metals leaching chemicals market
  • Further breakdown of Rest of South America Rare earth metals leaching chemicals market

Company Information:

  • Detailed analysis and profiling of additional market players (up to 5)
Custom Market Research Services

We will customize the research for you, in case the report listed above does not meet with your exact requirements. Our custom research will comprehensively cover the business information you require to help you arrive at strategic and profitable business decisions.

Request Customization
Report Code
MM 8821
Published ON
Oct, 2023
Choose License Type
BUY NOW
  • SHARE
X
Request Customization
Speak to Analyst
Speak to Analyst
OR FACE-TO-FACE MEETING
PERSONALIZE THIS RESEARCH
  • Triangulate with your Own Data
  • Get Data as per your Format and Definition
  • Gain a Deeper Dive on a Specific Application, Geography, Customer or Competitor
  • Any level of Personalization
REQUEST A FREE CUSTOMIZATION
LET US HELP YOU!
  • What are the Known and Unknown Adjacencies Impacting the Rare Earth Metals Leaching Chemicals Market
  • What will your New Revenue Sources be?
  • Who will be your Top Customer; what will make them switch?
  • Defend your Market Share or Win Competitors
  • Get a Scorecard for Target Partners
CUSTOMIZED WORKSHOP REQUEST
+1-888-600-6441
  • Call Us
  • +1-888-600-6441 (Corporate office hours)
  • +1-888-600-6441 (US/Can toll free)
  • +44-800-368-9399 (UK office hours)
CONNECT WITH US
ABOUT TRUST ONLINE
©2024 MarketsandMarkets Research Private Ltd. All rights reserved
DMCA.com Protection Status Website Feedback