TABLE OF CONTENTS
1 INTRODUCTION (Page No. - 26)
1.1 STUDY OBJECTIVES
1.2 MARKET DEFINITION
1.3 STUDY SCOPE
1.3.1 INCLUSIONS AND EXCLUSIONS
1.3.2 REGIONS COVERED
1.3.3 YEARS CONSIDERED
1.4 CURRENCY CONSIDERED
1.5 UNITS CONSIDERED
1.6 LIMITATIONS
1.7 STAKEHOLDERS
1.8 SUMMARY OF CHANGES
2 RESEARCH METHODOLOGY (Page No. - 31)
2.1 RESEARCH DATA
2.1.1 SECONDARY DATA
2.1.1.1 Key data from secondary sources
2.1.2 PRIMARY DATA
2.1.2.1 Key data from primary sources
2.1.2.2 Key industry insights
2.1.2.3 Breakdown of interviews with experts
2.2 MARKET SIZE ESTIMATION
2.2.1 BOTTOM-UP APPROACH
2.2.2 TOP-DOWN APPROACH
2.2.3 VOLUME MARKET APPROACH
2.3 DATA TRIANGULATION
2.4 FACTOR ANALYSIS
2.5 IMPACT OF RECESSION
2.6 RESEARCH ASSUMPTIONS
2.7 RESEARCH LIMITATIONS
2.8 RISK ASSESSMENT
3 EXECUTIVE SUMMARY (Page No. - 40)
4 PREMIUM INSIGHTS (Page No. - 44)
4.1 ATTRACTIVE OPPORTUNITIES FOR PLAYERS IN HYDROCHLORIC ACID MARKET
4.2 ASIA PACIFIC: HYDROCHLORIC ACID MARKET, BY END-USE INDUSTRY AND COUNTRY
4.3 HYDROCHLORIC ACID MARKET, BY GRADE
4.4 HYDROCHLORIC ACID MARKET, BY APPLICATION
4.5 HYDROCHLORIC ACID MARKET, BY END-USE INDUSTRY
4.6 HYDROCHLORIC ACID MARKET, BY KEY COUNTRY
5 MARKET OVERVIEW (Page No. - 47)
5.1 INTRODUCTION
5.2 MARKET DYNAMICS
5.2.1 DRIVERS
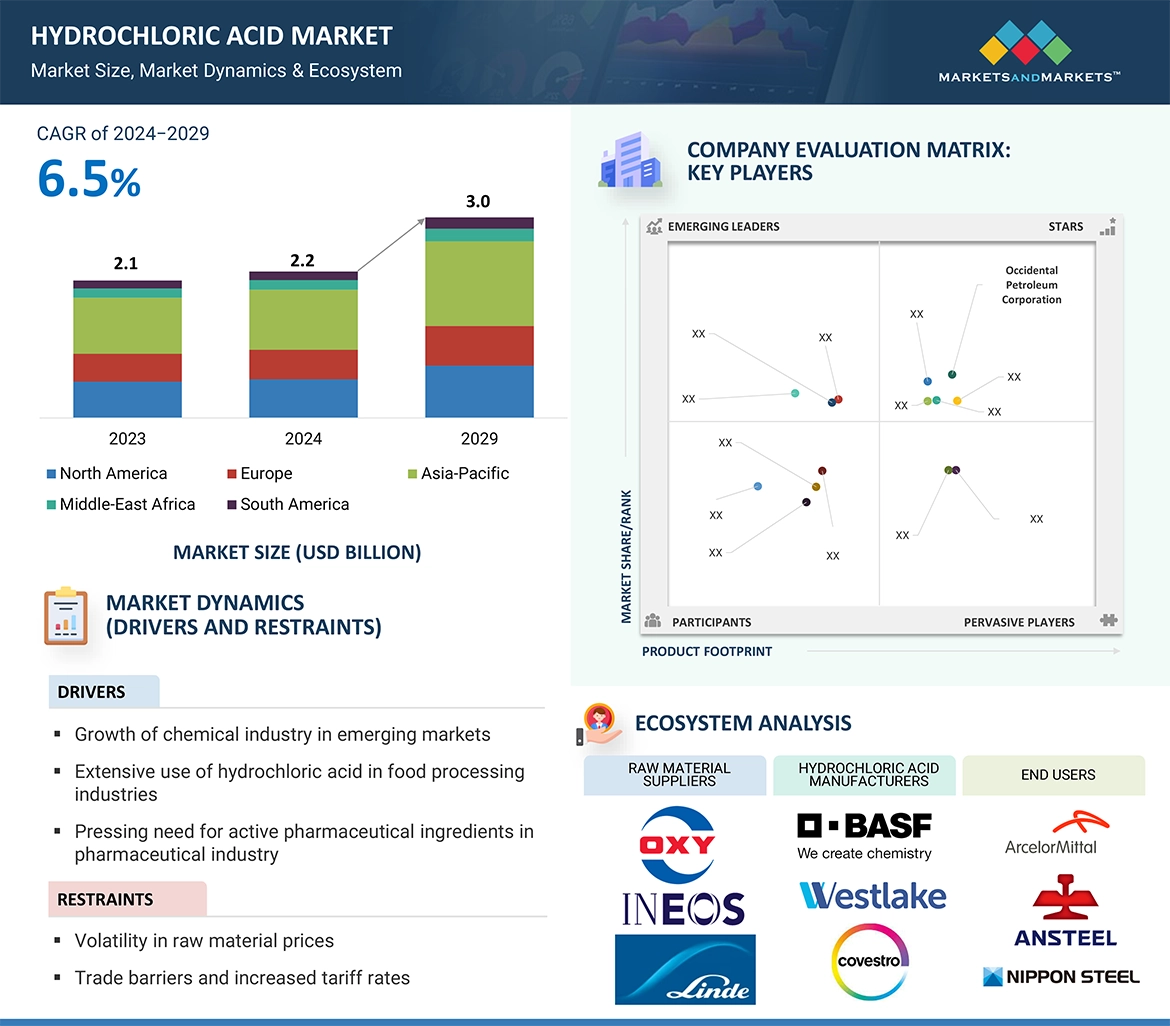
5.2.1.1 Growth of chemical industry in emerging markets
5.2.1.2 Extensive use of hydrochloric acid in food processing industries
5.2.1.3 Pressing need for active pharmaceutical ingredients in pharmaceutical industry
5.2.1.4 High demand for steel pickling in metal processing industry
5.2.2 RESTRAINTS
5.2.2.1 Volatility in raw material prices
5.2.2.2 Trade barriers and increased tariff rates
5.2.3 OPPORTUNITIES
5.2.3.1 Water treatment and environmental remediation
5.2.3.2 Increasing demand for hydrochloric acid in oil & gas industry
5.2.3.3 Extensive laboratory use of hydrochloric acid
5.2.4 CHALLENGES
5.2.4.1 Health and environmental concerns
5.2.4.2 Customer preferences and sustainability
6 INDUSTRY TRENDS (Page No. - 53)
6.1 PORTER’S FIVE FORCES ANALYSIS
6.1.1 THREAT OF NEW ENTRANTS
6.1.2 THREAT OF SUBSTITUTES
6.1.3 BARGAINING POWER OF SUPPLIERS
6.1.4 BARGAINING POWER OF BUYERS
6.1.5 INTENSITY OF COMPETITIVE RIVALRY
6.2 VALUE CHAIN ANALYSIS
6.3 TRADE ANALYSIS
6.3.1 EXPORT SCENARIO
6.3.2 IMPORT SCENARIO
6.4 MACROECONOMIC INDICATORS
6.4.1 GLOBAL GDP OUTLOOK
6.5 TECHNOLOGY ANALYSIS
6.5.1 KEY TECHNOLOGIES
6.5.1.1 Preconcentration process
6.5.1.2 Direct synthesis
6.5.2 COMPLEMENTARY TECHNOLOGIES
6.5.2.1 Hydrochloric acid recovery
6.5.2.2 Medium concentration process
6.6 TARIFF AND REGULATORY LANDSCAPE
6.6.1 TARIFF RELATED TO HYDROCHLORIC ACID MARKET
6.6.2 REGULATORY BODIES, GOVERNMENT AGENCIES, AND OTHER ORGANIZATIONS
6.7 CASE STUDY ANALYSIS
6.8 TRENDS AND DISRUPTIONS IMPACTING CUSTOMER BUSINESS
6.9 KEY CONFERENCES & EVENTS IN 2024–2025
6.10 KEY STAKEHOLDERS AND BUYING CRITERIA
6.10.1 KEY STAKEHOLDERS IN BUYING PROCESS
6.10.2 BUYING CRITERIA
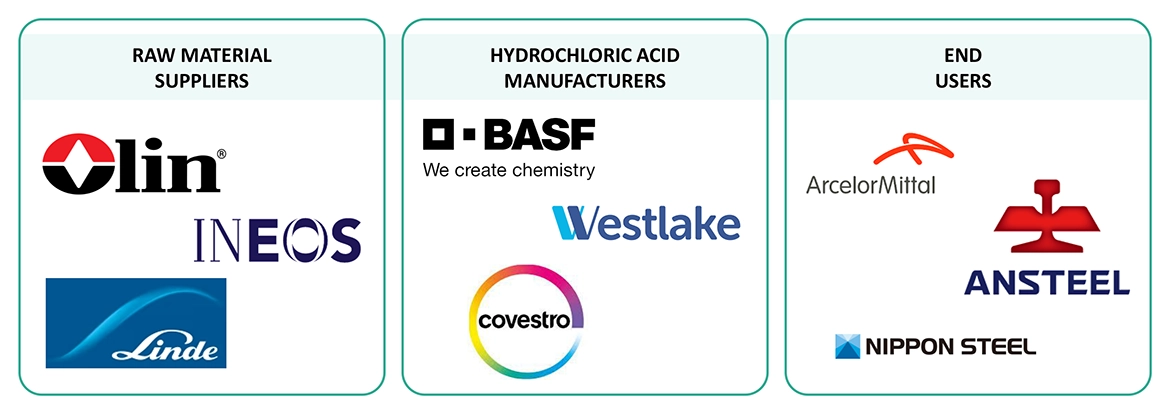
6.11 ECOSYSTEM/MARKET MAP
6.12 PATENT ANALYSIS
6.12.1 INTRODUCTION
6.12.2 METHODOLOGY
6.13 PRICING ANALYSIS
6.13.1 AVERAGE SELLING PRICE TREND OF KEY PLAYERS, BY GRADE
6.13.2 AVERAGE SELLING PRICE TREND, BY REGION
7 HYDROCHLORIC ACID MARKET, BY GRADE (Page No. - 75)
7.1 INTRODUCTION
7.2 SYNTHETIC GRADE
7.2.1 WIDE USE IN CHEMICAL MANUFACTURING AND METAL PROCESSING TO BOOST DEMAND
7.3 BY-PRODUCT GRADE
7.3.1 SURGING DEMAND IN AGROCHEMICALS AND ION EXCHANGERS TO DRIVE MARKET
8 HYDROCHLORIC ACID MARKET, BY APPLICATION (Page No. - 80)
8.1 INTRODUCTION
8.2 STEEL PICKLING
8.2.1 VERSATILE APPLICATIONS IN STEEL PICKLING TO DRIVE DEMAND
8.3 OIL WELL ACIDIZING
8.3.1 PRESSING NEED FOR IMPROVING PRODUCTIVITY OF OIL WELLS TO DRIVE MARKET
8.4 ORE PROCESSING
8.4.1 EFFICACY IN ENHANCING MINERAL EXTRACTION TO DRIVE MARKET
8.5 FOOD PROCESSING
8.5.1 INCREASED DEMAND FOR FOOD ADDITIVES AND FLAVORING AGENTS TO BOOST MARKET
8.6 POOL SANITATION
8.6.1 SURGING DEMAND FOR HYDROCHLORIC ACID IN POOL SANITATION TO DRIVE MARKET
8.7 CALCIUM CHLORIDE
8.7.1 RISING NEED FOR FOOD PRESERVATION AND INDUSTRIAL DRYING TO BOOST DEMAND
8.8 BIODIESEL
8.8.1 INCREASING DEMAND IN BIODIESEL PRODUCTION TO DRIVE MARKET
8.9 OTHER APPLICATIONS
9 HYDROCHLORIC ACID MARKET, BY END-USE INDUSTRY (Page No. - 91)
9.1 INTRODUCTION
9.2 FOOD & BEVERAGE
9.2.1 INCREASING DEMAND FOR HYDROCHLORIC ACID IN DAIRY PRODUCTS AND SWEETENERS TO DRIVE MARKET
9.3 PHARMACEUTICAL
9.3.1 USE IN VARIOUS PHASES OF DRUG DEVELOPMENT AND PRODUCTION TO DRIVE MARKET
9.4 TEXTILE
9.4.1 RISING DEMAND FOR HYDROCHLORIC ACID IN DYEING AND FABRIC PROCESSING TO DRIVE MARKET
9.5 STEEL
9.5.1 TECHNOLOGICAL ADVANCEMENTS IN STEEL MANUFACTURING AND PICKLING PROCESSES TO SUPPORT MARKET GROWTH
9.6 OIL & GAS
9.6.1 INCREASED DEMAND FOR WELL STIMULATION AND ACIDIZING SERVICES TO DRIVE MARKET
9.7 CHEMICAL
9.7.1 TECHNOLOGICAL ADVANCEMENTS IN CHEMICAL SYNTHESIS AND PRODUCTION PROCESSES TO BOOST DEMAND
9.8 OTHER END-USE INDUSTRIES
10 HYDROCHLORIC ACID MARKET, BY REGION (Page No. - 102)
10.1 INTRODUCTION
10.2 ASIA PACIFIC
10.2.1 RECESSION IMPACT
10.2.2 CHINA
10.2.2.1 Strict environmental regulations and rapid urbanization to drive market
10.2.3 INDIA
10.2.3.1 Growth of food & beverage industry to fuel demand for hydrochloric acid
10.2.4 JAPAN
10.2.4.1 Surge in automotive and steel production to drive market
10.2.5 SOUTH KOREA
10.2.5.1 Growth of chemical and pharmaceutical industries to boost demand
10.2.6 REST OF ASIA PACIFIC
10.3 EUROPE
10.3.1 IMPACT OF RECESSION
10.3.2 GERMANY
10.3.2.1 Advancing circular economy and automotive industry to drive market
10.3.3 FRANCE
10.3.3.1 Surge in water treatment plants to drive market
10.3.4 ITALY
10.3.4.1 Diverse industrial uses and stringent regulatory frameworks to drive market
10.3.5 UK
10.3.5.1 Industrial strength and environmental commitment to boost market
10.3.6 SPAIN
10.3.6.1 Growth of water treatment and steel industry to drive market
10.3.7 REST OF EUROPE
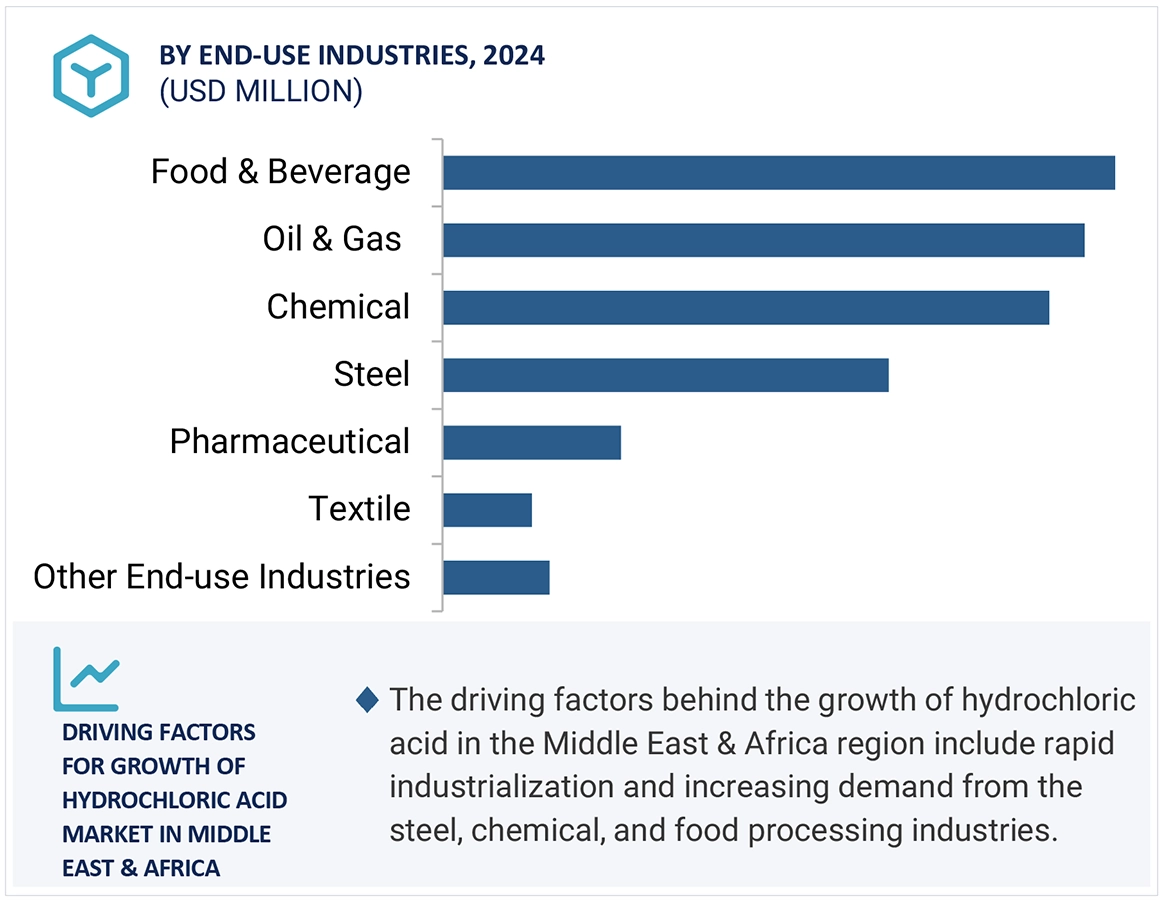
10.4 MIDDLE EAST & AFRICA
10.4.1 RECESSION IMPACT
10.4.2 GCC COUNTRIES
10.4.2.1 Saudi Arabia
10.4.2.1.1 Saudi Vision 2030 to play a crucial role in driving market
10.4.2.2 UAE
10.4.2.2.1 Rising demand for steel in construction and manufacturing activities to drive market
10.4.2.3 Rest of GCC countries
10.4.3 SOUTH AFRICA
10.4.3.1 Mining Charter and Mineral Beneficiation Strategy to support market growth
10.4.4 IRAN
10.4.4.1 Growth of mining and oil & gas industries to drive market
10.4.5 MOROCCO
10.4.5.1 Increasing investments in water treatment infrastructure and industrial growth to boost market
10.4.6 REST OF MIDDLE EAST & AFRICA
10.5 NORTH AMERICA
10.5.1 IMPACT OF RECESSION
10.5.2 US
10.5.2.1 Rise in construction activities to drive market
10.5.3 CANADA
10.5.3.1 Expansion of food & beverage industry to propel market
10.5.4 MEXICO
10.5.4.1 Growth of pharmaceutical industry to drive market
10.6 SOUTH AMERICA
10.6.1 IMPACT OF RECESSION
10.6.2 BRAZIL
10.6.2.1 Growth of construction sector to drive market
10.6.3 ARGENTINA
10.6.3.1 Expansion of mining industry to drive market
10.6.4 REST OF SOUTH AMERICA
11 COMPETITIVE LANDSCAPE (Page No. - 194)
11.1 OVERVIEW
11.2 KEY PLAYER STRATEGIES
11.3 REVENUE ANALYSIS OF KEY PLAYERS
11.4 MARKET SHARE ANALYSIS
11.4.1 MARKET RANKING ANALYSIS
11.5 COMPANY VALUATION AND FINANCIAL METRICS
11.6 PRODUCT/BRAND COMPARISON ANALYSIS
11.7 COMPANY EVALUATION MATRIX, KEY PLAYERS
11.7.1 STARS
11.7.2 EMERGING LEADERS
11.7.3 PERVASIVE PLAYERS
11.7.4 PARTICIPANTS
11.7.5 COMPANY FOOTPRINT: KEY PLAYERS, 2023
11.7.5.1 Company footprint
11.7.5.2 Grade footprint
11.7.5.3 Application footprint
11.7.5.4 End-use industry footprint
11.7.5.5 Region footprint
11.8 COMPANY EVALUATION MATRIX, STARTUPS/SMES
11.8.1 PROGRESSIVE COMPANIES
11.8.2 RESPONSIVE COMPANIES
11.8.3 DYNAMIC COMPANIES
11.8.4 STARTING BLOCKS
11.8.5 COMPETITIVE BENCHMARKING: STARTUPS/SMES, 2023
11.9 COMPETITIVE SCENARIO
11.9.1 DEALS
11.9.2 EXPANSIONS
11.9.3 OTHER DEVELOPMENTS
12 COMPANY PROFILES (Page No. - 210)
12.1 KEY PLAYERS
12.1.1 BASF SE
12.1.1.1 Business overview
12.1.1.2 Products/Solutions/Services offered
12.1.1.3 Recent developments
12.1.1.4 MnM view
12.1.1.4.1 Right to win
12.1.1.4.2 Strategic choices
12.1.1.4.3 Weaknesses & competitive threats
12.1.2 COVESTRO AG
12.1.2.1 Business overview
12.1.2.2 Products/Solutions/Services offered
12.1.2.3 MnM view
12.1.2.3.1 Right to win
12.1.2.3.2 Strategic choices
12.1.2.3.3 Weaknesses & competitive threats
12.1.3 OLIN CORPORATION
12.1.3.1 Business overview
12.1.3.2 Products/Solutions/Services offered
12.1.3.3 Recent developments
12.1.3.4 MnM view
12.1.3.4.1 Right to win
12.1.3.4.2 Strategic choices
12.1.3.4.3 Weaknesses & competitive threats
12.1.4 WESTLAKE CORPORATION
12.1.4.1 Business overview
12.1.4.2 Products/Solutions/Services offered
12.1.4.3 Recent developments
12.1.4.4 MnM view
12.1.4.4.1 Right to win
12.1.4.4.2 Strategic choices
12.1.4.4.3 Weaknesses & competitive threats
12.1.5 OCCIDENTAL PETROLEUM CORPORATION
12.1.5.1 Business overview
12.1.5.2 Products/Solutions/Services offered
12.1.5.3 MnM view
12.1.5.3.1 Right to win
12.1.5.3.2 Strategic choices
12.1.5.3.3 Weaknesses & competitive threats
12.1.6 FORMOSA PLASTICS CORPORATION
12.1.6.1 Business overview
12.1.6.2 Products/Solutions/Services offered
12.1.6.3 MnM view
12.1.7 TATA CHEMICALS LIMITED
12.1.7.1 Business overview
12.1.7.2 Products/Solutions/Services offered
12.1.7.3 Recent developments
12.1.7.4 MnM view
12.1.7.4.1 Right to win
12.1.7.4.2 Strategic choices
12.1.7.4.3 Weaknesses and competitive threats
12.1.8 AGC INC.
12.1.8.1 Business overview
12.1.8.2 Products/Solutions/Services offered
12.1.8.3 MnM view
12.1.9 ERCO WORLDWIDE
12.1.9.1 Business overview
12.1.9.2 Products/Solutions/Services offered
12.1.9.3 MnM view
12.1.10 DETREX CORPORATION
12.1.10.1 Business overview
12.1.10.2 Products/Solutions/Services Offered
12.1.10.3 MnM view
12.2 OTHER PLAYERS
12.2.1 AURORA FINE CHEMICALS
12.2.2 ZOUPING DONGFANG CHEMICAL INDUSTRY CO., LTD.
12.2.3 ACURO ORGANICS LIMITED
12.2.4 MAXWELL ADDITIVES PVT. LTD.
12.2.5 CHEMTEX SPECIALITY LIMITED
12.2.6 POLYSCIENCES INC.
12.2.7 INEOS KOH
12.2.8 NOURYON
12.2.9 CONTINENTAL CHEMICAL USA
12.2.10 JONES-HAMILTON CO.
12.2.11 TRONOX HOLDINGS PLC
12.2.12 KUHLMANN EUROPE
12.2.13 PCC GROUP
12.2.14 HAWKINS
12.2.15 HYDRITE CHEMICAL
13 ADJACENT & RELATED MARKET (Page No. - 247)
13.1 INTRODUCTION
13.2 LIMITATIONS
13.2.1 POLYLACTIC ACID MARKET
13.2.1.1 Market definition
13.2.1.2 Polylactic acid market, by raw material
13.2.1.3 Polylactic acid market, by application
13.2.1.4 Polylactic acid market, by end-use industry
13.2.1.5 Polylactic acid market, by grade
13.2.1.6 Polylactic acid market, by region
13.2.2 GLYCOLIC ACID MARKET
13.2.2.1 Market definition
13.2.2.2 Glycolic acid market, by purity
13.2.2.3 Glycolic acid market, by grade
13.2.2.4 Glycolic acid market, by application
13.2.2.5 Glycolic acid market, by region
14 APPENDIX (Page No. - 259)
14.1 DISCUSSION GUIDE
14.2 KNOWLEDGESTORE: MARKETSANDMARKETS’ SUBSCRIPTION PORTAL
14.3 CUSTOMIZATION OPTIONS
14.4 RELATED REPORTS
14.5 AUTHOR DETAILS
LIST OF TABLES (322 TABLES)
TABLE 1 HYDROCHLORIC ACID MARKET: PORTER’S FIVE FORCES ANALYSIS
TABLE 2 WORLD GDP GROWTH PROJECTION, 2019–2026 (USD BILLION)
TABLE 3 AVERAGE TARIFF, BY COUNTRY
TABLE 4 NORTH AMERICA: REGULATORY BODIES, GOVERNMENT AGENCIES, AND OTHER ORGANIZATIONS
TABLE 5 EUROPE: REGULATORY BODIES, GOVERNMENT AGENCIES, AND OTHER ORGANIZATIONS
TABLE 6 ASIA PACIFIC: REGULATORY BODIES, GOVERNMENT AGENCIES, AND OTHER ORGANIZATIONS
TABLE 7 MIDDLE EAST & AFRICA: REGULATORY BODIES, GOVERNMENT AGENCIES, AND OTHER ORGANIZATIONS
TABLE 8 SOUTH AMERICA: REGULATORY BODIES, GOVERNMENT AGENCIES, AND OTHER ORGANIZATIONS
TABLE 9 OLIN CORPORATION ADOPTED ADVANCED MEMBRANE CELL TECHNOLOGY IN CHEMICAL MANUFACTURING
TABLE 10 WESTLAKE CHEMICAL UTILIZED HYDROCHLORIC ACID IN PVC PRODUCTION
TABLE 11 BASF INCREASED CONSUMPTION OF HYDROCHLORIC ACID IN ENVIRONMENTAL APPLICATIONS
TABLE 12 HYDROCHLORIC ACID MARKET: KEY CONFERENCES & EVENTS, 2024–2025
TABLE 13 INFLUENCE OF STAKEHOLDERS ON BUYING PROCESS FOR TOP THREE END-USE INDUSTRIES (%)
TABLE 14 KEY BUYING CRITERIA FOR TOP 3 END-USE INDUSTRIES
TABLE 15 HYDROCHLORIC ACID MARKET ECOSYSTEM
TABLE 16 PATENTS IN HYDROCHLORIC ACID MARKET, 2022–2023
TABLE 17 AVERAGE SELLING PRICE TREND OF KEY PLAYERS, BY GRADE (USD/TON)
TABLE 18 AVERAGE SELLING PRICE TREND OF KEY PLAYERS, SYNTHETIC GRADE, BY REGION, 2023–2029 (USD/TON)
TABLE 19 AVERAGE SELLING PRICE TREND OF KEY PLAYERS, BY-PRODUCT GRADE, BY REGION, 2023–2029 (USD/TON)
TABLE 20 HYDROCHLORIC ACID MARKET, BY GRADE, 2020–2029 (USD MILLION)
TABLE 21 HYDROCHLORIC ACID MARKET, BY GRADE, 2020–2029 (KILOTON)
TABLE 22 SYNTHETIC GRADE: HYDROCHLORIC ACID MARKET, BY REGION, 2020–2029 (USD MILLION)
TABLE 23 SYNTHETIC GRADE: HYDROCHLORIC ACID MARKET, BY REGION, 2020–2029 (KILOTON)
TABLE 24 BY-PRODUCT GRADE: HYDROCHLORIC ACID MARKET, BY REGION, 2020–2029 (USD MILLION)
TABLE 25 BY-PRODUCT GRADE: HYDROCHLORIC ACID MARKET, BY REGION, 2020–2029 (KILOTON)
TABLE 26 HYDROCHLORIC ACID MARKET, BY APPLICATION, 2020–2029 (USD MILLION)
TABLE 27 HYDROCHLORIC ACID MARKET, BY APPLICATION, 2020–2029 (KILOTON)
TABLE 28 STEEL PICKLING: HYDROCHLORIC ACID MARKET, BY REGION, 2020–2029 (USD MILLION)
TABLE 29 STEEL PICKLING: HYDROCHLORIC ACID MARKET, BY REGION, 2020–2029 (KILOTON)
TABLE 30 OIL WELL ACIDIZING: HYDROCHLORIC ACID MARKET, BY REGION, 2020–2029 (USD MILLION)
TABLE 31 OIL WELL ACIDIZING: HYDROCHLORIC ACID MARKET, BY REGION, 2020–2029 (KILOTON)
TABLE 32 ORE PROCESSING: HYDROCHLORIC ACID MARKET, BY REGION, 2020–2029 (USD MILLION)
TABLE 33 ORE PROCESSING: HYDROCHLORIC ACID MARKET, BY REGION, 2020–2029 (KILOTON)
TABLE 34 FOOD PROCESSING: HYDROCHLORIC ACID MARKET, BY REGION, 2020–2029 (USD MILLION)
TABLE 35 FOOD PROCESSING: HYDROCHLORIC ACID MARKET, BY REGION, 2020–2029 (KILOTON)
TABLE 36 POOL SANITATION: HYDROCHLORIC ACID MARKET, BY REGION, 2020–2029 (USD MILLION)
TABLE 37 POOL SANITATION: HYDROCHLORIC ACID MARKET, BY REGION, 2020–2029 (KILOTON)
TABLE 38 CALCIUM CHLORIDE: HYDROCHLORIC ACID MARKET, BY REGION, 2020–2029 (USD MILLION)
TABLE 39 CALCIUM CHLORIDE: HYDROCHLORIC ACID MARKET, BY REGION, 2020–2029 (KILOTON)
TABLE 40 BIODIESEL: HYDROCHLORIC ACID MARKET, BY REGION, 2020–2029 (USD MILLION)
TABLE 41 BIODIESEL: HYDROCHLORIC ACID MARKET, BY REGION, 2020–2029 (KILOTON)
TABLE 42 OTHER APPLICATIONS: HYDROCHLORIC ACID MARKET, BY REGION, 2020–2029 (USD MILLION)
TABLE 43 OTHER APPLICATIONS: HYDROCHLORIC ACID MARKET, BY REGION, 2020–2029 (KILOTON)
TABLE 44 HYDROCHLORIC ACID MARKET, BY END-USE INDUSTRY, 2020–2029 (USD MILLION)
TABLE 45 HYDROCHLORIC ACID MARKET, BY END-USE INDUSTRY, 2020–2029 (KILOTON)
TABLE 46 FOOD & BEVERAGE: HYDROCHLORIC ACID MARKET, BY REGION, 2020–2029 (USD MILLION)
TABLE 47 FOOD & BEVERAGE: HYDROCHLORIC ACID MARKET, BY REGION, 2020–2029 (KILOTON)
TABLE 48 PHARMACEUTICAL: HYDROCHLORIC ACID MARKET, BY REGION, 2020–2029 (USD MILLION)
TABLE 49 PHARMACEUTICAL: HYDROCHLORIC ACID MARKET, BY REGION, 2020–2029 (KILOTON)
TABLE 50 TEXTILE: HYDROCHLORIC ACID MARKET, BY REGION, 2020–2029 (USD MILLION)
TABLE 51 TEXTILE: HYDROCHLORIC ACID MARKET, BY REGION, 2020–2029 (KILOTON)
TABLE 52 STEEL: HYDROCHLORIC ACID MARKET, BY REGION, 2020–2029 (USD MILLION)
TABLE 53 STEEL: HYDROCHLORIC ACID MARKET, BY REGION, 2020–2029 (KILOTON)
TABLE 54 OIL & GAS: HYDROCHLORIC ACID MARKET, BY REGION, 2020–2029 (USD MILLION)
TABLE 55 OIL & GAS: HYDROCHLORIC ACID MARKET, BY REGION, 2020–2029 (KILOTON)
TABLE 56 CHEMICAL: HYDROCHLORIC ACID MARKET, BY REGION, 2020–2029 (USD MILLION)
TABLE 57 CHEMICAL: HYDROCHLORIC ACID MARKET, BY REGION, 2020–2029 (KILOTON)
TABLE 58 OTHER END-USE INDUSTRIES: HYDROCHLORIC ACID MARKET, BY REGION, 2020–2029 (USD MILLION)
TABLE 59 OTHER END-USE INDUSTRIES: HYDROCHLORIC ACID MARKET, BY REGION, 2020–2029 (KILOTON)
TABLE 60 HYDROCHLORIC ACID MARKET, BY REGION, 2020–2029 (USD MILLION)
TABLE 61 HYDROCHLORIC ACID MARKET, BY REGION 2020–2029 (KILOTON)
TABLE 62 ASIA PACIFIC: HYDROCHLORIC ACID MARKET, BY COUNTRY, 2020–2029 (USD MILLION)
TABLE 63 ASIA PACIFIC: HYDROCHLORIC ACID MARKET, BY COUNTRY, 2020–2029 (KILOTON)
TABLE 64 ASIA PACIFIC: HYDROCHLORIC ACID MARKET, BY GRADE, 2020–2029 (USD MILLION)
TABLE 65 ASIA PACIFIC: HYDROCHLORIC ACID MARKET, BY GRADE, 2020–2029 (KILOTON)
TABLE 66 ASIA PACIFIC: HYDROCHLORIC ACID MARKET, BY APPLICATION, 2020–2029 (USD MILLION)
TABLE 67 ASIA PACIFIC: HYDROCHLORIC ACID MARKET, BY APPLICATION, 2020–2029 (KILOTON)
TABLE 68 ASIA PACIFIC: HYDROCHLORIC ACID MARKET, BY END-USE INDUSTRY, 2020–2029 (USD MILLION)
TABLE 69 ASIA PACIFIC: HYDROCHLORIC ACID MARKET, BY END-USE INDUSTRY, 2020–2029 (KILOTON)
TABLE 70 CHINA: HYDROCHLORIC ACID MARKET, BY GRADE, 2020–2029 (USD MILLION)
TABLE 71 CHINA: HYDROCHLORIC ACID MARKET, BY GRADE, 2020–2029 (KILOTON)
TABLE 72 CHINA: HYDROCHLORIC ACID MARKET, BY APPLICATION, 2020–2029 (USD MILLION)
TABLE 73 CHINA: HYDROCHLORIC ACID MARKET, BY APPLICATION, 2020–2029 (KILOTON)
TABLE 74 CHINA: HYDROCHLORIC ACID MARKET, BY END-USE INDUSTRY, 2020–2029 (USD MILLION)
TABLE 75 CHINA: HYDROCHLORIC ACID MARKET, BY END-USE INDUSTRY, 2020–2029 (KILOTON)
TABLE 76 INDIA: HYDROCHLORIC ACID MARKET, BY GRADE, 2020–2029 (USD MILLION)
TABLE 77 INDIA: HYDROCHLORIC ACID MARKET, BY GRADE, 2020–2029 (KILOTON)
TABLE 78 INDIA: HYDROCHLORIC ACID MARKET, BY APPLICATION, 2020–2029 (USD MILLION)
TABLE 79 INDIA: HYDROCHLORIC ACID MARKET, BY APPLICATION, 2020–2029 (KILOTON)
TABLE 80 INDIA: HYDROCHLORIC ACID MARKET, BY END-USE INDUSTRY, 2020–2029 (USD MILLION)
TABLE 81 INDIA: HYDROCHLORIC ACID MARKET, BY END-USE INDUSTRY, 2020–2029 (KILOTON)
TABLE 82 JAPAN: HYDROCHLORIC ACID MARKET, BY GRADE, 2020–2029 (USD MILLION)
TABLE 83 JAPAN: HYDROCHLORIC ACID MARKET, BY GRADE, 2020–2029 (KILOTON)
TABLE 84 JAPAN: HYDROCHLORIC ACID MARKET, BY APPLICATION, 2020–2029 (USD MILLION)
TABLE 85 JAPAN: HYDROCHLORIC ACID MARKET, BY APPLICATION, 2020–2029 (KILOTON)
TABLE 86 JAPAN: HYDROCHLORIC ACID MARKET, BY END-USE INDUSTRY, 2020–2029 (USD MILLION)
TABLE 87 JAPAN: HYDROCHLORIC ACID MARKET, BY END-USE INDUSTRY, 2020–2029 (KILOTON)
TABLE 88 SOUTH KOREA: HYDROCHLORIC ACID MARKET, BY GRADE, 2020–2029 (USD MILLION)
TABLE 89 SOUTH KOREA: HYDROCHLORIC ACID MARKET, BY GRADE, 2020–2029 (KILOTON)
TABLE 90 SOUTH KOREA: HYDROCHLORIC ACID MARKET, BY APPLICATION, 2020–2029 (USD MILLION)
TABLE 91 SOUTH KOREA: HYDROCHLORIC ACID MARKET, BY APPLICATION, 2020–2029 (KILOTON)
TABLE 92 SOUTH KOREA: HYDROCHLORIC ACID MARKET, BY END-USE INDUSTRY, 2020–2029 (USD MILLION)
TABLE 93 SOUTH KOREA: HYDROCHLORIC ACID MARKET, BY END-USE INDUSTRY, 2020–2029 (KILOTON)
TABLE 94 REST OF ASIA PACIFIC: HYDROCHLORIC ACID MARKET, BY GRADE, 2020–2029 (USD MILLION)
TABLE 95 REST OF ASIA PACIFIC: HYDROCHLORIC ACID MARKET, BY GRADE, 2020–2029 (KILOTON)
TABLE 96 REST OF ASIA PACIFIC: HYDROCHLORIC ACID MARKET, BY APPLICATION, 2020–2029 (USD MILLION)
TABLE 97 REST OF ASIA PACIFIC: HYDROCHLORIC ACID MARKET, BY APPLICATION, 2020–2029 (KILOTON)
TABLE 98 REST OF ASIA PACIFIC: HYDROCHLORIC ACID MARKET, BY END-USE INDUSTRY, 2020–2029 (USD MILLION)
TABLE 99 REST OF ASIA PACIFIC: HYDROCHLORIC ACID MARKET, BY END-USE INDUSTRY, 2020–2029 (KILOTON)
TABLE 100 EUROPE: HYDROCHLORIC ACID MARKET, BY COUNTRY, 2020–2029 (USD MILLION)
TABLE 101 EUROPE: HYDROCHLORIC ACID MARKET, BY COUNTRY, 2020–2029 (KILOTON)
TABLE 102 EUROPE: HYDROCHLORIC ACID MARKET, BY GRADE, 2020–2029 (USD MILLION)
TABLE 103 EUROPE: HYDROCHLORIC ACID MARKET, BY GRADE, 2020–2029 (KILOTON)
TABLE 104 EUROPE: HYDROCHLORIC ACID MARKET, BY APPLICATION, 2020–2029 (USD MILLION)
TABLE 105 EUROPE: HYDROCHLORIC ACID MARKET, BY APPLICATION, 2020–2029 (KILOTON)
TABLE 106 EUROPE: HYDROCHLORIC ACID MARKET, BY END-USE INDUSTRY, 2020–2029 (USD MILLION)
TABLE 107 EUROPE: HYDROCHLORIC ACID MARKET, BY END-USE INDUSTRY, 2020–2029 (KILOTON)
TABLE 108 GERMANY: HYDROCHLORIC ACID MARKET, BY GRADE, 2020–2029 (USD MILLION)
TABLE 109 GERMANY: HYDROCHLORIC ACID MARKET, BY GRADE, 2020–2029 (KILOTON)
TABLE 110 GERMANY: HYDROCHLORIC ACID MARKET, BY APPLICATION, 2020–2029 (USD MILLION)
TABLE 111 GERMANY: HYDROCHLORIC ACID MARKET, BY APPLICATION, 2020–2029 (KILOTON)
TABLE 112 GERMANY: HYDROCHLORIC ACID MARKET, BY END-USE INDUSTRY, 2020–2029 (USD MILLION)
TABLE 113 GERMANY: HYDROCHLORIC ACID MARKET, BY END-USE INDUSTRY, 2020–2029 (KILOTON)
TABLE 114 FRANCE: HYDROCHLORIC ACID MARKET, BY GRADE, 2020–2029 (USD MILLION)
TABLE 115 FRANCE: HYDROCHLORIC ACID MARKET, BY GRADE, 2020–2029 (KILOTON)
TABLE 116 FRANCE: HYDROCHLORIC ACID MARKET, BY APPLICATION, 2020–2029 (USD MILLION)
TABLE 117 FRANCE: HYDROCHLORIC ACID MARKET, BY APPLICATION, 2020–2029 (KILOTON)
TABLE 118 FRANCE: HYDROCHLORIC ACID MARKET, BY END-USE INDUSTRY, 2020–2029 (USD MILLION)
TABLE 119 FRANCE: HYDROCHLORIC ACID MARKET, BY END-USE INDUSTRY, 2020–2029 (KILOTON)
TABLE 120 ITALY: HYDROCHLORIC ACID MARKET, BY GRADE, 2020–2029 (USD MILLION)
TABLE 121 ITALY: HYDROCHLORIC ACID MARKET, BY GRADE, 2020–2029 (KILOTON)
TABLE 122 ITALY: HYDROCHLORIC ACID MARKET, BY APPLICATION, 2020–2029 (USD MILLION)
TABLE 123 ITALY: HYDROCHLORIC ACID MARKET, BY APPLICATION, 2020–2029 (KILOTON)
TABLE 124 ITALY: HYDROCHLORIC ACID MARKET, BY END-USE INDUSTRY, 2020–2029 (USD MILLION)
TABLE 125 ITALY: HYDROCHLORIC ACID MARKET, BY END-USE INDUSTRY, 2020–2029 (KILOTON)
TABLE 126 UK: HYDROCHLORIC ACID MARKET, BY GRADE, 2020–2029 (USD MILLION)
TABLE 127 UK: HYDROCHLORIC ACID MARKET, BY GRADE, 2020–2029 (KILOTON)
TABLE 128 UK: HYDROCHLORIC ACID MARKET, BY APPLICATION, 2020–2029 (USD MILLION)
TABLE 129 UK: HYDROCHLORIC ACID MARKET, BY APPLICATION, 2020–2029 (KILOTON)
TABLE 130 UK: HYDROCHLORIC ACID MARKET, BY END-USE INDUSTRY, 2020–2029 (USD MILLION)
TABLE 131 UK: HYDROCHLORIC ACID MARKET, BY END-USE INDUSTRY, 2020–2029 (KILOTON)
TABLE 132 SPAIN: HYDROCHLORIC ACID MARKET, BY GRADE, 2020–2029 (USD MILLION)
TABLE 133 SPAIN: HYDROCHLORIC ACID MARKET, BY GRADE, 2020–2029 (KILOTON)
TABLE 134 SPAIN: HYDROCHLORIC ACID MARKET, BY APPLICATION, 2020–2029 (USD MILLION)
TABLE 135 SPAIN: HYDROCHLORIC ACID MARKET, BY APPLICATION, 2020–2029 (KILOTON)
TABLE 136 SPAIN: HYDROCHLORIC ACID MARKET, BY END-USE INDUSTRY, 2020–2029 (USD MILLION)
TABLE 137 SPAIN: HYDROCHLORIC ACID MARKET, BY END-USE INDUSTRY, 2020–2029 (KILOTON)
TABLE 138 REST OF EUROPE: HYDROCHLORIC ACID MARKET, BY GRADE, 2020–2029 (USD MILLION)
TABLE 139 REST OF EUROPE: HYDROCHLORIC ACID MARKET, BY GRADE, 2020–2029 (KILOTON)
TABLE 140 REST OF EUROPE: HYDROCHLORIC ACID MARKET, BY APPLICATION, 2020–2029 (USD MILLION)
TABLE 141 REST OF EUROPE: HYDROCHLORIC ACID MARKET, BY APPLICATION, 2020–2029 (KILOTON)
TABLE 142 REST OF EUROPE: HYDROCHLORIC ACID MARKET, BY END-USE INDUSTRY, 2020–2029 (USD MILLION)
TABLE 143 REST OF EUROPE: HYDROCHLORIC ACID MARKET, BY END-USE INDUSTRY, 2020–2029 (KILOTON)
TABLE 144 MIDDLE EAST & AFRICA: HYDROCHLORIC ACID MARKET, BY COUNTRY, 2020–2029 (USD MILLION)
TABLE 145 MIDDLE EAST & AFRICA: HYDROCHLORIC ACID MARKET, BY COUNTRY, 2020–2029 (KILOTON)
TABLE 146 MIDDLE EAST & AFRICA: HYDROCHLORIC ACID MARKET, BY GRADE, 2020–2029 (USD MILLION)
TABLE 147 MIDDLE EAST & AFRICA: HYDROCHLORIC ACID MARKET, BY GRADE, 2020–2029 (KILOTON)
TABLE 148 MIDDLE EAST & AFRICA: HYDROCHLORIC ACID MARKET, BY APPLICATION, 2020–2029 (USD MILLION)
TABLE 149 MIDDLE EAST & AFRICA: HYDROCHLORIC ACID MARKET, BY APPLICATION, 2020–2029 (KILOTON)
TABLE 150 MIDDLE EAST & AFRICA: HYDROCHLORIC ACID MARKET, BY END-USE INDUSTRY, 2020–2029 (USD MILLION)
TABLE 151 MIDDLE EAST & AFRICA: HYDROCHLORIC ACID MARKET, BY END-USE INDUSTRY, 2020–2029 (KILOTON)
TABLE 152 SAUDI ARABIA: HYDROCHLORIC ACID MARKET, BY GRADE, 2020–2029 (USD MILLION)
TABLE 153 SAUDI ARABIA: HYDROCHLORIC ACID MARKET, BY GRADE, 2020–2029 (KILOTON)
TABLE 154 SAUDI ARABIA: HYDROCHLORIC ACID MARKET, BY APPLICATION, 2020–2029 (USD MILLION)
TABLE 155 SAUDI ARABIA: HYDROCHLORIC ACID MARKET, BY APPLICATION, 2020–2029 (KILOTON)
TABLE 156 SAUDI ARABIA: HYDROCHLORIC ACID MARKET, BY END-USE INDUSTRY, 2020–2029 (USD MILLION)
TABLE 157 SAUDI ARABIA: HYDROCHLORIC ACID MARKET, BY END-USE INDUSTRY, 2020–2029 (KILOTON)
TABLE 158 UAE: HYDROCHLORIC ACID MARKET, BY GRADE, 2020–2029 (USD MILLION)
TABLE 159 UAE: HYDROCHLORIC ACID MARKET, BY GRADE, 2020–2029 (KILOTON)
TABLE 160 UAE: HYDROCHLORIC ACID MARKET, BY APPLICATION, 2020–2029 (USD MILLION)
TABLE 161 UAE: HYDROCHLORIC ACID MARKET, BY APPLICATION, 2020–2029 (KILOTON)
TABLE 162 UAE: HYDROCHLORIC ACID MARKET, BY END-USE INDUSTRY, 2020–2029 (USD MILLION)
TABLE 163 UAE: HYDROCHLORIC ACID MARKET, BY END-USE INDUSTRY, 2020–2029 (KILOTON)
TABLE 164 REST OF GCC COUNTRIES: HYDROCHLORIC ACID MARKET, BY GRADE, 2020–2029 (USD MILLION)
TABLE 165 REST OF GCC COUNTRIES: HYDROCHLORIC ACID MARKET, BY GRADE, 2020–2029 (KILOTON)
TABLE 166 REST OF GCC COUNTRIES: HYDROCHLORIC ACID MARKET, BY APPLICATION, 2020–2029 (USD MILLION)
TABLE 167 REST OF GCC COUNTRIES: HYDROCHLORIC ACID MARKET, BY APPLICATION, 2020–2029 (KILOTON)
TABLE 168 REST OF GCC COUNTRIES: HYDROCHLORIC ACID MARKET, BY END-USE INDUSTRY, 2020–2029 (USD MILLION)
TABLE 169 REST OF GCC COUNTRIES: HYDROCHLORIC ACID MARKET, BY END-USE INDUSTRY, 2020–2029 (KILOTON)
TABLE 170 SOUTH AFRICA: HYDROCHLORIC ACID MARKET, BY GRADE, 2020–2029 (USD MILLION)
TABLE 171 SOUTH AFRICA: HYDROCHLORIC ACID MARKET, BY GRADE, 2020–2029 (KILOTON)
TABLE 172 SOUTH AFRICA: HYDROCHLORIC ACID MARKET, BY APPLICATION, 2020–2029 (USD MILLION)
TABLE 173 SOUTH AFRICA: HYDROCHLORIC ACID MARKET, BY APPLICATION, 2020–2029 (KILOTON)
TABLE 174 SOUTH AFRICA: HYDROCHLORIC ACID MARKET, BY END-USE INDUSTRY, 2020–2029 (USD MILLION)
TABLE 175 SOUTH AFRICA: HYDROCHLORIC ACID MARKET, BY END-USE INDUSTRY, 2020–2029 (KILOTON)
TABLE 176 IRAN: HYDROCHLORIC ACID MARKET, BY GRADE, 2020–2029 (USD MILLION)
TABLE 177 IRAN: HYDROCHLORIC ACID MARKET, BY GRADE, 2020–2029 (KILOTON)
TABLE 178 IRAN: HYDROCHLORIC ACID MARKET, BY APPLICATION, 2020–2029 (USD MILLION)
TABLE 179 IRAN: HYDROCHLORIC ACID MARKET, BY APPLICATION, 2020–2029 (KILOTON)
TABLE 180 IRAN: HYDROCHLORIC ACID MARKET, BY END-USE INDUSTRY, 2020–2029 (USD MILLION)
TABLE 181 IRAN: HYDROCHLORIC ACID MARKET, BY END-USE INDUSTRY, 2020–2029 (KILOTON)
TABLE 182 MOROCCO: HYDROCHLORIC ACID MARKET, BY GRADE, 2020–2029 (USD MILLION)
TABLE 183 MOROCCO: HYDROCHLORIC ACID MARKET, BY GRADE, 2020–2029 (KILOTON)
TABLE 184 MOROCCO: HYDROCHLORIC ACID MARKET, BY APPLICATION, 2020–2029 (USD MILLION)
TABLE 185 MOROCCO: HYDROCHLORIC ACID MARKET, BY APPLICATION, 2020–2029 (KILOTON)
TABLE 186 MOROCCO: HYDROCHLORIC ACID MARKET, BY END-USE INDUSTRY, 2020–2029 (USD MILLION)
TABLE 187 MOROCCO: HYDROCHLORIC ACID MARKET, BY END-USE INDUSTRY, 2020–2029 (KILOTON)
TABLE 188 REST OF MIDDLE EAST & AFRICA: HYDROCHLORIC ACID MARKET, BY GRADE, 2020–2029 (USD MILLION)
TABLE 189 REST OF MIDDLE EAST & AFRICA: HYDROCHLORIC ACID MARKET, BY GRADE, 2020–2029 (KILOTON)
TABLE 190 REST OF MIDDLE EAST & AFRICA: HYDROCHLORIC ACID MARKET, BY APPLICATION, 2020–2029 (USD MILLION)
TABLE 191 REST OF MIDDLE EAST & AFRICA: HYDROCHLORIC ACID MARKET, BY APPLICATION, 2020–2029 (KILOTON)
TABLE 192 REST OF MIDDLE EAST & AFRICA: HYDROCHLORIC ACID MARKET, BY END-USE INDUSTRY, 2020–2029 (USD MILLION)
TABLE 193 REST OF MIDDLE EAST & AFRICA: HYDROCHLORIC ACID MARKET, BY END-USE INDUSTRY, 2020–2029 (KILOTON)
TABLE 194 NORTH AMERICA: HYDROCHLORIC ACID MARKET, BY COUNTRY, 2020–2029 (USD MILLION)
TABLE 195 NORTH AMERICA: HYDROCHLORIC ACID MARKET, BY COUNTRY, 2020–2029 (KILOTON)
TABLE 196 NORTH AMERICA: HYDROCHLORIC ACID MARKET, BY GRADE, 2020–2029 (USD MILLION)
TABLE 197 NORTH AMERICA: HYDROCHLORIC ACID MARKET, BY GRADE, 2020–2029 (KILOTON)
TABLE 198 NORTH AMERICA: HYDROCHLORIC ACID MARKET, BY APPLICATION, 2020–2029 (USD MILLION)
TABLE 199 NORTH AMERICA: HYDROCHLORIC ACID MARKET, BY APPLICATION, 2020–2029 (KILOTON)
TABLE 200 NORTH AMERICA: HYDROCHLORIC ACID MARKET, BY END-USE INDUSTRY, 2020–2029 (USD MILLION)
TABLE 201 NORTH AMERICA: HYDROCHLORIC ACID MARKET, BY END-USE INDUSTRY, 2020–2029 (KILOTON)
TABLE 202 US: HYDROCHLORIC ACID MARKET, BY GRADE, 2020–2029 (USD MILLION)
TABLE 203 US: HYDROCHLORIC ACID MARKET, BY GRADE, 2020–2029 (KILOTON)
TABLE 204 US: HYDROCHLORIC ACID MARKET, BY APPLICATION, 2020–2029 (USD MILLION)
TABLE 205 US: HYDROCHLORIC ACID MARKET, BY APPLICATION, 2020–2029 (KILOTON)
TABLE 206 US: HYDROCHLORIC ACID MARKET, BY END-USE INDUSTRY, 2020–2029 (USD MILLION)
TABLE 207 US: HYDROCHLORIC ACID MARKET, BY END-USE INDUSTRY, 2020–2029 (KILOTON)
TABLE 208 CANADA: HYDROCHLORIC ACID MARKET, BY GRADE, 2020–2029 (USD MILLION)
TABLE 209 CANADA: HYDROCHLORIC ACID MARKET, BY GRADE, 2020–2029 (KILOTON)
TABLE 210 CANADA: HYDROCHLORIC ACID MARKET, BY APPLICATION, 2020–2029 (USD MILLION)
TABLE 211 CANADA: HYDROCHLORIC ACID MARKET, BY APPLICATION, 2020–2029 (KILOTON)
TABLE 212 CANADA: HYDROCHLORIC ACID MARKET, BY END-USE INDUSTRY, 2020–2029 (USD MILLION)
TABLE 213 CANADA: HYDROCHLORIC ACID MARKET, BY END-USE INDUSTRY, 2020–2029 (KILOTON)
TABLE 214 MEXICO: HYDROCHLORIC ACID MARKET, BY GRADE, 2020–2029 (USD MILLION)
TABLE 215 MEXICO: HYDROCHLORIC ACID MARKET, BY GRADE, 2020–2029 (KILOTON)
TABLE 216 MEXICO: HYDROCHLORIC ACID MARKET, BY APPLICATION, 2020–2029 (USD MILLION)
TABLE 217 MEXICO: HYDROCHLORIC ACID MARKET, BY APPLICATION, 2020–2029 (KILOTON)
TABLE 218 MEXICO: HYDROCHLORIC ACID MARKET, BY END-USE INDUSTRY, 2020–2029 (USD MILLION)
TABLE 219 MEXICO: HYDROCHLORIC ACID MARKET, BY END-USE INDUSTRY, 2020–2029 (KILOTON)
TABLE 220 SOUTH AMERICA: HYDROCHLORIC ACID MARKET, BY COUNTRY, 2020–2029 (USD MILLION)
TABLE 221 SOUTH AMERICA: HYDROCHLORIC ACID MARKET, BY COUNTRY, 2020–2029 (KILOTON)
TABLE 222 SOUTH AMERICA: HYDROCHLORIC ACID MARKET, BY GRADE, 2020–2029 (USD MILLION)
TABLE 223 SOUTH AMERICA: HYDROCHLORIC ACID MARKET, BY GRADE, 2020–2029 (KILOTON)
TABLE 224 SOUTH AMERICA: HYDROCHLORIC ACID MARKET, BY APPLICATION, 2020–2029 (USD MILLION)
TABLE 225 SOUTH AMERICA: HYDROCHLORIC ACID MARKET, BY APPLICATION, 2020–2029 (KILOTON)
TABLE 226 SOUTH AMERICA: HYDROCHLORIC ACID MARKET, BY END-USE INDUSTRY, 2020–2029 (USD MILLION)
TABLE 227 SOUTH AMERICA: HYDROCHLORIC ACID MARKET, BY END-USE INDUSTRY, 2020–2029 (KILOTON)
TABLE 228 BRAZIL: HYDROCHLORIC ACID MARKET, BY GRADE, 2020–2029 (USD MILLION)
TABLE 229 BRAZIL: HYDROCHLORIC ACID MARKET, BY GRADE, 2020–2029 (KILOTON)
TABLE 230 BRAZIL: HYDROCHLORIC ACID MARKET, BY APPLICATION, 2020–2029 (USD MILLION)
TABLE 231 BRAZIL: HYDROCHLORIC ACID MARKET, BY APPLICATION, 2020–2029 (KILOTON)
TABLE 232 BRAZIL: HYDROCHLORIC ACID MARKET, BY END-USE INDUSTRY, 2020–2029 (USD MILLION)
TABLE 233 BRAZIL: HYDROCHLORIC ACID MARKET, BY END-USE INDUSTRY, 2020–2029 (KILOTON)
TABLE 234 ARGENTINA: HYDROCHLORIC ACID MARKET, BY GRADE, 2020–2029 (USD MILLION)
TABLE 235 ARGENTINA: HYDROCHLORIC ACID MARKET, BY GRADE, 2020–2029 (KILOTON)
TABLE 236 ARGENTINA: HYDROCHLORIC ACID MARKET, BY APPLICATION, 2020–2029 (USD MILLION)
TABLE 237 ARGENTINA: HYDROCHLORIC ACID MARKET, BY APPLICATION, 2020–2029 (KILOTON)
TABLE 238 ARGENTINA: HYDROCHLORIC ACID MARKET, BY END-USE INDUSTRY, 2020–2029 (USD MILLION)
TABLE 239 ARGENTINA: HYDROCHLORIC ACID MARKET, BY END-USE INDUSTRY, 2020–2029 (KILOTON)
TABLE 240 REST OF SOUTH AMERICA: HYDROCHLORIC ACID MARKET, BY GRADE, 2020–2029 (USD MILLION)
TABLE 241 REST OF SOUTH AMERICA: HYDROCHLORIC ACID MARKET, BY GRADE, 2020–2029 (KILOTON)
TABLE 242 REST OF SOUTH AMERICA: HYDROCHLORIC ACID MARKET, BY APPLICATION, 2020–2029 (USD MILLION)
TABLE 243 REST OF SOUTH AMERICA: HYDROCHLORIC ACID MARKET, BY APPLICATION, 2020–2029 (KILOTON)
TABLE 244 REST OF SOUTH AMERICA: HYDROCHLORIC ACID MARKET, BY END-USE INDUSTRY, 2020–2029 (USD MILLION)
TABLE 245 REST OF SOUTH AMERICA: HYDROCHLORIC ACID MARKET, BY END-USE INDUSTRY, 2020–2029 (KILOTON)
TABLE 246 OVERVIEW OF STRATEGIES ADOPTED BY KEY PLAYERS IN HYDROCHLORIC ACID MARKET
TABLE 247 HYDROCHLORIC ACID MARKET: DEGREE OF COMPETITION
TABLE 248 HYDROCHLORIC ACID MARKET: GRADE FOOTPRINT (10 COMPANIES)
TABLE 249 HYDROCHLORIC ACID MARKET: APPLICATION FOOTPRINT (10 COMPANIES)
TABLE 250 HYDROCHLORIC ACID MARKET: END-USE INDUSTRY FOOTPRINT (10 COMPANIES)
TABLE 251 HYDROCHLORIC ACID MARKET: REGION FOOTPRINT (10 COMPANIES)
TABLE 252 HYDROCHLORIC ACID MARKET: KEY STARTUPS/SMES
TABLE 253 HYDROCHLORIC ACID MARKET: COMPETITIVE BENCHMARKING OF KEY STARTUPS/SMES (15 COMPANIES)
TABLE 254 HYDROCHLORIC ACID MARKET: DEALS, JANUARY 2018–MAY 2024
TABLE 255 HYDROCHLORIC ACID MARKET: EXPANSIONS, JANUARY 2018–MAY 2024
TABLE 256 HYDROCHLORIC ACID MARKET: OTHER DEVELOPMENTS, JANUARY 2018–MAY 2024
TABLE 257 BASF SE: COMPANY OVERVIEW
TABLE 258 BASF SE: PRODUCTS/SOLUTIONS/SERVICES OFFERED
TABLE 259 BASF SE: OTHER DEVELOPMENTS, JANUARY 2018−MAY 2024
TABLE 260 COVESTRO AG: COMPANY OVERVIEW
TABLE 261 COVESTRO AG: PRODUCTS/SOLUTIONS/SERVICES OFFERED
TABLE 262 OLIN CORPORATION: COMPANY OVERVIEW
TABLE 263 OLIN CORPORATION: PRODUCTS/SOLUTIONS/SERVICES OFFERED
TABLE 264 OLIN CORPORATION: DEALS, JANUARY 2018−MAY 2024
TABLE 265 WESTLAKE CORPORATION: COMPANY OVERVIEW
TABLE 266 WESTLAKE CORPORATION: PRODUCTS/SOLUTIONS/SERVICES OFFERED
TABLE 267 WESTLAKE CORPORATION: DEALS, JANUARY 2018−MAY 2024
TABLE 268 WESTLAKE CORPORATION: EXPANSIONS, JANUARY 2018−MAY 2024
TABLE 269 OCCIDENTAL PETROLEUM CORPORATION: COMPANY OVERVIEW
TABLE 270 OCCIDENTAL PETROLEUM CORPORATION: PRODUCTS/SOLUTIONS/SERVICES OFFERED
TABLE 271 FORMOSA PLASTICS CORPORATION: COMPANY OVERVIEW
TABLE 272 FORMOSA PLASTICS CORPORATION: PRODUCTS/SOLUTIONS/SERVICES OFFERED
TABLE 273 TATA CHEMICALS LIMITED: COMPANY OVERVIEW
TABLE 274 TATA CHEMICALS LIMITED: PRODUCTS/SOLUTIONS/SERVICES OFFERED
TABLE 275 TATA CHEMICAL LIMITED: DEALS, JANUARY 2018–APRIL 2024
TABLE 276 AGC INC.: COMPANY OVERVIEW
TABLE 277 AGC INC.: PRODUCTS/SOLUTIONS/SERVICES OFFERED
TABLE 278 ERCO WORLDWIDE: COMPANY OVERVIEW
TABLE 279 ERCO WORLDWIDE: PRODUCTS/SOLUTIONS/SERVICES OFFERED
TABLE 280 DETREX CORPORATION: COMPANY OVERVIEW
TABLE 281 DETREX CORPORATION: PRODUCTS/SOLUTIONS/SERVICES OFFERED
TABLE 282 AURORA FINE CHEMICALS: COMPANY OVERVIEW
TABLE 283 ZOUPING DONGFANG CHEMICAL INDUSTRY CO., LTD.: COMPANY OVERVIEW
TABLE 284 ACURO ORGANICS LIMITED: COMPANY OVERVIEW
TABLE 285 MAXWELL ADDITIVES PVT. LTD.: COMPANY OVERVIEW
TABLE 286 CHEMTEX SPECIALITY LIMITED: COMPANY OVERVIEW
TABLE 287 POLYSCIENCES INC.: COMPANY OVERVIEW
TABLE 288 INEOS KOH: COMPANY OVERVIEW
TABLE 289 NOURYON: COMPANY OVERVIEW
TABLE 290 CONTINENTAL CHEMICAL USA: COMPANY OVERVIEW
TABLE 291 JONES-HAMILTON CO.: COMPANY OVERVIEW
TABLE 292 TRONOX HOLDINGS PLC: COMPANY OVERVIEW
TABLE 293 KUHLMANN EUROPE: COMPANY OVERVIEW
TABLE 294 PCC GROUP: COMPANY OVERVIEW
TABLE 295 HAWKINS: COMPANY OVERVIEW
TABLE 296 HYDRITE CHEMICAL: COMPANY OVERVIEW
TABLE 297 POLYLACTIC ACID MARKET, BY APPLICATION, 2019–2022 (USD MILLION)
TABLE 298 POLYLACTIC ACID MARKET, BY APPLICATION, 2023–2028 (USD MILLION)
TABLE 299 POLYLACTIC ACID MARKET, BY APPLICATION, 2019–2022 (KILOTON)
TABLE 300 POLYLACTIC ACID MARKET, BY APPLICATION, 2023–2028 (KILOTON)
TABLE 301 POLYLACTIC ACID MARKET, BY END-USE INDUSTRY, 2019–2022 (USD MILLION)
TABLE 302 POLYLACTIC ACID MARKET, BY END-USE INDUSTRY, 2023–2028 (USD MILLION)
TABLE 303 POLYLACTIC ACID MARKET, BY END-USE INDUSTRY, 2019–2022 (KILOTON)
TABLE 304 POLYLACTIC ACID MARKET, BY END-USE INDUSTRY, 2023–2028 (KILOTON)
TABLE 305 POLYLACTIC ACID MARKET, BY GRADE, 2019–2022 (USD MILLION)
TABLE 306 POLYLACTIC ACID MARKET, BY GRADE, 2023–2028 (USD MILLION)
TABLE 307 POLYLACTIC ACID MARKET, BY GRADE, 2019–2022 (KILOTON)
TABLE 308 POLYLACTIC ACID MARKET, BY GRADE, 2023–2028 (KILOTON)
TABLE 309 POLYLACTIC ACID MARKET, BY REGION, 2019–2022 (USD MILLION)
TABLE 310 POLYLACTIC ACID MARKET, BY REGION, 2023–2028 (USD MILLION)
TABLE 311 POLYLACTIC ACID MARKET, BY REGION, 2019–2022 (KILOTON)
TABLE 312 POLYLACTIC ACID MARKET, BY REGION, 2023–2028 (KILOTON)
TABLE 313 GLYCOLIC ACID MARKET, BY GRADE, 2016–2019 (USD MILLION)
TABLE 314 GLYCOLIC ACID MARKET, BY GRADE, 2016–2019 (KILOTON)
TABLE 315 GLYCOLIC ACID MARKET, BY GRADE, 2020–2027 (USD MILLION)
TABLE 316 GLYCOLIC ACID MARKET, BY GRADE, 2020–2027 (KILOTON)
TABLE 317 GLYCOLIC ACID MARKET, BY APPLICATION, 2016–2019 (USD MILLION)
TABLE 318 GLYCOLIC ACID MARKET, BY APPLICATION, 2016–2019 (KILOTON)
TABLE 319 GLYCOLIC ACID MARKET, BY APPLICATION, 2020–2027 (USD MILLION)
TABLE 320 GLYCOLIC ACID MARKET, BY APPLICATION, 2020–2027 (KILOTON)
TABLE 321 GLYCOLIC ACID MARKET, BY REGION, 2020–2027 (USD MILLION)
TABLE 322 GLYCOLIC ACID MARKET, BY REGION, 2020–2027 (KILOTON)
LIST OF FIGURES (53 FIGURES)
FIGURE 1 HYDROCHLORIC ACID MARKET SEGMENTATION
FIGURE 2 HYDROCHLORIC ACID MARKET: RESEARCH DESIGN
FIGURE 3 MARKET SIZE ESTIMATION METHODOLOGY: BOTTOM-UP APPROACH
FIGURE 4 MARKET SIZE ESTIMATION METHODOLOGY: TOP-DOWN APPROACH
FIGURE 5 APPROACH: BASED ON PRODUCTION OF HYDROCHLORIC ACID IN CHINA
FIGURE 6 HYDROCHLORIC ACID MARKET: DATA TRIANGULATION
FIGURE 7 SYNTHETIC GRADE SEGMENT TO REGISTER HIGHER CAGR DURING FORECAST PERIOD
FIGURE 8 FOOD PROCESSING SEGMENT TO RECORD HIGHEST GROWTH DURING FORECAST PERIOD
FIGURE 9 FOOD & BEVERAGE TO BE LARGEST END-USE INDUSTRY OF HYDROCHLORIC ACID
FIGURE 10 ASIA PACIFIC TO LEAD HYDROCHLORIC ACID MARKET DURING FORECAST PERIOD
FIGURE 11 EMERGING ECONOMIES OFFER ATTRACTIVE OPPORTUNITIES IN HYDROCHLORIC ACID MARKET
FIGURE 12 CHINA DOMINATED HYDROCHLORIC ACID MARKET IN 2023
FIGURE 13 SYNTHETIC GRADE SEGMENT TO RECORD HIGHER CAGR DURING FORECAST PERIOD
FIGURE 14 FOOD PROCESSING TO RECORD HIGHER GROWTH DURING FORECAST PERIOD
FIGURE 15 FOOD & BEVERAGE SEGMENT TO ACCOUNT FOR LARGEST SHARE DURING FORECAST PERIOD
FIGURE 16 CHINA PROJECTED TO GROW AT HIGHEST CAGR FROM 2024 TO 2029
FIGURE 17 HYDROCHLORIC ACID MARKET: DRIVERS, RESTRAINTS, OPPORTUNITIES, AND CHALLENGES
FIGURE 18 HYDROCHLORIC ACID MARKET: PORTER’S FIVE FORCES ANALYSIS
FIGURE 19 HYDROCHLORIC ACID: VALUE CHAIN ANALYSIS
FIGURE 20 EXPORT OF 280610 HYDROGEN CHLORIDE “HYDROCHLORIC ACID,” BY KEY COUNTRY, 2019–2023
FIGURE 21 IMPORT OF 280610 HYDROGEN CHLORIDE “HYDROCHLORIC ACID,” BY KEY COUNTRY, 2019–2023
FIGURE 22 EMERGING TRENDS AND ADVANCEMENTS IN TECHNOLOGY TO CHANGE FUTURE REVENUE MIX OF SUPPLIERS
FIGURE 23 INFLUENCE OF STAKEHOLDERS ON BUYING PROCESS FOR TOP THREE END-USE INDUSTRIES
FIGURE 24 KEY BUYING CRITERIA FOR TOP 3 END-USE INDUSTRIES
FIGURE 25 HYDROCHLORIC ACID MARKET: ECOSYSTEM MAP
FIGURE 26 NUMBER OF PATENTS GRANTED FOR HYDROCHLORIC ACID, 2013–2023
FIGURE 27 REGIONAL ANALYSIS OF PATENTS GRANTED FOR HYDROCHLORIC ACID, 2013–2023
FIGURE 28 HYDROCHLORIC ACID MARKET: AVERAGE SELLING PRICE, SYNTHETIC GRADE, BY REGION (USD/TON)
FIGURE 29 HYDROCHLORIC ACID MARKET: AVERAGE SELLING PRICE, BY-PRODUCT GRADE, BY REGION (USD/TON)
FIGURE 30 INVESTOR DEALS AND FUNDING IN HYDROCHLORIC ACID SOARED IN 2022
FIGURE 31 BY-PRODUCT GRADE TO ACCOUNT FOR LARGER MARKET SHARE DURING FORECAST PERIOD
FIGURE 32 FOOD PROCESSING BE LARGEST APPLICATION IN HYDROCHLORIC ACID MARKET
FIGURE 33 FOOD AND BEVERAGES TO BE LARGEST END USER IN HYDROCHLORIC ACID MARKET
FIGURE 34 HYDROCHLORIC ACID MARKET GROWTH RATE, BY COUNTRY, 2024–2029
FIGURE 35 ASIA PACIFIC: HYDROCHLORIC ACID MARKET SNAPSHOT
FIGURE 36 NORTH AMERICA: HYDROCHLORIC ACID MARKET SNAPSHOT
FIGURE 37 REVENUE ANALYSIS OF KEY COMPANIES IN LAST FIVE YEARS
FIGURE 38 HYDROCHLORIC ACID MARKET: MARKET SHARE ANALYSIS
FIGURE 39 RANKING OF TOP FIVE PLAYERS IN HYDROCHLORIC ACID MARKET
FIGURE 40 COMPANY VALUATION (USD BILLION)
FIGURE 41 FINANCIAL MATRIX: EV/EBITDA RATIO
FIGURE 42 HYDROCHLORIC ACID MARKET: PRODUCT COMPARISON
FIGURE 43 HYDROCHLORIC ACID MARKET: COMPANY EVALUATION MATRIX (KEY PLAYERS), 2023
FIGURE 44 HYDROCHLORIC ACID MARKET: COMPANY FOOTPRINT (10 COMPANIES)
FIGURE 45 HYDROCHLORIC ACID MARKET: COMPANY EVALUATION MATRIX (STARTUPS/SMES), 2023
FIGURE 46 BASF SE: COMPANY SNAPSHOT
FIGURE 47 COVESTRO AG: COMPANY SNAPSHOT
FIGURE 48 OLIN CORPORATION: COMPANY SNAPSHOT
FIGURE 49 WESTLAKE CORPORATION: COMPANY SNAPSHOT
FIGURE 50 OCCIDENTAL PETROLEUM CORPORATION: COMPANY SNAPSHOT
FIGURE 51 FORMOSA PLASTICS CORPORATION: COMPANY SNAPSHOT
FIGURE 52 TATA CHEMICALS LIMITED: COMPANY SNAPSHOT
FIGURE 53 AGC INC.: COMPANY SNAPSHOT


Growth opportunities and latent adjacency in Hydrochloric Acid Market