Tire Material Market by Type (Elastomers, Reinforcing Fillers, Plasticizers, Chemicals, Metal Reinforcements, Textile Reinforcements), Vehicle Type (Passenger Cars, Trucks, Buses, LCV), and Region - Global Forecast to 2022


The tire material market is projected to reach USD 91.23 Billion by 2022, at a CAGR of 4.3%. The base year for this study is 2016 and the forecast period is 2017–2022.
The Objectives of Tire Material Market Study are -
- To define, describe, and forecast the global tire material market in terms of value and volume
- To provide detailed information regarding the key factors, such as drivers, restraints, opportunities, and challenges, influencing the growth of the market
- To define, describe, and forecast the market on the basis of type, vehicle type, and region
- To forecast the market size with respect to five main regions, namely, North America, Europe, Asia Pacific (APAC), South America, and the Middle East & Africa
- To strategically analyze micromarkets with respect to individual growth trends, prospects, and contribution to the overall market
- To analyze the opportunities in the market for stakeholders and draw a competitive landscape of the market
- To analyze competitive developments such as joint ventures, mergers & acquisitions, new product developments, and Research & Development (R&D) in the tire material market
- To strategically profile key players and comprehensively analyze their core competencies
Both, top-down and bottom-up approaches were used to estimate and validate the global size of the tire materials market and estimate the sizes of various other dependent submarkets. The research study involved extensive use of secondary sources, directories, and databases, such as D&B Hoovers, Bloomberg, Chemical Weekly, and other government, private, and company websites to identify and collect information useful for this technical, market-oriented, and commercial study of the tire material market. After arriving at the overall market size, the total market was split into several segments and subsegments. The figure illustrated below provides a breakdown of primary interviews on the basis of company type, designation, and region.
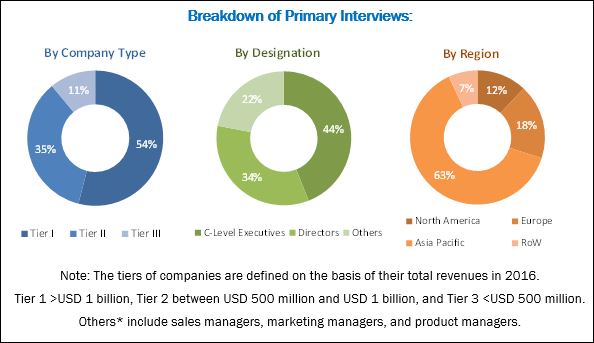
To know about the assumptions considered for the study, download the pdf brochure
Key Players in Tire Material Market
The tire material market has a diversified and well-established ecosystem of upstream players, such as raw material suppliers and downstream stakeholders, such as manufacturers, vendors, and end users. Cabot Corporation (US), JSR Corporation (Japan), Thai Carbon Black (Thailand), Lanxess (Germany), and Bekaert (Belgium) are some of the leading manufacturers and suppliers of tire material.
Key Target Audience in Tire Material Market
- Manufacturers, Dealers, and Suppliers of Tire Material
- Raw Material Manufacturers
- Regional Tire Manufacturers Associations
- Government and Regional Agencies
- Research & Development Institutions
Tire Material Market Report Scope
This research report categorizes the tire material market based on material, vehicle type, and region.
Tire Material Market, By Vehicle Type:
- Passenger Cars
- Buses
- Trucks
- LCV
Tire Materials Market, By Type:
- Elastomers
- Reinforcing Fillers
- Plasticizers
- Chemicals
- Metal Reinforcements
- Textile Reinforcements
Tire Material Market, By Region:
- North America
- Europe
- Asia Pacific
- Middle East & Africa
- South America
The market has been further analyzed for key countries in each of these regions.
Tire Material Market Report Available Customizations
Along with the market data, MarketsandMarkets offers customizations according to the specific needs of companies. The following customization options are available for the report:
Regional Analysis:
- Tire material market analysis for additional countries
Company Information:
- Detailed analysis and profiles of additional market players
The global market size for tire material was USD 73.93 Billion in 2017 and is projected to reach USD 91.23 Billion by 2022, at a CAGR of 4.3% between 2017 and 2022. The increasing sales of vehicles along with the initiatives to decrease tire weight are the significant factors projected to drive the growth of the tire material market.
The elastomers segment accounted for the largest share of the tire materials market as compared to other materials in 2016, in terms of volume. Elastomers include natural rubber and synthetic rubber. Increasing vehicle sales globally due to the increasing population and need for transportation is boosting the tire demand and is expected to indirectly drive the tire material demand during the forecast period.
The passenger cars segment is expected to be the fastest-growing segment of the tire materials market, in terms of both value and volume. Lower interest rates via banking and different schemes and subsidies provided by governments to set up business units are expected to boost vehicle sales globally.
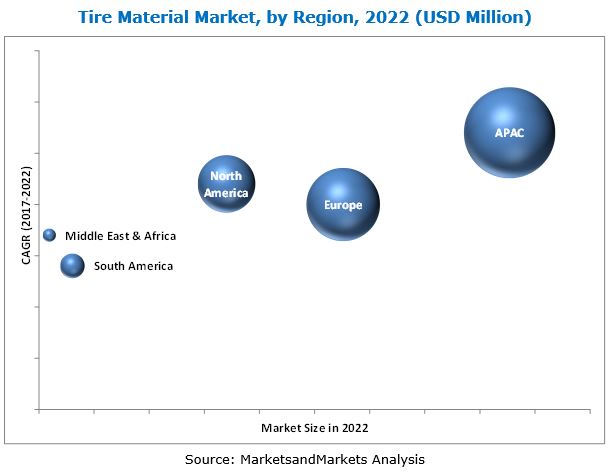
The tire material market in APAC is projected to grow at the highest CAGR during the forecast period, in terms of both value and volume. China and India are the major countries contributing for the growth of tire materials market in the region. Easy availability of raw material, political & economic stability, well-developed infrastructural facilities, and skilled & cheap labor force have attracted major international automotive manufacturers to invest in APAC. Hence, all these factors are expected to drive market for tire material in the APAC region.
Volatile price of raw materials is acting as a key restraint to the growth of the tire material market.
Key Tire Material Market Industry Players
Cabot Corporation (US), JSR Corporation (Japan), Thai Carbon Black (Thailand), Lanxess (Germany), and Bekaert (Belgium) are some of the key players operating in the tire materials market. These companies have maintained a strong foothold in the tire materials market, owing to their diverse product portfolios, strategically positioned R&D centers, adoption of various growth strategies, and expansion of production capacities.
In September 2017, Thai Carbon Black Public Company Limited commenced its operation to produce carbon black in a greenfield facility in Jining, China. The plant is being constructed in two phases. Currently, the company has installed a production capacity of 120,000 ton per year in phase 1 and is expected to increase the production capacity to 240,000 tons. This expansion will enable the company to serve its customers in China.
Frequently Asked Questions (FAQ):
How big is the Tire Material Market industry?
The global market size for tire material was USD 73.93 Billion in 2017 and is projected to reach USD 91.23 Billion by 2022, at a CAGR of 4.3% between 2017 and 2022.
Who leading market players in Tire Material industry?
Key players profiled in the tire material market report are Cabot Corporation (US), JSR Corporation (Japan), Thai Carbon Black (Thailand), Lanxess (Germany), and Bekaert (Belgium).
To speak to our analyst for a discussion on the above findings, click Speak to Analyst
 Exclusive indicates content/data unique to MarketsandMarkets and not available with any competitors.
Table of Contents
1 Introduction (Page No. - 11)
1.1 Objectives of the Study
1.2 Market Definition
1.3 Market Scope
1.3.1 Years Considered for the Study
1.4 Currency
1.5 Unit Considered
1.6 Stakeholders
2 Research Methodology (Page No. - 14)
2.1 Research Data
2.1.1 Secondary Data
2.1.1.1 Key Data From Secondary Sources
2.1.2 Primary Data
2.1.2.1 Key Data From Primary Sources
2.1.2.2 Key Industry Insights
2.1.2.3 Breakdown of Primary Interviews
2.2 Market Size Estimation
2.2.1 Top-Down and Bottom-Up Approach
2.3 Data Triangulation
2.4 Assumptions
2.5 Limitations
3 Executive Summary (Page No. - 22)
4 Premium Insights (Page No. - 25)
4.1 Attractive Opportunities in Tire Material Market
4.2 Tire Materials Market Size, By Vehicle Type
4.3 Tire Material Market Size, By Type
4.4 APAC Tire Materials Market, By Country and Type
5 Market Overview (Page No. - 27)
5.1 Introduction
5.2 Market Dynamics
5.2.1 Drivers
5.2.1.1 Increase in Vehicle Usage, Globally
5.2.1.2 Increasing Global Sales of Construction & Mining Equipment
5.2.2 Restraints
5.2.2.1 Fluctuating Raw Material Prices
5.2.3 Opportunities
5.2.3.1 Demand for Eco-Friendly Tire Material
5.2.4 Challenges
5.2.4.1 Managing Supply-Demand Ratio of Some Raw Material
5.3 Porter’s Five Forces Analysis
5.3.1 Intensity of Competitive Rivalry
5.3.2 Threat of New Entrants
5.3.3 Threat of Substitute
5.3.4 Bargaining Power of Suppliers
5.3.5 Bargaining Power of Buyers
6 Tire Material Market, By Type (Page No. - 33)
6.1 Introduction
6.2 Elastomers
6.3 Reinforcing Fillers
6.4 Plasticizers
6.5 Chemicals
6.6 Metal Reinforcements
6.7 Textile Reinforcements
7 Tire Material Market, By Vehicle Type (Page No. - 41)
7.1 Introduction
7.2 Passenger Cars
7.3 Buses
7.4 Heavy Trucks
7.5 Lightweight Commercial Vehicles (LCV)
8 Tire Materials Market, By Region (Page No. - 47)
8.1 Introduction
8.2 APAC
8.2.1 China
8.2.2 Japan
8.2.3 South Korea
8.2.4 India
8.2.5 Thailand
8.2.6 Indonesia
8.2.7 Malaysia
8.2.8 Rest of APAC
8.3 Europe
8.3.1 Germany
8.3.2 Spain
8.3.3 France
8.3.4 UK
8.3.5 Russia
8.3.6 Turkey
8.3.7 Italy
8.3.8 Rest of Europe
8.4 North America
8.4.1 US
8.4.2 Canada
8.4.3 Mexico
8.5 Middle East & Africa
8.5.1 South Africa
8.5.2 Morocco
8.5.3 Rest of Middle East & Africa
8.6 South America
8.6.1 Brazil
8.6.2 Argentina
8.6.3 Rest of South America
9 Competitive Landscape (Page No. - 70)
9.1 Overview
9.2 Competitive Scenario
9.2.1 Expansions
9.2.2 Joint Ventures
9.2.3 Acquisitions
9.2.4 Agreements
10 Company Profiles (Page No. - 74)
(Business Overview, Products Offered, Recent Developments, SWOT Analysis, MnM View)*
10.1 Lanxess
10.2 Cabot Corporation
10.3 Phillips Carbon Black Limited
10.4 The Goodyear Tire and Rubber Company
10.5 Sinopec
10.6 Kurarey
10.7 JSR Corporation
10.8 Thai Carbon Black Public Company Limited (Birla Carbon)
10.9 Orion Engineered Carbons S.A.
10.10 Royal Dutch Shell
10.11 Other Key Market Players
10.11.1 Chevron Corporation
10.11.2 Nynas AB
10.11.3 Petrochina
10.11.4 Exxonmobil
10.11.5 Sibur
10.11.6 Ralson Goodluck Carbon
10.11.7 Longxing Chemical
10.11.8 Phillips 66 Company
10.11.9 U.S. Zinc
10.11.10 Horsehead Corporation
10.11.11 Umicore SA
10.11.12 SRF Limited
10.12.13 PPG Industries
*Details on Business Overview, Products Offered, Recent Developments, SWOT Analysis, MnM View Might Not Be Captured in Case of Unlisted Companies.
11 Appendix (Page No. - 99)
11.1 Discussion Guide
11.2 Knowledge Store: Marketsandmarkets Subscription Portal
11.3 Introducing RT: Real-Time Market Intelligence
11.4 Available Customizations
11.5 Related Reports
11.6 Author Details
List of Tables (61 Tables)
Table 1 Major Tire Manufacturers: Usage of Eco-Friendly Materials
Table 2 Tire Material Market Size, By Type, 2015–2022 (USD Million)
Table 3 Tire Materials Market Size, By Type, 2015–2022 (Kiloton)
Table 4 Elastomers Market Size for Tire Material By Region, 2015–2022 (USD Million)
Table 5 Elastomers Market Size for Tire Materials By Region, 2015–2022 (Kiloton)
Table 6 Reinforcing Fillers Market Size for Tire Material, By Region, 2015–2022 (USD Million)
Table 7 Reinforcing Fillers Market Size for Tire Materials, By Region, 2015–2022 (Kiloton)
Table 8 Plasticizers Market Size for Tire Material, By Region, 2015–2022 (USD Million)
Table 9 Plasticizers Market Size for Tire Materials, By Region, 2015–2022 (Kiloton)
Table 10 Chemicals Market Size for Tire Material, By Region, 2015–2022 (USD Million)
Table 11 Chemicals Market Size for Tire Materials, By Region, 2015–2022 (Kiloton)
Table 12 Metal Reinforcements Market Size for Tire Material, By Region, 2015–2022 (USD Million)
Table 13 Metal Reinforcements Market Size for Tire Material, By Region, 2015–2022 (Kiloton)
Table 14 Textile Reinforcements Market Size for Tire Material, By Region, 2015–2022 (USD Million)
Table 15 Textile Reinforcements Market Size for Tire Material, By Region, 2015–2022 (Kiloton)
Table 16 Tire Material Market Size, By Vehicle Type, 2015–2022 (USD Million)
Table 17 Tire Materials Market Size, By Vehicle Type, 2015–2022 (Kiloton)
Table 18 Passenger Cars: Tire Material Market Size, By Region, 2015–2022 (USD Million)
Table 19 Passenger Cars: Tire Materials Market Size, By Region, 2015–2022 (Kiloton)
Table 20 Buses: Tire Material Market Size, By Region, 2015–2022 (USD Million)
Table 21 Buses: Tire Materials Market Size, By Region, 2015–2022 (Kiloton)
Table 22 Heavy Trucks: Tire Material Market Size, By Region, 2015–2022 (USD Million)
Table 23 Heavy Trucks: Tire Materials Market Size, By Region, 2015–2022 (Kiloton)
Table 24 LCV: Tire Material Market Size, By Region, 2015–2022 (USD Million)
Table 25 LCV: Tire Materials Market Size, By Region, 2015–2022 (Kiloton)
Table 26 Tire Material Market, By Region, 2015–2022 (Kiloton)
Table 27 Tire Materials Market, By Region, 2015–2022 (USD Million)
Table 28 APAC: Tire Material Market, By Country, 2015–2022 (Kiloton)
Table 29 APAC: Market, By Country, 2015–2022 (USD Million)
Table 30 APAC: Market, By Type, 2015–2022 (Kiloton)
Table 31 APAC: Market, By Type, 2015–2022 (USD Million)
Table 32 APAC: Market, By Vehicle Type, 2015–2022 (Kiloton)
Table 33 APAC: Market, By Vehicle Type, 2015–2022 (USD Million)
Table 34 Europe: Tire Material Market, By Country, 2015–2022 (Kiloton)
Table 35 Europe: Market, By Country, 2015–2022 (USD Million)
Table 36 Europe: Market, By Type, 2015–2022 (Kiloton)
Table 37 Europe: Market, By Type, 2015–2022 (USD Million)
Table 38 Europe: Market, By Vehicle Type, 2015–2022 (Kiloton)
Table 39 Europe: Market, By Vehicle Type, 2015–2022 (USD Million)
Table 40 North America: Tire Material Market, By Country, 2015–2022 (Kiloton)
Table 41 North America: Market, By Country, 2015–2022 (USD Million)
Table 42 North America: Market, By Type, 2015–2022 (Kiloton)
Table 43 North America: Market, By Type, 2015–2022 (USD Million)
Table 44 North America: Market, By Vehicle Type, 2015–2022 (Kiloton)
Table 45 North America: Market, By Vehicle Type, 2015–2022 (USD Million)
Table 46 Middle East & Africa: Tire Material Market, By Country, 2015–2022 (Kiloton)
Table 47 Middle East & Africa: Market, By Country, 2015–2022 (USD Million)
Table 48 Middle East & Africa: Market, By Type, 2015–2022 (Kiloton)
Table 49 Middle East & Africa: Market, By Type, 2015–2022 (USD Million)
Table 50 Middle East & Africa: Market, By Vehicle Type, 2015–2022 (Kiloton)
Table 51 Middle East & Africa: Market, By Vehicle Type, 2015–2022 (USD Million)
Table 52 South America: Tire Material Market, By Country, 2015–2022 (Kiloton)
Table 53 South America: Market, By Country, 2015–2022 (USD Million)
Table 54 South America: Market, By Type, 2015–2022 (Kiloton)
Table 55 South America: Market, By Type, 2015–2022 (USD Million)
Table 56 South America: Market, By Vehicle Type, 2015–2022 (Kiloton)
Table 57 South America: Market, By Vehicle Type, 2015–2022 (USD Million)
Table 58 Expansions, 2015–2017
Table 59 Joint Ventures, 2015–2017
Table 60 Acquisitions, 2015–2017
Table 61 Agreements, 2015–2017
List of Figures (33 Figures)
Figure 1 Tire Material Market Segmentation
Figure 2 Tire Materials Market Research Design
Figure 3 Market Size Estimation: Top-Down Approach
Figure 4 Market Size Estimation: Bottom-Up Approach
Figure 5 Tire Material Market: Data Triangulation
Figure 6 Passenger Cars Segment Dominates the Tire Material Market During Forecast Period
Figure 7 Elastomers Segment Dominates the Tire Materials Market During Forecast Period
Figure 8 Tire Material Market: Snapshot
Figure 9 Emerging Economies Offer High Growth Opportunities for Market Players
Figure 10 Passenger Cars Segment to Register the Highest CAGR Between 2017 and 2022
Figure 11 Elastomers to Register the Fastest-Grow Rate During Forecast Period
Figure 12 China Accounted for the Largest Share of Tire Material Market in 2016
Figure 13 Factors Governing the Tire Material Market
Figure 14 Porter’s Five Forces Analysis: Tire Materials Market
Figure 15 Elastomers to Lead the Tire Material Market During Forecast Period
Figure 16 Passenger Cars to Dominate Tire Material Market During Forecast Period
Figure 17 Tire Material Market Outlook, By Country, 2017–2022
Figure 18 APAC Tire Materials Market Snapshot
Figure 19 Europe Tire Material Market Snapshot
Figure 20 US Dominates Tire Material Market in North America During Forecast Period
Figure 21 South Africa to Dominate Tire Material Market in Middle East & Africa During Forecast Period
Figure 22 Brazil to Dominate the Tire Materials Market in South America During Forecast Period
Figure 23 Expansion is the Key Strategy Adopted By Leading Players Between 2015 and 2017
Figure 24 Lanxess: Company Snapshot
Figure 25 Cabot Corporation: Company Snapshot
Figure 26 Phillips Carbon Black Limited: Company Snapshot
Figure 27 The Goodyear Tire and Rubber Company: Company Snapshot
Figure 28 Sinopec: Company Snapshot
Figure 29 Kurarey: Company Snapshot
Figure 30 JSR Corporation: Company Snapshot
Figure 31 Thai Carbon Black Public Company Limited (Birla Carbon): Company Snapshot
Figure 32 Orion Engineered Carbons S.A.: Company Snapshot
Figure 33 Royal Dutch Shell: Company Snapshot


Growth opportunities and latent adjacency in Tire Material Market