Reservoir Analysis Market by Service (Geo Modeling, & Reservoir Simulation, Data Acquisition & Monitoring, and Reservoir Sampling), Application (Onshore & Offshore), Reservoir Type (Conventional & Unconventional), and Region - Global Forecast to 2022


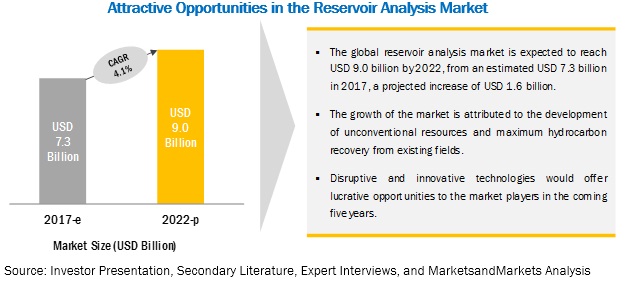
[164 Pages Report] MarketsandMarkets forecasts the Reservoir Analysis market to grow from USD 7.3 billion in 2017 to USD 9.0 billion by 2022, at a Compound Annual Growth Rate (CAGR) of 4.1% during the forecast period. The major factors that are expected to be driving the Reservoir Analysis market are increasing focus on mature oil and gas fields and new field developments, increase in energy demand from emerging economics, and increased reliability in reservoir analysis due to technology advancements. The objective of the report is to define, describe, and forecast the Reservoir Analysis market size based on service (reservoir simulation & geo modeling, data acquisition & monitoring services, reservoir sampling services), application (onshore, offshore), reservoir type (conventional, unconventional), and region.
By service, the Data Acquisition & Monitoring Services segment is expected to grow at the highest growth rate during the forecast period
Data acquisition & monitoring services segment accounts for the largest share, and is expected to grow at the fastest CAGR during the forecast period. Data acquisition and monitoring services help to enhance reservoir functionality and optimize production by providing real time information with a faster decision cycle. Various equipment and software are used to perform the data acquisition task. Tools used include such as memory gauges, surface readout tools, and surface measuring equipment, which are used to get accurate and real-time data of a well. The increase in E&P activities from the unconventional resources, is expected to increase the demand for data acquisition and monitoring services
By reservoir type, the unconventional segment to record the highest CAGR during the forecast period
Shale reservoirs, coalbed methane, fractured reservoirs, gas hydrates, and tight gas sands are considered as unconventional reservoirs. These reservoirs are distinguished from the conventional reservoirs, based on the porosity, permeability, and fluid trap mechanism of the reservoirs. The development of new technologies, and the presence abundance of unconventional resources globally, is expected to drive the unconventional reservoir analysis market at the fastest rate during the forecast period.
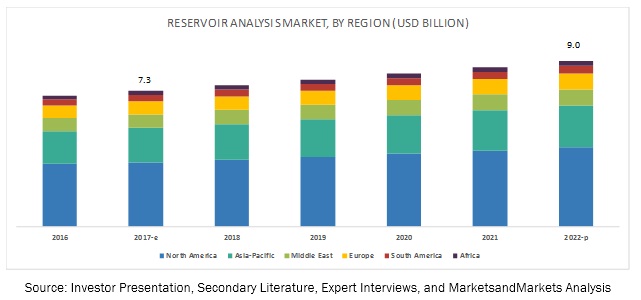
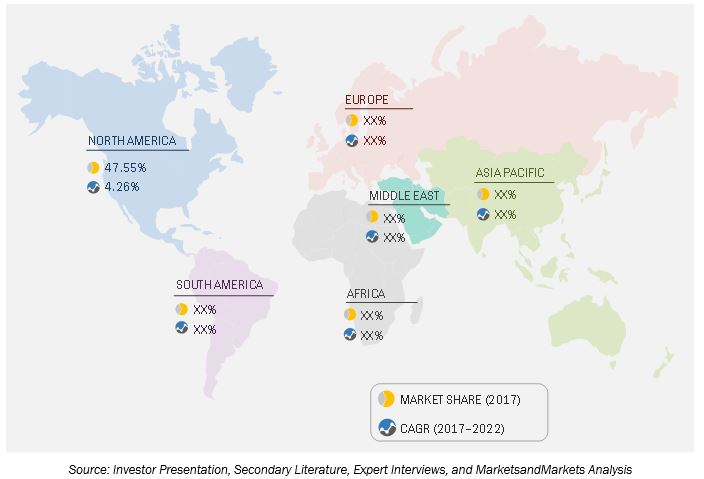
North America to account for the largest market size during the forecast period.
North America is expected to hold the largest market size in the Reservoir Analysis market during the forecast period, followed by the Asia pacific region. The market in North America is also expected to dominate the global reservoir analysis market, during the forecast period, owing to increased oil & gas exploration activities from the unconventional resources, especially in the US. The North American market is primarily driven by the US which was the world�s top producer of petroleum and natural gas hydrocarbons in 2015, surpassing Russia and Saudi Arabia. The liberalization of energy sector in Mexico is expected to attract foreign investors, and also expected to drive the reservoir analysis market. The presence of 573 trillion cubic feet estimates of shale reservoirs, in Canada, is attracting many international and national oil companies, which are interested to explore the sedimentary basins and shale areas of the country. All these factor contribute to the high growth rate of North America.
Market Dynamics
Driver: Increasing energy demand from emerging economics
The demand for oil & gas is growing significantly, despite the fact that the price to purchase energy is increasing, due to growing population. To satisfy this increasing demand, oil companies are seeking to unlock the full potential of remote oil & gas fields, which were once inaccessible, because of technological limitations. Additionally, to sustain production, it has become increasingly important to maintain these fields at their optimum production levels and extract the maximum amount of resources. This growing demand has led to the increase in the supply of energy.
Reservoirs are the original source of energy. They require special techniques to achieve commercial flow rates. Several technologies have been developed over the years to enhance the flow from reservoirs. Old oil discovery techniques are unable to keep pace with the continually increasing demand for oil. To compensate for this shortfall, the increased use of reservoir analysis technologies is required to recover maximum hydrocarbons from existing fields and discover new fields. More fields are expected to grow, with the world oil demand estimated to reach around 4 GTOE (Gigatons of oil equivalent), by 2020. This increasing demand for oil is expected to boost the demand for reservoir analysis technologies.
Restraint: High cost, complexity, and risks of reservoir analysis
The emergence of a variety of significant innovations in the analysis and modelling of structurally complex reservoirs have been evident from the developments in the oil & gas sector in the past two decades. Especially the unconventional deepwater and ultra-deepwater reservoirs place new challenges for reservoir analysis because of the high cost and risk involved in exploring these resources. A single reservoir hydrocarbon often has complicated properties and phase behaviors. Thus, it is important to determine fluid heterogeneities and compartmentalization at early exploration and appraisal stage. It is a difficult process that conventionally requires numerous fluid samples and associated laboratory analysis which is costly.
Exploration and production of hydrocarbons involves considerable risk, owing to uncertain and complex geological concepts pertaining to structure, reservoir seal, and hydrocarbon charge. Economic evaluations also have uncertainties related to costs, probability of finding, and economically producing a reservoir. The cost of reservoir analysis depends on the technology applied and is also a function of prevalent oil prices. However, the technological, operational, and political factors impact the reservoir analysis, they also have a secondary role often. Methodologies to quantify the uncertainties in reservoir analysis are still not well established due to the number of variables that are involved in the overall process. The complete analysis usually depends on geological characteristics such as volume in place, continuity and faults, and economic and technological uncertainties that influence the decision-making process at different levels depending on the problem, reservoir characteristics, recovery mechanism, and the stage of field development. Since, reservoir analysis is prelude to reservoir development, the process is even more critical because most of the investments are made during this stage when the uncertainties are highest. Optimal reservoir management and analysis requires accurate and realistic models of reservoirs. Reservoir simulation is a tool utilized to obtain accurate models of oil & gas reservoirs. This type of simulation combines geology, geophysics, numerical methods, and high-performance computing. A key tool in predicting a reservoir performance is uncertainty analysis, which requires massive reservoir simulations with different models. Different reservoirs have different physical properties in terms of porosity, permeability, density, saturation, pressure, and temperature. Due to this complexity, reservoir modelling is considered a highly computation-intensive and capital-intensive problem.
Opportunity: Exploring unconventional reservoir
Reservoir analysis of unconventional plays is based on same principles and workflows as in conventional plays, but requires additional specialized knowledge. The flow regime, fluid properties, and petro physics in unconventional reservoir vary from conventional reservoir. The well stimulation (i.e. fracking) and completion technology need to be separately designed for these types of reservoirs. Due to continuously growing energy demand, operators are now developing more complex and costly unconventional oil & gas plays. Understanding the geo-mechanical behavior of such systems throughout the production lifetime then becomes inevitable. Planning successful completions and production of unconventional plays requires a detailed knowledge of reservoirs heterogeneity and anisotropy. Reservoir analysis services aids to understand these effects by measuring and modeling horizontal and vertical variations in mineralogical and mechanical properties, as well as the distribution and characterization of faults and natural fractures that influence hydraulic fracturing and production rates.
Challenge: Identify small scale reservoir compartments
Reservoir compartments deals with faults, fractures, and thin layers in any reservoir. Reservoir compartmentalization can be caused by sealing faults or depositional discontinuities in any reservoir. It can have an adverse effect on oil or gas recovery factors by reducing the efficiency of production well. Many under-performing field developments had unidentified compartments as a root cause. Thus, it is a huge challenge for reservoir analysis market to characterize reservoir compartments as early as possible. One factor which leads to reservoir compartmentalization is disequilibrium in the fluid system in different parts of the reservoir, caused by variations in pressure, fluid contacts, fluid chemicals, or physical properties.
Scope of the Report
|
Report Metric |
Details |
|
Market size available for years |
2015�2022 |
|
Base year considered |
2016 |
|
Forecast period |
2017�2022 |
|
Forecast units |
Billion (USD) |
|
Segments covered |
Service (Reservoir Simulation & Geo Modeling, Data Acquisition & Monitoring Services, Reservoir Sampling Services), Application (Onshore, Offshore), Reservoir Type (Conventional, Unconventional), and Region |
|
Geographies covered |
North America, Europe, Asia-Pacific, Middle East, Africa and South America |
|
Companies covered |
Schlumberger Limited (US), Halliburton Company (US), Baker Hughes Incorporated (US), Weatherford International, PLC (Switzerland), CGG SA (France), Core Laboratories (US), Tracerco (UK), SGS SA (Switzerland), ALS Oil & Gas (Australia), Expro Group (UK), Geokinetics (US), Intertrek (UK), Paradigm (US), Roxar Software Solutions AS (Norway), and Trican Well Service Limited (Canada) |
The research report categorizes the Reservoir Analysis to forecast the revenues and analyze the trends in each of the following sub-segments:
Reservoir Analysis Market By Service
- Reservoir Simulation & Geo Modeling
- Data Acquisition & Monitoring Services
- Reservoir Sampling Services
Reservoir Analysis Market By Application
- Onshore
- Offshore
Reservoir Analysis Market By Reservoir Type
- Conventional
- Unconventional
Reservoir Analysis Market By Region
- North America
- Europe
- Asia Pacific (APAC)
- Middle East
- Africa
- South America
Key Market Players
Schlumberger Limited (US), Halliburton Company (US), Baker Hughes Incorporated (US), Weatherford International, PLC (Switzerland), CGG SA (France), Core Laboratories (US), Tracerco (UK), SGS SA (Switzerland), ALS Oil & Gas (Australia), Expro Group (UK), Geokinetics (US), Intertrek (UK), Paradigm (US), Roxar Software Solutions AS (Norway), and Trican Well Service Limited (Canada)
Schlumberger Limited (U.S.) is one of the leading providers of products, services, technology, information solutions, and integrated project management solutions for the global oil & gas exploration and production industry. The company manages its business through three groups, namely, reservoir characterization, drilling, and production. It provides reservoir analysis services and solutions such as reservoir laboratory services, ECLIPSE industry-reference simulator, INTERSECT high-resolution reservoir simulator, reservoir sampling and other analysis solutions under its reservoir characterization segment. The reservoir segment also consists of services such as E&P flow rate and pressure measurement services and reservoir monitoring, imaging, and development services.
Recent Developments
- In May 2017, Baker Hughes introduced DEEPFRAC Deepwater multistage fracturing service which would save the cost for operators in offshore developments and would be able to complete the offshore well project efficiently. This service would eliminate casing and cementing operations and simplify fluid logistics and would not need tool movement during the DEEPFRAC service's stimulation process.
- In November 2016, SGS SA received a contract from DNO (Norway) for two years to provide upstream services for DNO's offshore rigs and rig-less operations in the gulf region. These services would include reservoir evaluation logging, analysis behind tubing and casing, and production logging, among others. This contract would help SGS SA to expand its upstream services by gaining more contracts in the gulf region.
- In September 2016, Schlumberger Limited introduced Geotest geology as a new well test design and interpretation software. This new software would be a part of the Petrel Exploration and Production (E&P) platform, which enables companies to standardize workflows from exploration to production. This new software would maximize the value of well tests by integrating geological and geophysical models with the well test data.
- In June 2016, Weatherford and Enthought (U.S.) collaborated to analyze the core which was recovered from Chicxulub Crater in the Gulf of Mexico. This analysis of the core would help Weatherford to preserve the data for future exploration.
- In April 2016, Schlumberger Limited supplied its Petrel reservoir engineering and ECLIPSE industry-reference reservoir simulator to Indian Oil Corporation, Limited (IOCL) (India) for evaluation of hydraulic fracturing in a tight gas reservoir during the field development planning stage. This would help Indian Oil Corporation to create a dynamic reservoir model to quantify potential improvement in gas recovery including the impact of hydraulic fracture well stimulation.
- In October 2015, Halliburton's business line, Landmark Software and Services, a leading software provider for the upstream oil & gas industry, collaborated with CGG SA (France) to develop next generation geoscience workflows. This contract would allow the customers to seamlessly access best interpretation and reservoir characterization technologies and geoscience offerings from both the companies. Landmark's Decision Space, which is the first E&P enterprise platform would help in delivering series of workflows through connectivity of geoscience applications and data. This contract would help Halliburton to drive the pace of innovation and help the end-users to maximize the recovery rates in less time.
Critical questions the report answers:
- Where will all these developments take the industry in the long term?
- What are the upcoming trends for the reservoir analysis market?
- Which segment provides the most opportunity for growth?
- Who are the leading vendors operating in this market?
- What are the opportunities for new market entrants?
To speak to our analyst for a discussion on the above findings, click Speak to Analyst
 Exclusive indicates content/data unique to MarketsandMarkets and not available with any competitors.
Table of Contents
1 Introduction (Page No. - 14)
1.1 Objectives of the Study
1.2 Market Definition
1.3 Market Scope
1.3.1 Markets Covered (Subsegments Including Region-Wise Segmentation)
1.3.2 Years Considered for the Study
1.4 Currency & Pricing
1.5 Limitations
1.6 Stakeholders
2 Research Methodology (Page No. - 17)
2.1 Introduction
2.1.1 Secondary Data
2.1.1.1 Key Data From Secondary Sources
2.1.2 Primary Data
2.1.2.1 Key Data From Primary Sources
2.1.2.2 Key Industry Insights
2.1.2.3 Breakdown of Primary Interviews
2.2 Market Size Estimation
2.2.1 Top-Down Approach
2.2.2 Bottom-Up Approach
2.3 Market Breakdown & Data Triangulation
2.4 Research Assumptions
2.5 Research Limitations
3 Executive Summary (Page No. - 25)
4 Premium Insights (Page No. - 30)
4.1 Reservoir Analysis Market, By Application
4.2 Market, By Service Type
4.3 The North American Reservoir Analysis : Application vs Reservoir Type
4.4 North America: the Largest Market During the Forecast Period
5 Market Overview (Page No. - 33)
5.1 Introduction
5.2 Market Dynamics
5.2.1 Drivers
5.2.1.1 Increasing Energy Demand From Emerging Economies
5.2.1.2 Maximizing Hydrocarbon Recovery
5.2.1.3 Increased Reliability in Reservoir Analysis Due to Technological Advancements
5.2.1.4 New Field Development
5.2.2 Restraints
5.2.2.1 High Cost, Complexity, and Risks of Reservoir Analysis
5.2.2.2 Political Issues & Technological Restraints Make IT Difficult to Access Oil & Gas Reserves
5.2.3 Opportunities
5.2.3.1 Exploring Unconventional Reservoir
5.2.4 Challenges
5.2.4.1 Reducing the Reservoir Uncertainty and Optimize Reservoir Management
5.2.4.2 Accurate Representation of Reservoir Geometry and Heterogeneity
5.2.4.3 Identify Small Scale Reservoir Compartments
5.2.4.4 Government Regulations and Growing Environmental Concerns
6 Reservoir Analysis, By Application (Page No. - 42)
6.1 Introduction
6.2 Market Analysis
6.2.1 Onshore
6.2.2 Offshore
7 Reservoir Analysis, By Service (Page No. - 47)
7.1 Introduction
7.1.1 Reservoir Simulation & Geomodeling Services
7.1.2 Data Acquisition & Monitoring Services
7.1.3 Reservoir Sampling Services
8 Reservoir Analysis, By Reservoir Type (Page No. - 53)
8.1 Introduction
8.1.1 Conventional
8.1.2 Unconventional
9 Reservoir Analysis Market, By Region (Page No. - 57)
9.1 Introduction
9.2 North America
9.2.1 U.S.
9.2.2 Canada
9.2.3 Mexico
9.3 Asia-Pacific
9.3.1 China
9.3.2 India
9.3.3 Indonesia
9.3.4 Australia
9.3.5 Rest of Asia-Pacific
9.4 Europe
9.4.1 Russia
9.4.2 U.K.
9.4.3 Norway
9.4.4 Rest of Europe
9.5 Africa
9.5.1 Angola
9.5.2 Nigeria
9.5.3 Algeria
9.5.4 Rest of Africa
9.6 The Middle East
9.6.1 Saudi Arabia
9.6.2 Iran
9.6.3 Kuwait
9.6.4 U.A.E.
9.6.5 Rest of the Middle East
9.7 South America
9.7.1 Venezuela
9.7.2 Argentina
9.7.3 Brazil
9.7.4 Colombia
9.7.5 Rest of South America
10 Competitive Landscape (Page No. - 91)
10.1 Overview
10.2 Market Ranking, Market, 2016
10.3 Competitive Situation & Trends
10.4 Competitive Leadership Mapping
10.4.1 Vanguards (Market Leaders)
10.4.2 Innovators
10.4.3 Dynamic
10.4.4 Emerging
10.5 Analysis of the Product Portfolio of Major Players in the Market (25 Companies)
10.6 Business Strategies Adopted By Major Players in the Market (25 Companies)
11 Company Profiles (Page No. - 99)
(Overview, Products & Services, Strategies & Insights, Developments and MnM View)*
11.1 Schlumberger Limited
11.2 Halliburton Company
11.3 Baker Hughes Incorporated
11.4 Weatherford International, PLC
11.5 SGS SA
11.6 ALS Oil & Gas
11.7 CGG SA
11.8 Core Laboratories
11.9 Expro Group
11.10 Geokinetics
11.11 Intertrek
11.12 Paradigm
11.13 Roxar Software Solutions as
11.14 Tracerco
11.15 Trican Well Service Limited
*Details on Overview, Products & Services, Strategies & Insights, Developments and MnM View Might Not Be Captured in Case of Unlisted Companies.
12 Appendix (Page No. - 155)
12.1 Insights of Industry Experts
12.2 Discussion Guide
12.3 Knowledge Store: Marketsandmarkets� Subscription Portal
12.4 Introducing RT: Real Time Market Intelligence
12.5 Available Customizations
12.6 Related Reports
12.7 Author Details
List of Tables (63 Tables)
Table 1 Reservoir Analysis Industry Snapshot
Table 2 Market Share, By Application, 2015�2022 (USD Million)
Table 3 Onshore Market Size, By Region, 2015�2022 (USD Million)
Table 4 Offshore Market Size, By Region, 2015�2022 (USD Million)
Table 5 Market Size, By Service, 2017�2022 (USD Million)
Table 6 Reservoir Simulation & Geo Modeling Software
Table 7 Reservoir Simulation & Geo Modeling Services Market Size, By Region, 2015�2022 (USD Million)
Table 8 Data Acquisition & Monitoring Services Market Size, By Region, 2015�2022 (USD Million)
Table 9 Reservoir Sampling Services Market Size, By Region, 2015�2022 (USD Million)
Table 10 Market Size, By Reservoir Type, 2015�2022 (USD Million)
Table 11 Conventional Market Size, By Region, 2015�2022 (USD Million)
Table 12 Unconventional Market Size, By Region, 2015�2022 (USD Million)
Table 13 Market Size, By Region, 2015�2022 (USD Million)
Table 14 North America: Market Size, By Service Type, 2015�2022 (USD Million)
Table 15 North America: Market Size, By Application, 2015�2022 (USD Million)
Table 16 North America: Market Size, By Reservoir Type, 2015�2022 (USD Million)
Table 17 North America: Market Size, By Country, 2015�2022 (USD Million)
Table 18 U.S.: Market Size, By Application, 2015�2022 (USD Million)
Table 19 Canada: Market Size, By Application, 2015�2022 (USD Million)
Table 20 Mexico: Market Size, By Application, 2015�2022 (USD Million)
Table 21 Asia-Pacific: Market Size, By Service Type, 2015�2022 (USD Million)
Table 22 Asia-Pacific: Market Size, By Application, 2015�2022 (USD Million)
Table 23 Asia-Pacific: Market Size, By Reservoir Type, 2015�2022 (USD Million)
Table 24 Aisa-Pacific: Market Size, By Country, 2015�2022 (USD Million)
Table 25 China:Market Size, By Application, 2015�2022 (USD Million)
Table 26 India: Market Size, By Application, 2015�2022 (USD Million)
Table 27 Indonesia: Market Size, By Application, 2015�2022 (USD Million)
Table 28 Australia: Market Size, By Application, 2015�2022 (USD Million)
Table 29 Rest of Asia-Pacific: Market Size, By Application, 2015�2022 (USD Million)
Table 30 Europe: Market Size, By Service Type, 2015�2022 (USD Million)
Table 31 Europe: Market Size, By Application, 2015�2022 (USD Million)
Table 32 Europe: Market Size, By Reservoir Type, 2015�2022 (USD Million)
Table 33 Europe: Market Size, By Country, 2015�2022 (USD Million)
Table 34 Russia: Market Size, By Application, 2015�2022 (USD Million)
Table 35 U.K.: Market Size, By Application, 2015�2022 (USD Million)
Table 36 Norway: Market Size, By Application, 2015�2022 (USD Million)
Table 37 Rest of Europe: Market Size, By Application, 2015�2022 (USD Million)
Table 38 Africa: Market Size, By Service Type, 2015�2022 (USD Million)
Table 39 Africa: Market Size, By Application, 2015�2022 (USD Million)
Table 40 Africa: Market Size, By Reservoir Type, 2015�2022 (USD Million)
Table 41 Africa: Market Size, By Country, 2015�2022 (USD Million)
Table 42 Angola: Market Size, By Application, 2015�2022 (USD Million)
Table 43 Nigeria: Market Size, By Application, 2015�2022 (USD Million)
Table 44 Algeria: Market Size, By Application, 2015�2022 (USD Million)
Table 45 Rest of Africa: Market Size, By Application, 2015�2022 (USD Million)
Table 46 The Middle East: Market Size, By Service Type, 2015�2022 (USD Million)
Table 47 The Middle East: Market Size, By Application, 2015�2022 (USD Million)
Table 48 The Middle East: Market Size, By Reservoir Type, 2015�2022 (USD Million)
Table 49 The Middle East: Market Size, By Country, 2015�2022 (USD Million)
Table 50 Saudi Arabia: Market Size, By Application, 2015�2022 (USD Million)
Table 51 Iran: Market Size, By Application, 2015�2022 (USD Million)
Table 52 Kuwait: Market Size, By Application, 2015�2022 (USD Million)
Table 53 U.A.E.: Market Size, By Application, 2015�2022 (USD Million)
Table 54 The Rest of the Middle East: Market Size, By Application, 2015�2022 (USD Million)
Table 55 South America: Market Size, By Service Type, 2015�2022 (USD Million)
Table 56 South America: Market Size, By Application, 2015�2022 (USD Million)
Table 57 South America: Market Size, By Reservoir Type, 2015�2022 (USD Million)
Table 58 South America: Market Size, By Country, 2015�2022 (USD Million)
Table 59 Venezuela: Market Size, By Application, 2015�2022 (USD Million)
Table 60 Argentina: Market Size, By Application, 2015�2022 (USD Million)
Table 61 Brazil: Market Size, By Application, 2015�2022 (USD Million)
Table 62 Colombia: Market Size, By Application, 2015�2022 (USD Million)
Table 63 Rest of South America: Market Size, By Application, 2015�2022 (USD Million)
List of Figures (46 Figures)
Figure 1 Markets Covered: Reservoir Analysis
Figure 2 Reservoir Anlysis Market: Research Design
Figure 3 Breakdown of Primary Interviews: By Company, Designation, & Region
Figure 4 Market Size Estimation Methodology: Top-Down Approach
Figure 5 Market Size Estimation Methodology: Bottom-Up Approach
Figure 6 Reservoir Analysis Region-Wise Market Share (Value), 2017
Figure 7 The Markets in North America & Asia-Pacific are Expected to Dominate the Market During the Forecast Period
Figure 8 Data Acquistion & Monitoring Services to Remain the Largest Market for Market During the Forecast Period
Figure 9 Conventional Segment to Remain the Largest Market for Reservoir Analysis Marekt During the Forecast Period
Figure 10 Attractive Market Opportunities in the Market
Figure 11 Onshore Application to Dominate the Market During the Forecast Period
Figure 12 Data Acquisition & Monitoring Services is Expected to Dominate the Market, 2022
Figure 13 Conventional Segment Held the Largest Market Share in 2016
Figure 14 Market Share (Value), By Region, 2022
Figure 15 Oil Consumption in BRICS Economies, 2014 &2015
Figure 16 Market Share (Value), By Application, 2016
Figure 17 Onshore Application Would Drive the Growth of the Market, 2017 & 2022
Figure 18 Onshore Market Share (Value), By Region, 2016
Figure 19 Offshore Market Share (Value), By Region, 2016
Figure 20 Market Share (Value), By Service, 2016
Figure 21 Reservoir Simulation & Geo Modeling Process
Figure 22 The Conventional Segment is Expected to Account for the Largest Market Share During the Forecast Period
Figure 23 North America to Dominate the Conventional Segment in 2016
Figure 24 Regional Snapshot (2016): the Markets in North America & Asia-Pacific are Emerging as New Hotspots
Figure 25 North America: the Fastest Growing Market, 2017 & 2022
Figure 26 North America: Market Overview
Figure 27 Asia-Pacific: Market Overview
Figure 28 Norway: the Fastest Growing European Market, 2017�2022
Figure 29 Algeria: the Largest Market in Africa, in 2016
Figure 30 Argentina: the Fastest Growing South American Market, 2017 & 2022
Figure 31 Companies Adopted New Product Launches and Contracts and Agreements as Key Growth Strategies, 2013�2017
Figure 32 Schlumberger Limited is Top Ranking Company in Market, in 2016
Figure 33 Market Evaluation Framework, 2013�2017
Figure 34 Battle for Market Share (2013�2017): New Product & Technology Launches Was the Key Strategy Adopted By the Players in the Market
Figure 35 Market: Vendor Dive Matrix
Figure 36 Schlumberger Limited: Company Snapshot (2016)
Figure 37 Halliburton Company: Company Snapshot (2016)
Figure 38 Baker Hughes Incorporated: Company Snapshot (2016)
Figure 39 Weatherford International, PLC: Company Snapshot (2016)
Figure 40 SGS SA: Company Snapshot (2016)
Figure 41 ALS Oil & Gas: Company Snapshot (2016)
Figure 42 CGG SA: Company Snapshot (2016)
Figure 43 Core Laboratories: Company Snapshot (2016)
Figure 44 Expro Group: Company Snapshot (2016)
Figure 45 Intertrek: Company Snapshot
Figure 46 Trican Well Service Limited: Company Snapshot


Growth opportunities and latent adjacency in Reservoir Analysis Market