Internet of Things (IoT) in Retail Market by Platform (Device Management and Application Enablement), Hardware, Service, Application (Smart Shelf, Asset Management, Customer Experience Management, and Geomarketing), and Region - Global Forecast to 2025


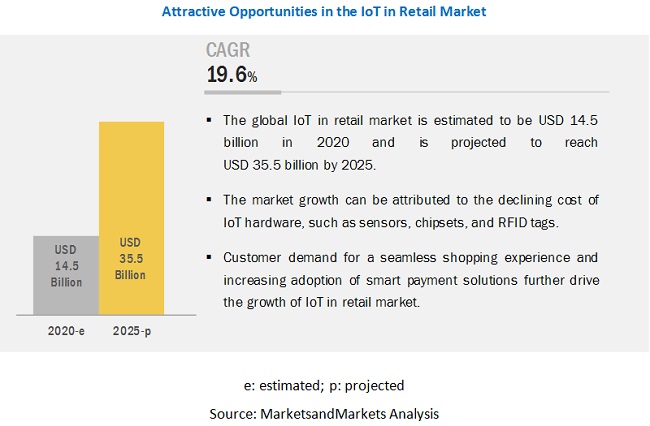
Global Internet of Things (IoT) in Retail Market is projected to reach USD 35.5 billion by 2025, increasing from USD 14.5 billion in 2020, with the CAGR of 19.6% during the period of 2020 to 2025. The base year for estimation is 2020, and the historical data spans from 2021 to 2025. Key factors driving the growth of the market include rapidly declining cost of IoT sensors and hardware, customer demand for a seamless shopping experience, and increasing adoption of smart payment solutions.
By platform, the device management segment to hold the largest market size in 2020
The IoT in retail market by platform has been segmented into device management, application enablement, and connectivity management. By platform, the device management platform is estimated to hold the highest market share of the IoT in the retail Industry, due to the increasing use of IoT-based end points and devices.
By application, the operations management segment to hold the largest market size in 2020
The IoT in retail market by application has been segmented into operations management, asset management, customer experience management, and advertising and marketing. The operations management application is projected to lead the IoT in retail market in terms of market share as it includes core operations, such as supply chain optimization, workforce management, and surveillance and security.
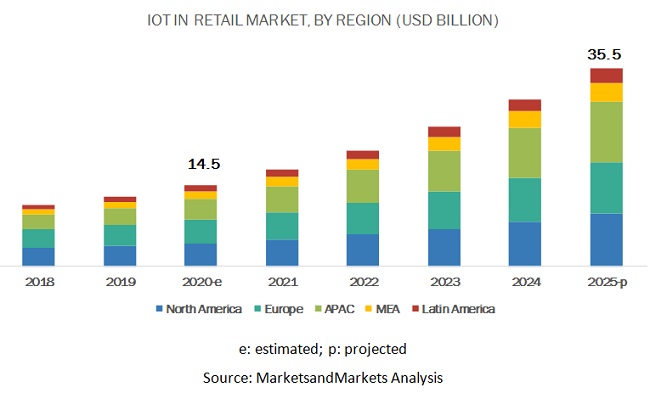
Asia Pacific to hold the highest CAGR during the forecast period
The global IoT in retail market covers five major geographic regions: North America, Europe, Asia Pacific (APAC), Middle East and Africa (MEA), and Latin America. APAC is expected to have the highest growth potential in the IoT in retail market during the forecast period. This growth can be attributed to the ongoing smart city initiatives and the rapidly declining cost of sensors in the region. China has a huge adoption of IoT technologies. India, on the other hand, is showcasing a high growth rate owing to ongoing smart city initiatives and rising population in the country.
list of Top Companies in Internet of Things (IoT) in Retail Industry
The IoT in retail market comprises key solution providers, such as Cisco (US), IBM (US), Intel (US), Microsoft (US), PTC (US), Huawei (China), Sierra Wireless (Canada), AWS (US), SAP (Germany), Software AG (Germany), Bosch.IO (Germany), Google (US), NEC Corporation (Japan), Oracle (US), AT&T (US), Vodafone (UK), Happiest Minds (India), Telit (UK), and Allerin (India).
The study includes an in-depth competitive analysis of key players in the IoT in retail market with their company profiles, recent developments, and key market strategies.
Scope of the Report
|
Report Metric |
Details |
|
Market size available for years |
2018–2025 |
|
Base year considered |
2019 |
|
Forecast period |
2020–2025 |
|
Forecast units |
Billion (USD) |
|
Segments covered |
By offering, application, and region |
|
Geographies covered |
North America, Europe, APAC, Latin America, and MEA |
|
List of Companies in Internet of Things (IoT) in Retail Industry |
Cisco (US), IBM (US), Intel (US), Microsoft (US), PTC (US), Huawei (China), Sierra Wireless (Canada), AWS (US), SAP (Germany), Software AG (Germany), Bosch.IO (Germany), Google (US), NEC Corporation (Japan), Oracle (US), AT&T (US), Vodafone (UK), Happiest Minds (India), Telit (UK), and Allerin (India) |
The research report categorizes the IoT in retail market based on offering and region.
Based on offering, the IoT in retail market has the following segments:
-
Hardware
- Beacon
- Sensors
- Gateway
- Radio-frequency Identification (RFID)
-
Platforms
- Device Management
- Application Management
- Connectivity Management
-
Service
- Professional Services
- Consulting
- System Integration and Deployment
- Support and Maintenance
- Managed Services
-
Applications
-
Operations Management
- Energy Optimization
- Supply Chain Optimization
- Surveillance and Security
- Inventory Optimization
- Workforce Management
-
Asset Management
- Asset Condition Monitoring
- Predictive Equipment Maintenance
-
Customer Experience Management
- Smart Payment and Checkout
- Queue Management
- Automatic Vending Machine
- Smart Shelves
-
Advertising and Marketing
- Geomarketing
- Digital Signage
-
Operations Management
Based on region, the IoT in retail market has the following segments:
-
North America
- United States (US)
- Canada
-
Europe
- United Kingdom (UK)
- Rest of Europe (includes Germany, France, Russia, Germany, Spain, Belgium, and Italy)
-
APAC
- China
- Rest of APAC (includes Japan, India, Singapore, Australia, New Zealand, South Korea, Thailand, and Singapore)
- MEA
- Latin America
Frequently Asked Questions (FAQ):
How much is the IoT in Retail Market?
What is the growth rate of IoT in Retail Market?
Who will be the leading hub for Internet of Things in Retail Market?
Who are the key players in IoT in Retail Market?
What are the benefits of IoT in Retail Market?
What is the future of IoT in Retail Market?
To speak to our analyst for a discussion on the above findings, click Speak to Analyst
 Exclusive indicates content/data unique to MarketsandMarkets and not available with any competitors.
Table of Contents
1 Introduction (Page No. - 19)
1.1 Objectives of the Study
1.2 Market Definition
1.2.1 Inclusions and Exclusions
1.3 Market Scope
1.3.1 Market Segmentation
1.3.2 Years Considered for the Study
1.4 Currency Considered
1.5 Stakeholders
2 Research Methodology (Page No. - 22)
2.1 Research Data
2.1.1 Secondary Data
2.1.2 Primary Data
2.2 Market Breakup and Data Triangulation
2.2.1 Key Industry Insights
2.3 Market Size Estimation
2.4 Market Forecast
2.5 Competitive Leadership Mapping Methodology
2.6 Assumptions for the Study
3 Executive Summary (Page No. - 31)
4 Premium Insights (Page No. - 35)
4.1 Attractive Market Opportunities in the IoT in Retail Market
4.2 Market, By Offering, 2020
4.3 Market, By Application, 2018–2025
4.4 Market, By Service, 2020 vs 2025
4.5 Market Investment Scenario
5 Market Overview and Industry Trends (Page No. - 38)
5.1 Market Overview
5.2 Market Dynamics
5.2.1 Drivers
5.2.1.1 Customer Demand for A Seamless Shopping Experience
5.2.1.2 Rapidly Declining Cost of Iot-Based Sensors and Connectivity
5.2.1.3 Increasing Adoption of Smart Payment Solutions
5.2.2 Restraints
5.2.2.1 Security Concerns Due to Vast Data Flow
5.2.2.2 Lack of Interoperability and Common Standards
5.2.3 Opportunities
5.2.3.1 Integrated IoT Solution to Open New Revenue Streams
5.2.3.2 Increased Investment in Retail Automation Providing Wholesome Opportunities for Analytics Providers
5.2.4 Challenges
5.2.4.1 Apprehension of Retailers in Switching to New Technologies Due to High Implementation Cost
5.3 Regulatory Implications
5.3.1 ISO Standards
5.3.1.1 ISO/IEC JTC 1
5.3.1.2 ISO/IEC JTC 1/SWG 5
5.3.1.3 ISO/IEC JTC 1SC 31
5.3.1.4 ISO/IEC JTC 1/SC 27
5.3.1.5 ISO/IEC JTC 1/WG 7 Sensors
5.3.2 IEEE
5.3.3 CEN/ISO
5.3.3.1 CEN/CENELEC
5.3.4 ETSI
5.3.5 ITU-T
5.4 Use Cases
5.4.1 Use Case 1: IBM Helped Bison Schweiz AG to Use Electronic Shelf Labels in Reducing the Burden of Changing Price Tags
5.4.2 Use Case 2: Cisco Helped Domino’s Pizza Innovate Its Digital Ordering System By Providing Its Technology Infrastructure
5.4.3 Use Case 3: Amazon Web Services Helped Brooks Brothers Deploy and Operate Its SAP Environments
5.4.4 Use Case 4: Google Helped Conrad Electronic to Develop A Reliable Cloud Infrastructure
6 IoT in Retail Market, By Offering (Page No. - 47)
6.1 Introduction
6.2 Hardware
6.2.1 Beacons
6.2.2 Sensors
6.2.3 Gateways
6.2.4 Radio Frequency Identification
6.3 Platforms
6.3.1 Device Management
6.3.1.1 Device Management: IoT in Retail Industry Drivers
6.3.2 Application Enablement
6.3.2.1 Application Enablement: Market Drivers
6.3.3 Connectivity Management
6.3.3.1 Connectivity Management: Market Drivers
6.4 Services
6.4.1 Professional Services
6.4.1.1 Consulting Services
6.4.1.1.1 Consulting Services: IoT in Retail Market Drivers
6.4.1.2 System Integration and Deployment Services
6.4.1.2.1 System Integration and Deployment Services: Market Drivers
6.4.1.3 Support and Maintenance Services
6.4.1.3.1 Support and Maintenance Services: IoT in Retail Industry Drivers
6.4.2 Managed Services
7 IoT in Retail, By Application (Page No. - 61)
7.1 Introduction
7.2 Operations Management
7.2.1 Energy Optimization
7.2.1.1 Energy Optimization: IoT in Retail Market Drivers
7.2.2 Supply Chain Optimization
7.2.2.1 Supply Chain Optimization: Market Drivers
7.2.3 Surveillance and Security
7.2.3.1 Surveillance and Security: Market Drivers
7.2.4 Inventory Optimization
7.2.4.1 Inventory Optimization: Market Drivers
7.2.5 Workforce Management
7.2.5.1 Workforce Management: Market Drivers
7.3 Asset Management
7.3.1 Asset Condition Monitoring
7.3.1.1 Asset Condition Monitoring: Market Drivers
7.3.2 Predictive Equipment Maintenance
7.3.2.1 Predictive Equipment Maintenance: Market Drivers
7.4 Customer Experience Management
7.4.1 Smart Payment and Checkout
7.4.1.1 Smart Payment and Checkout: Market Drivers
7.4.2 Queue Management
7.4.2.1 Queue Management: Market Drivers
7.4.3 Automatic Vending Machine
7.4.3.1 Automatic Vending Machine: IoT in Retail Industry Drivers
7.4.4 Smart Shelves
7.4.4.1 Smart Shelves: Market Drivers
7.5 Advertising and Marketing
7.5.1 Geomarketing
7.5.1.1 Geomarketing: Market Drivers
7.5.2 Digital Signage
7.5.2.1 Digital Signage: Market Drivers
8 Geographic Analysis (Page No. - 81)
8.1 Introduction
8.2 North America
8.2.1 United States
8.2.1.1 United States: Market Drivers
8.2.2 Canada
8.2.2.1 Canada: IoT in Retail Market Drivers
8.3 Europe
8.3.1 United Kingdom
8.3.1.1 United Kingdom: IoT in Retail Industry Drivers
8.3.2 Rest of Europe
8.4 Asia Pacific
8.4.1 China
8.4.1.1 China: IoT in Retail Market Drivers
8.4.2 Rest of Asia Pacific
8.5 Middle East and Africa
8.6 Latin America
9 Competitive Landscape (Page No. - 116)
9.1 Introduction
9.2 Competitive Leadership Mapping
9.3 Evaluation Criteria
9.3.1 Visionary Leaders
9.3.2 Dynamic Differentiators
9.3.3 Innovators
9.3.4 Emerging Companies
10 Company Profiles (Page No. - 118)
10.1 Introduction
(Business Overview, Solutions and Services Offered, Recent Developments, SWOT Analysis)*
10.2 Cisco
10.3 IBM
10.4 Intel
10.5 Microsoft
10.6 PTC
10.7 Huawei
10.8 Sierra Wireless
10.9 Amazon Web Services
10.10 SAP
10.11 Software AG
10.12 Accenture
10.13 Bosch.Io
10.14 Google
10.15 NEC Corporation
10.16 Oracle
10.17 AT&T
10.18 Vodafone
10.19 Happiest Minds
10.20 Telit
10.21 Allerin
10.22 Right-To-Win
*Details on Business Overview, Solutions and Services Offered, Recent Developments, SWOT Analysis Might Not Be Captured in Case of Unlisted Companies.
11 Appendix (Page No. - 153)
11.1 Discussion Guide
11.2 Available Customization
11.3 Related Reports
11.4 Author Details
List of Tables (115 Tables)
Table 1 United States Dollar Exchange Rate, 2016–2019
Table 2 Factor Analysis
Table 3 IoT in Retail Market Size, By Offering, 2018–2025 (USD Million)
Table 4 Hardware: Market Size, By Region, 2018–2025 (USD Million)
Table 5 Platforms: Market Size, By Type, 2018–2025 (USD Million)
Table 6 Platforms: Market Size, By Region, 2018–2025 (USD Million)
Table 7 Device Management Market Size, By Region, 2018–2025 (USD Million)
Table 8 Application Enablement Market Size, By Region, 2018–2025 (USD Million)
Table 9 Connectivity Management Market Size, By Region, 2018–2025 (USD Million)
Table 10 Services: Market Size, By Type, 2018–2025 (USD Million)
Table 11 Services: Market Size, By Region, 2018–2025 (USD Million)
Table 12 Professional Services: Market Size, By Type, 2018–2025 (USD Million)
Table 13 Professional Services: Market Size, By Region, 2018–2025 (USD Million)
Table 14 Consulting Services Market Size, By Region, 2018–2025 (USD Million)
Table 15 System Integration and Deployment Services Market Size, By Region, 2018–2025 (USD Million)
Table 16 Support and Maintenance Services Market Size, By Region, 2018–2025 (USD Million)
Table 17 Managed Services: Market Size, By Region, 2018–2025 (USD Million)
Table 18 IoT in Retail Market Size, By Application, 2018–2025 (USD Million)
Table 19 Operations Management: Market Size, By Type, 2018–2025 (USD Million)
Table 20 Operations Management: Market Size, By Region, 2018–2025 (USD Million)
Table 21 Energy Optimization Market Size, By Region, 2018–2025 (USD Million)
Table 22 Supply Chain Optimization Market Size, By Region, 2018–2025 (USD Million)
Table 23 Surveillance and Security Market Size, By Region, 2018–2025 (USD Million)
Table 24 Inventory Optimization Market Size, By Region, 2018–2025 (USD Million)
Table 25 Workforce Management Market Size, By Region, 2018–2025 (USD Million)
Table 26 Asset Management: Market Size, By Type, 2018–2025 (USD Million)
Table 27 Asset Management: Market Size, By Region, 2018–2025 (USD Million)
Table 28 Asset Condition Monitoring Market Size, By Region, 2018–2025 (USD Million)
Table 29 Predictive Equipment Maintenance Market Size, By Region, 2018–2025 (USD Million)
Table 30 Customer Experience Management: Market Size, By Type, 2018–2025 (USD Million)
Table 31 Customer Experience Management: Market Size, By Region, 2018–2025 (USD Million)
Table 32 Smart Payment and Checkout Market Size, By Region, 2018–2025 (USD Million)
Table 33 Queue Management Market Size, By Region, 2018–2025 (USD Million)
Table 34 Automatic Vending Machine Market Size, By Region, 2018–2025 (USD Million)
Table 35 Smart Shelves Market Size, By Region, 2018–2025 (USD Million)
Table 36 Advertising and Marketing: Market Size, By Type, 2018–2025 (USD Million)
Table 37 Advertising and Marketing: Market Size, By Region, 2018–2025 (USD Million)
Table 38 Geomarketing Market Size, By Region, 2018–2025 (USD Million)
Table 39 Digital Signage Market Size, By Region, 2018–2025 (USD Million)
Table 40 IoT in Retail Market Size, By Region, 2018–2025 (USD Million)
Table 41 North America: Market Size, By Offering, 2018–2025 (USD Million)
Table 42 North America: Market Size, By Platform, 2018–2025 (USD Million)
Table 43 North America: Market Size, By Service, 2018–2025 (USD Million)
Table 44 North America: Market Size, By Professional Service, 2018–2025 (USD Million)
Table 45 North America: Market Size, By Application, 2018–2025 (USD Million)
Table 46 North America: Market Size, By Operations Management, 2018–2025 (USD Million)
Table 47 North America: Market Size, By Asset Management, 2018–2025 (USD Million)
Table 48 North America: Market Size, By Customer Experience Management, 2018–2025 (USD Million)
Table 49 North America: Market Size, By Advertising and Marketing, 2018–2025 (USD Million)
Table 50 North America: Market Size, By Country, 2018–2025 (USD Million)
Table 51 United States: IoT in Retail Market Size, By Offering, 2018–2025 (USD Million)
Table 52 United States: Market Size, By Platform, 2018–2025 (USD Million)
Table 53 United States: Market Size, By Service, 2018–2025 (USD Million)
Table 54 United States: Market Size, By Professional Service, 2018–2025 (USD Million)
Table 55 United States: Market Size, By Application, 2018–2025 (USD Million)
Table 56 United States: Market Size, By Operations Management, 2018–2025 (USD Million)
Table 57 United States: Market Size, By Asset Management, 2018–2025 (USD Million)
Table 58 United States: Market Size, By Customer Experience Management, 2018–2025 (USD Million)
Table 59 United States: Market Size, By Advertising and Marketing, 2018–2025 (USD Million)
Table 60 Europe: IoT in Retail Market Size, By Offering, 2018–2025 (USD Million)
Table 61 Europe: Market Size, By Platform, 2018–2025 (USD Million)
Table 62 Europe: Market Size, By Service, 2018–2025 (USD Million)
Table 63 Europe: Market Size, By Professional Service, 2018–2025 (USD Million)
Table 64 Europe: Market Size, By Application, 2018–2025 (USD Million)
Table 65 Europe: Market Size, By Operations Management, 2018–2025 (USD Million)
Table 66 Europe: Market Size, By Asset Management, 2018–2025 (USD Million)
Table 67 Europe: Market Size, By Customer Experience Management, 2018–2025 (USD Million)
Table 68 Europe: Market Size, By Advertising and Marketing, 2018–2025 (USD Million)
Table 69 Europe: Market Size, By Country, 2018–2025 (USD Million)
Table 70 United Kingdom: IoT in Retail Market Size, By Offering, 2018–2025 (USD Million)
Table 71 United Kingdom: Market Size, By Platform, 2018–2025 (USD Million)
Table 72 United Kingdom: Market Size, By Service, 2018–2025 (USD Million)
Table 73 United Kingdom: Market Size, By Professional Service, 2018–2025 (USD Million)
Table 74 United Kingdom: Market Size, By Application, 2018–2025 (USD Million)
Table 75 United Kingdom: Market Size, By Operations Management, 2018–2025 (USD Million)
Table 76 United Kingdom: Market Size, By Asset Management, 2018–2025 (USD Million)
Table 77 United Kingdom: Market Size, By Customer Experience Management, 2018–2025 (USD Million)
Table 78 United Kingdom: Market Size, By Advertising and Marketing, 2018–2025 (USD Million)
Table 79 Asia Pacific: IoT in Retail Market Size, By Offering, 2018–2025 (USD Million)
Table 80 Asia Pacific: Market Size, By Platform, 2018–2025 (USD Million)
Table 81 Asia Pacific: Market Size, By Service, 2018–2025 (USD Million)
Table 82 Asia Pacific: Market Size, By Professional Service, 2018–2025 (USD Million)
Table 83 Asia Pacific: Market Size, By Application, 2018–2025 (USD Million)
Table 84 Asia Pacific: Market Size, By Operations Management, 2018–2025 (USD Million)
Table 85 Asia Pacific: Market Size, By Asset Management, 2018–2025 (USD Million)
Table 86 Asia Pacific: Market Size, By Customer Experience Management, 2018–2025 (USD Million)
Table 87 Asia Pacific: Market Size, By Advertising and Marketing, 2018–2025 (USD Million)
Table 88 Asia Pacific: Market Size, By Country, 2018–2025 (USD Million)
Table 89 China: IoT in Retail Market Size, By Offering, 2018–2025 (USD Million)
Table 90 China: Market Size, By Platform, 2018–2025 (USD Million)
Table 91 China: Market Size, By Service, 2018–2025 (USD Million)
Table 92 China: Market Size, By Professional Service, 2018–2025 (USD Million)
Table 93 China: Market Size, By Application, 2018–2025 (USD Million)
Table 94 China: Market Size, By Operations Management, 2018–2025 (USD Million)
Table 95 China: Market Size, By Asset Management, 2018–2025 (USD Million)
Table 96 China: Market Size, By Customer Experience Management, 2018–2025 (USD Million)
Table 97 China: Market Size, By Advertising and Marketing, 2018–2025 (USD Million)
Table 98 Middle East and Africa: IoT in Retail Market Size, By Offering, 2018–2025 (USD Million)
Table 99 Middle East and Africa: Market Size, By Platform, 2018–2025 (USD Million)
Table 100 Middle East and Africa: Market Size, By Service, 2018–2025 (USD Million)
Table 101 Middle East and Africa: Market Size, By Professional Service, 2018–2025 (USD Million)
Table 102 Middle East and Africa: Market Size, By Application, 2018–2025 (USD Million)
Table 103 Middle East and Africa: Market Size, By Operations Management, 2018–2025 (USD Million)
Table 104 Middle East and Africa: Market Size, By Asset Management, 2018–2025 (USD Million)
Table 105 Middle East and Africa: Market Size, By Customer Experience Management, 2018–2025 (USD Million)
Table 106 Middle East and Africa: Market Size, By Advertising and Marketing, 2018–2025 (USD Million)
Table 107 Latin America: IoT in Retail Market Size, By Offering, 2018–2025 (USD Million)
Table 108 Latin America: Market Size, By Platform, 2018–2025 (USD Million)
Table 109 Latin America: Market Size, By Service, 2018–2025 (USD Million)
Table 110 Latin America: Market Size, By Professional Service, 2018–2025 (USD Million)
Table 111 Latin America: Market Size, By Application, 2018–2025 (USD Million)
Table 112 Latin America: Market Size, By Operations Management, 2018–2025 (USD Million)
Table 113 Latin America: Market Size, By Asset Management, 2018–2025 (USD Million)
Table 114 Latin America: Market Size, By Customer Experience Management, 2018–2025 (USD Million)
Table 115 Latin America: IoT in Retail Market Size, By Advertising and Marketing, 2018–2025 (USD Million)
List of Figures (43 Figures)
Figure 1 IoT in Retail Market: Research Design
Figure 2 Market Size Estimation Methodology—Approach 1 (Supply Side): Revenue of Hardware/Platforms/Services of IoT in Retail Vendors
Figure 3 Market Size Estimation Methodology—Approach 1 Bottom-Up (Supply Side): Collective Revenue of All Platforms of IoT in Retail Vendors
Figure 4 Market Size Estimation Methodology—Approach 2 Top-Down: Share of Retail Through the Overall IoT Spending
Figure 5 Competitive Leadership Mapping Matrix: Criteria Weightage
Figure 6 Market to Witness A High Growth During the Forecast Period
Figure 7 Top 3 Leading Segments in the IoT in Retail Market in 2020
Figure 8 IoT in Retail: Regional Market Scenario
Figure 9 Declining Cost of Hardware Components to Drive the IoT in Retail Market Growth
Figure 10 Hardware Segment to Hold the Highest Market Share in 2020
Figure 11 Operations Management Application to Lead the Market During the Forecast Period
Figure 12 Professional Services Segment to Hold A Higher Market Share During the Forecast Period
Figure 13 Asia Pacific to Be the Best Market for Investment During the Forecast Period
Figure 14 Drivers, Restraints, Opportunities, and Challenges: Market
Figure 15 Declining Price of Sensors in the Past 15 Years
Figure 16 Services Segment to Grow at the Highest CAGR During the Forecast Period
Figure 17 Application Enablement Platform to Grow at the Highest CAGR During the Forecast Period
Figure 18 Managed Services Segment to Grow at A Higher CAGR During the Forecast Period
Figure 19 Support and Maintenance Services Segment to Grow at the Highest CAGR During the Forecast Period
Figure 20 Customer Experience Management Segment to Grow at the Highest CAGR During the Forecast Period
Figure 21 Surveillance and Security Segment to Grow the Highest CAGR During the Forecast Period
Figure 22 Predictive Equipment Maintenance Segment to Grow at A Higher CAGR During the Forecast Period
Figure 23 Smart Shelves Segment to Grow at the Highest CAGR During the Forecast Period
Figure 24 Geomarketing to Grow at A Higher CAGR During the Forecast Period
Figure 25 Asia Pacific to Grow at the Highest CAGR During the Forecast Period
Figure 26 Asia Pacific to Grow at the Fastest Growth Rate During the Forecast Period
Figure 27 Europe: Market Snapshot
Figure 28 Asia Pacific: Market Snapshot
Figure 29 IoT in Retail Market (Global) Competitive Leadership Mapping, 2020
Figure 30 Cisco: Company Snapshot
Figure 31 Cisco: SWOT Analysis
Figure 32 IBM: Company Snapshot
Figure 33 IBM: SWOT Analysis
Figure 34 Intel: Company Snapshot
Figure 35 Intel: SWOT Analysis
Figure 36 Microsoft: Company Snapshot
Figure 37 Microsoft: SWOT Analysis
Figure 38 PTC: Company Snapshot
Figure 39 PTC: SWOT Analysis
Figure 40 Huawei: Company Snapshot
Figure 41 Sierra Wireless: Company Snapshot
Figure 42 SAP: Company Snapshot
Figure 43 Software AG: Company Snapshot
The study consisted of four major activities to estimate the current market size of the Internet of Things (IoT) in retail market. An extensive secondary research was done to collect information on the market, the peer market, and the parent market. The next step was to validate these findings, assumptions, and market sizing with industry experts across the value chain through primary research. Both top-down and bottom-up approaches were employed to estimate the complete market size. Thereafter, the market breakup and data triangulation procedures were used to estimate the market size of the segments and subsegments of the IoT in retail market.
Secondary Research
In the secondary research process, various secondary sources, such as D&B Hoovers and Bloomberg BusinessWeek were referred to for identifying and collecting information for the study. Secondary sources included annual reports, press releases, and investor presentations of companies; whitepapers, certified publications such as Internet of Things Consortium, IoT M2M Council, and The Electronic Retailing Association (ERA), and articles by recognized authors; gold standard and silver standard websites; Research and Development (R&D) organizations; regulatory bodies; and databases.
Primary research
Various primary sources from both supply and demand sides of the IoT in retail market were interviewed to obtain qualitative and quantitative information for the study. The primary sources from the supply side included industry experts, such as Chief Executive Officers (CEOs), Vice Presidents (VPs), marketing directors, technology and innovation directors, and related key executives from various vendors of IoT in retail market solutions, associated service providers, and system integrators operating in the targeted regions. All possible parameters that affect the market covered in this research study have been accounted for, viewed in extensive detail, verified through primary research, and analyzed to get the final quantitative and qualitative data. Following is the profile breakup of primary respondents:
To know about the assumptions considered for the study, download the pdf brochure
Market Size Estimation
Both top-down and bottom-up approaches were used to estimate and validate the total size of the IoT in retail market. The methods were also used extensively to estimate the size of various subsegments in the market. The research methodology used to estimate the market size includes the following:
- Key players in the market were identified through extensive secondary research.
- The market size, in terms of value, was determined through primary and secondary research processes.
- All percentage shares, splits, and breakups were determined using secondary sources and verified through primary sources.
Data Triangulation
With data triangulation and validation through primary interviews, the exact value of the overall parent market size was determined and confirmed using the study. The overall market size was then used in the top-down procedure to estimate the size of other individual markets via percentage splits of the market segmentation.
Report objectives
- To define, describe, and forecast the IoT in retail market by offering (hardware, platforms, and services), application, and region
- To provide detailed information about the major factors (drivers, restraints, opportunities, and industry-specific challenges) influencing the market growth
- To analyze opportunities in the market and provide details of the competitive landscape for stakeholders and market leaders
- To forecast the market size of the segments with respect to five main regions: North America, Europe, Asia Pacific (APAC), Middle East and Africa (MEA), and Latin America
- To profile key players and comprehensively analyze their market rankings and core competencies
- To analyze competitive developments, such as acquisitions; new product launches and product enhancements; expansions; agreements, collaborations, and partnerships; and Research and Development (R&D) activities, in the market
Available Customizations
With the given market data, MarketsandMarkets offers customizations as per the company’s specific needs. The following customization options are available for the report:
Geographic Analysis
- Further breakup of the North American IoT in retail market
- Further breakup of the European market
- Further breakup of the APAC market
- Further breakup of the MEA market
- Further breakup of the Latin American IoT in retail market
Company Information
- Detailed analysis and profiling of additional market players (up to 5)


Growth opportunities and latent adjacency in Internet of Things (IoT) in Retail Market