Riot Control System Market by End User (Law Enforcement, Military), Product (Offensive Weapons, Defensive Weapons), Technology (Electromagnetic & Sonic Weapons, Kinetic Impact Weapons, Chemical Agents & Others) & Region - Global Forecast to 2035


Riot Control Systems Market
Riot Control Systems Market Summary
The global Riot Control Systems Market is estimated to reach approximately USD 7.40 billion in 2025 and is projected to grow to USD 15.80 billion by 2035, registering a CAGR of 7.9% during the forecast period. The market is experiencing steady growth driven by increasing urbanization, rising civil unrest incidents, and growing investments in public safety and law enforcement modernization. Riot control systems are essential tools used by police forces, military units, and security agencies to manage crowds, maintain order, and minimize the risk of casualties during protests and disturbances. The integration of artificial intelligence (AI), Internet of Things (IoT), and automation is transforming traditional riot control equipment into smart systems capable of real-time monitoring, predictive threat assessment, and enhanced operational coordination. Digital transformation across public safety infrastructures, combined with advancements in non-lethal technologies and surveillance systems, is significantly accelerating market growth globally.
Key Market Trends & Insights
The Riot Control Systems Market is evolving rapidly as governments and law enforcement agencies adopt advanced technologies to improve crowd management strategies. North America leads the market due to its advanced law enforcement infrastructure, strong regulatory frameworks, and high adoption of modern security solutions. Asia Pacific is the fastest-growing region, driven by rapid urbanization, increasing population density, and rising investments in public safety infrastructure.
Personal protective equipment and non-lethal weapons dominate the market, particularly for frontline law enforcement personnel. Systems such as tear gas launchers, rubber bullets, and electroshock devices are widely used. Emerging trends include acoustic devices, directed energy systems, and integrated crowd control platforms.
AI and automation are enhancing riot control capabilities by enabling real-time surveillance, predictive analytics, and automated response mechanisms. IoT integration is facilitating connectivity between devices, enabling centralized monitoring and improved coordination during operations.
Market Size & Forecast
-
Base year market size (2025): USD 7.40 billion
-
Forecast value by 2035: USD 15.80 billion
-
CAGR (2025–2035): 7.9%
-
Growth is driven by increasing civil unrest, law enforcement modernization, advancements in non-lethal technologies, and integration of AI and IoT
Riot Control Systems Market Top 10 key takeaway
-
The market is expected to more than double by 2035
-
Non-lethal systems dominate due to safety considerations
-
North America leads with advanced law enforcement infrastructure
-
Asia Pacific is the fastest-growing region globally
-
AI-driven surveillance is improving operational efficiency
-
IoT integration enables real-time coordination
-
Urbanization is increasing demand for crowd control solutions
-
Directed energy and acoustic systems are emerging trends
-
Government investments are driving market growth
-
Continuous innovation is intensifying competition
Product Insights
Non-lethal weapons and protective gear represent the leading product segments in the Riot Control Systems Market, driven by their effectiveness in managing crowds while minimizing harm. Products such as tear gas, pepper spray, rubber bullets, batons, and electroshock devices are widely used by law enforcement agencies to control riots and maintain public order.
Personal protective equipment (PPE), including helmets, shields, body armor, and gas masks, also plays a critical role in ensuring the safety of security personnel during operations. These products are essential for mitigating risks and enhancing operational effectiveness.
Emerging product categories include acoustic devices, which use high-intensity sound waves for crowd dispersal, and directed energy systems that provide non-lethal deterrence. AI integration is enabling smart riot control systems that can analyze crowd behavior, predict potential threats, and optimize response strategies.
Technology / Component Insights (Rename based on keyword if needed)
Technological advancements are at the core of the Riot Control Systems Market, with AI, IoT, cloud computing, and automation driving innovation. AI is enabling advanced surveillance capabilities, including facial recognition, behavior analysis, and predictive analytics, allowing authorities to anticipate and respond to potential threats more effectively.
IoT integration is facilitating real-time connectivity between devices, enabling seamless communication and coordination among law enforcement personnel. Connected systems are improving situational awareness and enabling centralized command and control.
Cloud-based platforms are supporting data storage and analytics, enabling agencies to monitor operations and optimize strategies. Automation technologies are improving manufacturing processes and ensuring consistent product quality. Future innovation trends include wearable riot control systems, integration with smart city infrastructure, and advancements in non-lethal technologies.
Application Insights
The law enforcement segment dominates the Riot Control Systems Market, driven by the increasing need for effective crowd management solutions in urban areas. Police forces and security agencies rely on riot control systems to maintain public order and ensure safety during protests and large gatherings.
Military applications are also significant, particularly in peacekeeping missions and border security operations. Riot control systems enable military forces to manage conflicts without resorting to lethal force.
Private security and event management sectors are emerging as growing application areas, particularly in large-scale events and high-risk environments. Future opportunities lie in integrating riot control systems with smart surveillance and urban security networks.
Regional Insights
North America leads the Riot Control Systems Market, supported by its advanced law enforcement infrastructure, strong regulatory environment, and high adoption of modern security technologies. The region continues to invest in innovative riot control solutions.
Europe is experiencing steady growth, driven by increasing focus on public safety, human rights considerations, and adoption of advanced policing technologies. Countries in this region are investing in modernizing their law enforcement capabilities.
Asia Pacific is the fastest-growing region, fueled by rapid urbanization, increasing population density, and rising investments in public safety infrastructure. Countries such as China and India are playing a key role in driving regional growth.
-
North America dominates due to advanced security infrastructure
-
Europe shows steady growth with public safety initiatives
-
Asia Pacific is the fastest-growing region globally
-
Urbanization is driving demand for crowd control solutions
-
Technological advancements are accelerating adoption
Country-Specific Market Trends
In Asia Pacific, China is witnessing a CAGR of approximately 8.8%, driven by large-scale investments in public safety and security technologies. Japan is also experiencing steady growth, supported by technological innovation and strong regulatory frameworks.
In North America, the United States remains the largest market, with a CAGR of around 7.6%, driven by continuous investment in law enforcement modernization. Canada and Mexico are also contributing to market growth through public safety initiatives.
In Europe, Germany and France are key markets, with CAGRs of approximately 7.4% and 7.2%, respectively. These countries are focusing on enhancing their security capabilities and adopting advanced riot control technologies.
-
China leads growth in Asia Pacific with strong public safety investments
-
Japan focuses on innovation and advanced technologies
-
The United States dominates the global market
-
Germany and France drive growth in Europe
-
Government policies and regulations are key growth drivers
Key Riot Control Systems Market Company Insights
The Riot Control Systems Market is highly competitive, with leading players focusing on innovation, product development, and technological integration. Companies such as Axon Enterprise, Safariland Group, Rheinmetall AG, Combined Systems Inc., Condor Non-Lethal Technologies, and Byrna Technologies are actively shaping the market landscape.
These companies are investing heavily in research and development to introduce advanced riot control systems with improved effectiveness, safety, and reliability. AI integration, smart sensors, and connected technologies are key focus areas, enabling companies to deliver innovative solutions.
Strategic partnerships with government agencies and law enforcement organizations are helping these players expand their market presence and accelerate adoption. The focus on safety, accountability, and technological advancement is shaping competitive strategies.
-
Companies are investing in AI-driven riot control technologies
-
Strategic partnerships are enhancing market reach
-
Focus on smart and connected systems is increasing
-
R&D investments are driving innovation
-
Global expansion strategies are strengthening market presence
Recent Developments
Recent developments in the Riot Control Systems Market highlight the growing emphasis on advanced technologies and digital integration. Several companies have introduced next-generation non-lethal systems and protective equipment with enhanced performance and safety features.
In addition, partnerships between technology providers and law enforcement agencies are enabling the integration of IoT-based monitoring systems, improving operational efficiency and accountability. Governments are also increasing investments in public safety initiatives, further driving market growth.
Market Segmentation
The Riot Control Systems Market is segmented based on product, technology/component, application, and region. By product, the market includes non-lethal weapons, protective gear, and surveillance systems, with non-lethal weapons dominating due to their widespread use.
In terms of technology, the market encompasses traditional riot control systems, AI-enabled solutions, IoT-integrated platforms, and advanced non-lethal technologies. These technologies are driving improvements in performance, efficiency, and connectivity.
Applications are categorized into law enforcement, military, and private security. Regionally, the market is divided into North America, Europe, Asia Pacific, and the rest of the world.
-
Non-lethal weapons dominate the product segment
-
AI and IoT technologies are driving innovation
-
Law enforcement represents the largest application segment
-
Military and private security show strong growth potential
-
Asia Pacific is emerging as a key growth region
Conclusion
The Riot Control Systems Market is poised for steady growth through 2035, driven by increasing demand for effective and humane crowd management solutions. The integration of AI, IoT, and automation is transforming riot control systems into intelligent platforms capable of delivering real-time insights and enhancing operational efficiency.
As urbanization and security challenges continue to evolve, the demand for advanced riot control technologies will remain strong. Companies that invest in innovation and align their strategies with emerging trends will be well-positioned to capitalize on future opportunities. The market’s growth trajectory underscores its critical role in maintaining public safety and order.
FAQs
1. What is the current market size of the Riot Control Systems Market?
The market size is estimated at USD 7.40 billion in 2025.
2. What is the expected growth rate of the market?
The market is projected to grow at a CAGR of 7.9% from 2025 to 2035.
3. What are the key drivers of market growth?
Key drivers include increasing civil unrest, law enforcement modernization, AI integration, and IoT adoption.
4. Which region leads the Riot Control Systems Market?
North America is the leading region due to its advanced security infrastructure.
5. Who are the major players in the market?
Major players include Axon Enterprise, Safariland Group, Rheinmetall AG, Combined Systems Inc., Condor Non-Lethal Technologies, and Byrna Technologies.
 Exclusive indicates content/data unique to MarketsandMarkets and not available with any competitors.
Table of Contents
1 Introduction (Page No. - 17)
1.1 Objectives of the Study
1.2 Market Definition
1.3 Study Scope
1.3.1 Market Covered
1.3.2 Geaographical Scope
1.3.3 Years Consiedred for the Study
1.4 Currency & Pricing
1.5 Package Sizes
1.6 Distribution Channel Participants
1.7 Limitations
1.8 Market Stakeholders
2 Research Methodology (Page No. - 21)
2.1 Introduction
2.1.1 Secondary Data
2.1.1.1 Key Data From Secondary Sources
2.1.2 Primary Data
2.1.2.1 Key Data From Primary Sources
2.2 Factor Analysis
2.2.1 Introduction
2.2.2 Demand-Side Indicators
2.2.2.1 Greater Concentration on Homeland Security
2.2.2.2 Rising Political Disputes and Civil Unrest
2.2.3 Supply-Side Indicators
2.2.3.1 Drive to Maximize Efficacy and Minimize Liability
2.3 Market Size Estimation
2.3.1 Bottom-Up Approach
2.3.2 Top-Down Approach
2.4 Market Breakdown & Data Triangulation
2.5 Research Assumptions
3 Executive Summary (Page No. - 32)
4 Premium Insights (Page No. - 35)
4.1 Attractive Opportunities in Riot Control System Market, 2016-2021
4.2 Riot Control System Offensive Weapon Market, By Type
4.3 Life Cycle Analysis, By Technology
4.4 Riot Control System Market, By Product
4.4.1 North America Riot Control System Market
4.5 Global Riot Control System Market, By Region
5 Market Overview (Page No. - 39)
5.1 Introduction
5.2 Market Segmentation
5.2.1 By End User
5.2.2 By Product
5.2.3 By Technology
5.3 Market Dynamics
5.3.1 Drivers
5.3.1.1 Increasing Political Disputes and Civil Unrest
5.3.1.2 Militarization of Law Enforcement Agencies
5.3.2 Restraints
5.3.2.1 Stringent Environmental and Governmental Regulations
5.3.2.2 Declining Defense Budgets of Advanced Economies
5.3.3 Opportunities
5.3.3.1 Increase in Research & Development
5.3.3.2 Increasing Defense Expenditures of Emerging Economies
5.3.4 Challenges
5.3.4.1 Trafficking and Indiscriminate Use of Less Lethal Weapons
5.3.4.2 Apprehensions Among End Users
6 Industry Trends (Page No. - 49)
6.1 Introduction
6.2 Supply-Chain Analysis
6.2.1 Prominent Companies
6.2.2 Small Medium Enterprises (SMES)
6.2.3 End Users
6.2.4 Regulatory Bodies
6.2.5 Key Influencers
6.3 Value-Chain Analysis
6.4 Industry Trends
6.5 Technology Trends
6.5.1 Increasing Demand for Directed Energy Weapons (Dazzlers)
6.5.2 Active Denial Technology
6.5.3 Chemical Oxygen Iodine Laser
6.5.4 High Power Microwave Weapons
6.5.5 Malodorants
6.5.6 Calmative Agents
6.6 Porter’s Five Forces Analysis
6.6.1 Threat of New Entrants
6.6.2 Threat of Substitutes
6.6.3 Bargaining Power of Suppliers
6.6.4 Bargaining Power of Buyers
6.6.5 Intensity of Competitive Rivalry
6.7 Innovation & Patent Registrations
6.8 Key Trend Analysis
7 Riot Control System Market, By Product (Page No. - 58)
7.1 Introduction
7.2 Offensive Weapons
7.2.1 Direct Contact Weapons
7.2.1.1 Gases & Sprays
7.2.1.2 Ammunitions
7.2.1.3 Explosives
7.2.2 Directed Energy Weapons
7.2.2.1 Immobilizers
7.2.2.2 Crowd Control Weapons
7.3 Defensive Weapons
7.3.1 Personal Protective Equipment
7.3.2 Surveillance Systems (Drones)
8 Global Riot Control System Market, By End User (Page No. - 71)
8.1 Introduction
8.2 Law Enforcement Agencies
8.2.1 Police Forces
8.2.2 Special Forces
8.2.3 First Responders
8.2.4 Private Security
8.2.5 Intelligence Agency
8.3 Military
9 Riot Control System Market, By Technology (Page No. - 77)
9.1 Introduction
9.2 Electromagnetic & Sonic Weapons
9.3 Kinetic Impact Weapons
9.4 Chemical Agents
9.5 Others
10 Regional Analysis (Page No. - 83)
10.1 Introduction
10.2 North America
10.2.1 By Product
10.2.2 By Technology
10.2.3 By End User
10.2.4 By Country
10.2.4.1 U.S.
10.2.4.1.1 By Product
10.2.4.1.2 By Technology
10.2.4.1.3 By End User
10.2.4.2 Canada
10.2.4.2.1 By Product
10.2.4.2.2 By Technology
10.2.4.2.3 By End User
10.3 Europe
10.3.1 By Product
10.3.2 By Technology
10.3.3 By End User
10.3.4 By Country
10.3.4.1 U.K.
10.3.4.1.1 By Product
10.3.4.1.2 By Technology
10.3.4.1.3 By End User
10.3.4.2 Russia
10.3.4.2.1 By Product
10.3.4.2.2 By Technology
10.3.4.2.3 By End User
10.3.4.3 Germany
10.3.4.3.1 By Product
10.3.4.3.2 By Technology
10.3.4.3.3 By End User
10.3.4.4 France
10.3.4.4.1 By Product
10.3.4.4.2 By Technology
10.3.4.4.3 By End User
10.4 Asia-Pacific
10.4.1 By Product
10.4.2 By Technology
10.4.3 By End User
10.4.4 By Country
10.4.4.1 China
10.4.4.1.1 By Product
10.4.4.1.2 By Technology
10.4.4.1.3 By End User
10.4.4.2 India
10.4.4.2.1 By Product
10.4.4.2.2 By Technology
10.4.4.2.3 By End User
10.4.4.3 Australia
10.4.4.3.1 By Product
10.4.4.3.2 By Technology
10.4.4.3.3 By End User
10.5 The Middle East
10.5.1 By Product
10.5.2 By Technology
10.5.3 By End User
10.5.4 By Country
10.5.4.1 Saudi Arabia
10.5.4.1.1 By Product
10.5.4.1.2 By Technology
10.5.4.1.3 By End User
10.5.4.2 Israel
10.5.4.2.1 By Product
10.5.4.2.2 By Technology
10.5.4.2.3 By End User
10.5.4.3 Syria
10.5.4.3.1 By Product
10.5.4.3.2 By Technology
10.5.4.3.3 By End User
10.6 Latin America
10.6.1 By Product
10.6.2 By Technology
10.6.3 By End User
10.6.4 By Country
10.6.4.1 Brazil
10.6.4.1.1 By Product
10.6.4.1.2 By Technology
10.6.4.1.3 By End User
10.7 Africa
10.7.1 By Product
10.7.2 By Technology
10.7.3 By End User
10.7.4 By Country
10.7.4.1 South Africa
10.7.4.1.1 By Product
10.7.4.1.2 By Technology
10.7.4.1.3 By End User
11 Competitive Landscape (Page No. - 119)
11.1 Introduction
11.2 Brand Analysis
11.3 Product Mapping
11.4 Rank Analysis
11.5 Competitive Situations and Trends
11.5.1 Contracts
11.5.2 New Product Launch
11.5.3 Agreements, Acquisition, Partnerships, Collaborations, and Joint Ventures
11.5.4 Expansions
12 Company Profile (Page No. - 128)
12.1 Introduction
(Overview, Financials, Products & Services, Strategy, and Developments)*
12.2 BAE Systems, PLC.
12.3 Taser International, Inc.
12.4 Lrad Corporation
12.5 Raytheon Company
12.6 Combined Systems, Inc.
12.7 Nonlethal Technologies, Inc.
12.8 Lamperd Less Lethal Inc.
12.9 The Safariland Group
12.10 Amtec Less Lethal Systems Inc
12.11 Eagle Industries, Inc.
12.12 Condor Non-Lethal Technologies
12.13 Armament Systems & Procedures Inc.
12.14 Dae-Kwang Chemical Co. Ltd.
(Overview, Financials, Products & Services, Strategy, and Developments)*
13 Appendix (Page No. - 161)
13.1 Discussion Guide
13.2 Knowledge Store: Marketsandmarkets’ Subscription Portal
13.3 Introducing RT: Real Time Market Intelligence
13.4 Available Customization
13.4.1 Country-Level Analysis
13.4.2 Additional Company Profiles (Upto 5)
13.5 Related Reports
List of Tables (104 Tables)
Table 1 Study Years
Table 2 Few Incidents of Civil Unrest Across the Globe, April 2010-February 2016
Table 3 Mapping Non-Lethal Weapons of the U.S. Department of Defense and Department of Homeland Security
Table 4 Market Drivers : Regional Analysis
Table 5 Riot Control System Market, By End User
Table 6 Market, By Product
Table 7 Market, By Technology
Table 8 Market, By Region
Table 9 Weapons & Equipment Used By Swat Teams in the U.S.
Table 10 Riot Control System Market is Primarily Driven By Militarization of Law Enforcement Agencies
Table 11 Mapping Military Expenditures of Advanced Economies, 2011-2015 (USD Billion)
Table 12 Stringent Environmental and Government Regulations Act as A Major Restraint for the Riot Control System Market Growth
Table 13 Mapping Military Expenditures of Emerging Economies, 2011-2015 (USD Billion)
Table 14 Increasing Research and Development to Offer Significant Growth Opportunities in the Riot Control System Market
Table 15 Trafficking and Indiscriminate Use of Riot Control Systems are Posing Critical Challenges to the Market
Table 16 Recent Industry Trends in Riot Control System Market
Table 17 Details of Active Denial Systems Technology for Riot Control Systems
Table 18 Innovation & Patent Registrations, March 1973 - May 2006
Table 19 Market Size, By Product, 2015-2021 (USD Million)
Table 20 Offensive Weapons Riot Control System Market Size, By Product, 2015-2021 (USD Million)
Table 21 Riot Control System Market Size, By Direct Contact Weapons, 2015-2021(USD Million)
Table 22 Market Size, By Gases & Sprays, 2015-2021(USD Million)
Table 23 Market Size, By Ammunitions, 2015-2021(USD Million)
Table 24 Market Size, By Explosives , 2015-2021(USD Million)
Table 25 Market Size, By Directed Energy Weapons, 2015-2021 (USD Million)
Table 26 Riot Control Systems Market Size, By Personal Protective Equipment, 2015-2021 (USD Million)
Table 27 Drones Using Tear Gas to Control Riot Control
Table 28 Riot Control Systems Market Size, By End User, 2015-2021 (USD Million)
Table 29 Riot Control Systems Market Size, By Law Enforcement Agenecies, 2015-2021 (USD Million)
Table 30 Top Five Private Security Companies in the World
Table 31 Riot Control System Market Size, By Technology, 2015-2021 (USD Million)
Table 32 Electromagnetic & Sonic Riot Control System Market Size, By Region, 2015-2021 (USD Million)
Table 33 Kinetic Impact Riot Control System Market Size, By Region, 2015-2021 (USD Million)
Table 34 Chemical Agents Riot Control System Market, By Region, 2015-2021 (USD Million)
Table 35 North America: Riot Control Systems Market Size, By Product, 2015–2021 (USD Million)
Table 36 North America: Riot Control Systems Market Size, By Technology, 2015–2021 (USD Million)
Table 37 North America: Riot Control Systems Market Size, By End User, 2015–2021 (USD Million)
Table 38 North America: Riot Control Systems Market Size, By Country, 2015–2021 (USD Million)
Table 39 U.S.: Riot Control Systems Market Size, By Product, 2015–2021 (USD Million)
Table 40 U.S.: Riot Control Systems Market Size, By Technology, 2015–2021 (USD Million)
Table 41 U.S.: Riot Control Systems Market Size, By End User, 2015–2021 (USD Million)
Table 42 Canada: Riot Control Systems Market Size, By Product , 2015–2021 (USD Million)
Table 43 Canada: Riot Control Systems Market Size, By Technology, 2015–2021 (USD Million)
Table 44 Canada: Riot Control Systems Market Size, By End User, 2015–2021 (USD Million)
Table 45 Europe: Riot Control Systems Market Size, By Product, 2015–2021 (USD Million)
Table 46 Europe: Riot Control Systems Market Size, By Technology, 2015–2021 (USD Million)
Table 47 Europe: Riot Control Systems Market Size, By End User, 2015–2021 (USD Million)
Table 48 Europe: Riot Control System Market Size, By Country, 2015–2021 (USD Million)
Table 49 U.K.: Riot Control Systems Market Size, By Product, 2015–2021 (USD Million)
Table 50 U.K.: Riot Control Systems Market Size, By Technology, 2015–2021 (USD Million)
Table 51 U.K.: Riot Control Systems Market Size, By End User, 2015–2021 (USD Million)
Table 52 Russia: Riot Control Systems Market Size, By Product, 2015–2021 (USD Million)
Table 53 Russia: Riot Control Systems Market Size, By Technology, 2015–2021 (USD Million)
Table 54 Russia: Riot Control System Market Size, By End User, 2015–2021 (USD Million)
Table 55 Germany: Riot Control Systems Market Size, By Product, 2015–2021 (USD Million)
Table 56 Germany: Riot Control Systems Market Size, By Technology, 2015–2021 (USD Million)
Table 57 Germany: Riot Control Systems Market Size, By End User, 2015–2021 (USD Million)
Table 58 France: Riot Control Systems Market Size, By Product, 2015–2021 (USD Million)
Table 59 France: Riot Control Systems Market Size, By Technology, 2015–2021 (USD Million)
Table 60 France: Riot Control Systems Market Size, By End User, 2015–2021 (USD Million)
Table 61 APAC: Riot Control System Market Size, By Product, 2015–2021 (USD Million)
Table 62 APAC: Riot Control Systems Market Size, By Technology, 2015–2021 (USD Million)
Table 63 APAC: Riot Control Systems Market Size, By End User, 2015–2021 (USD Million)
Table 64 APAC: Riot Control System Market Size, By Country, 2015–2021 (USD Million)
Table 65 China: Riot Control Systems Market Size, By Product, 2015–2021 (USD Million)
Table 66 China: Riot Control Systems Market Size, By Technology, 2015–2021 (USD Million)
Table 67 China: Riot Control Systems Market Size, By End User, 2015–2021 (USD Million)
Table 68 India: Riot Control Systems Market Size, By Product, 2015–2021 (USD Million)
Table 69 India: Riot Control Systems Market Size, By Technology, 2015–2021 (USD Million)
Table 70 India: Riot Control System Market Size, By End User, 2015–2021 (USD Million)
Table 71 Australia: Riot Control Systems Market Size, By Product, 2015–2021 (USD Million)
Table 72 Australia: Riot Control Systems Market Size: By Technology, 2015–2021 (USD Million)
Table 73 Australia: Riot Control Systems Market Size, By End User, 2015–2021 (USD Million)
Table 74 The Middle East: Riot Control Systems Market Size, By Product, 2015–2021 (USD Million)
Table 75 The Middle East: Riot Control Systems Market, By Technology, 2015–2021 (USD Million)
Table 76 The Middle East: Riot Control Systems Market Size, By End User, 2015–2021 (USD Million)
Table 77 The Middle East: Riot Control System Market Size, By Country, 2015–2021 (USD Million)
Table 78 Saudi Arabia Riot Control Systems Market Size, By Product, 2015–2021 (USD Million)
Table 79 Saudi Arabia: Market Size, By Technology, 2015–2021 (USD Million)
Table 80 Saudi Arabia: Market Size, By End User, 2015–2021 (USD Million)
Table 81 Israel: Riot Control Systems Market Size, By Product, 2015–2021 (USD Million)
Table 82 Israel: Market Size, By Technology, 2015–2021 (USD Million)
Table 83 Israel: Market Size, By End User, 2015–2021 (USD Million)
Table 84 Syria: Riot Control Systems Market Size, By Product, 2015–2021 (USD Million)
Table 85 Syria: Market Size, By Technology, 2015–2021 (USD Million)
Table 86 Syria: Market Size, By End User 2015–2021 (USD Million)
Table 87 Latin America: Riot Control Systems Market Size, By Product, 2015–2021 (USD Million)
Table 88 Latin America: Market Size, By Technology, 2015–2021 (USD Million)
Table 89 Latin America: Market Size, By End User, 2015–2021 (USD Million)
Table 90 Latin America: Market Size, By Country, 2015–2021 (USD Million)
Table 91 Brazil: Riot Control Systems Market Size, By Product, 2015–2021 (USD Million)
Table 92 Brazil: Market Size, By Technology, 2015–2021 (USD Million)
Table 93 Brazil: Market Size, By End User, 2015–2021 (USD Million)
Table 94 Africa: Riot Control Systems Market Size, By Product, 2015–2021 (USD Million)
Table 95 Africa: Market Size, By Technology, 2015–2021 (USD Million)
Table 96 Africa: Market Size, By End User, 2015–2021 (USD Million)
Table 97 Africa: Market Size, By Country, 2015–2021 (USD Million)
Table 98 South Africa: Riot Control Systems Market Size, By Product , 2015–2021 (USD Million)
Table 99 South Africa: Riot Control Systems Market Size, By Technology, 2015–2021 (USD Million)
Table 100 South Africa: Riot Control Systems Market Size, By End User, 2015–2021 (USD Million)
Table 101 Contracts, June, 2011–June, 2016
Table 102 New Product Launches, January 2011–February,2016
Table 103 Agreements, Acquisition, Partnerships, Collaborations, and Joint Ventures, July 2011–February 2016
Table 104 Expansions, October 2014
List of Figures (61 Figures)
Figure 1 Research Flow
Figure 2 Research Design: Riot Control System Market
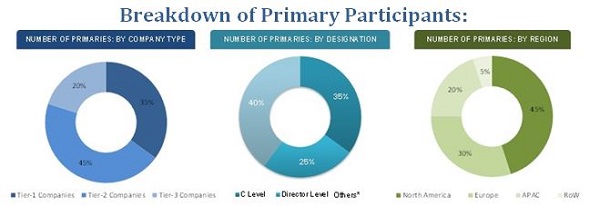
Figure 3 Break Down of Primary Interviews: By Company Type, Designation, & Region
Figure 4 U.S. : State-Wise Allocation of Military Grade Grenade Launchers to Law Enforcement Agencies
Figure 5 Market Size Estimation Methodology : Bottom-Up Approach
Figure 6 Market Size Estimation Methodology: Top-Down Approach
Figure 7 Data Triangulation
Figure 8 Assumptions of Research Study
Figure 9 Crowd Control Weapons Expected to Witness Highest CAGR From 2016 to 2021
Figure 10 Contracts, Agreements, Collaborations, Joint Ventures and Partnerships are the Key Growth Strategies Adopted By Riot Control Systems Market Players
Figure 11 Political Unrest Across the World Leads to the Growth of Riot Control System Market, 2016-2021
Figure 12 Directed Energy Weapon to Grow at A Highest Rate During the Forecast Period, 2016-2021
Figure 13 Electromagnetic and Sonic Weapons Technology is Expected to Be in the Increasing Growth Phase in Coming Five Years,2016-2021
Figure 14 Offensive Weapons Projected to Dominate the North American Market During the Forecast Period
Figure 15 Offensive Weapons Segment Estimated to Hold the Larger Share in the North America Market, 2015
Figure 16 APAC Market the Most Emerging Market for Riot Control System, During the Forecast Period
Figure 17 Market Segmentation : By End User
Figure 18 Market Segmentation: By Product
Figure 19 Market Segmentation: By Technology
Figure 20 Militarization of Law Enforcement Agencies to Drive the Riot Control System Market During the Forecast Period
Figure 21 Key Instances of Political Violence and Unrest in the Middle East
Figure 22 Supply Chain: Homeland Security is the Dominant End User Segment for Riot Control Systems
Figure 23 Value-Chain: Major Value is Added During R&D and Manufacturing Phases
Figure 24 Models of Dazzlers:
Figure 25 Porter’s Five Forces Analysis
Figure 26 Riot Control System Market, By Product
Figure 27 Offensive Weapons Market to Grow at the Fastest Rate During the Forecast Period
Figure 28 Offensive Weapons Market, By Product
Figure 29 Gases & Sprays to Witness High Demand in the Riot Control System Market During the Forecast Period
Figure 30 Tear Gas to Be the Fastest Growing Segment in the Gas and Sprays Market During the Forecast Period
Figure 31 Rubber Bullet to Dominate the Ammunitions Riot Control System Market During the Forecast Period
Figure 32 Stun Grenades to Dominate the Explosives Segment in Riot Control System Market During the Forecast Period
Figure 33 Crowd Control Weapons Market to Grow at the Highest Rate During the Forecast Period
Figure 34 Body Vests Market to Register Highest Growth Rate During the Forecast Period
Figure 35 Market, By End User
Figure 36 Market Size, By End User ,2016-2021 (USD Million)
Figure 37 Law Enforcement Agencies Riot Control Systems Market Size, By End User, 2016-2021 (USD Million)
Figure 38 Market, By Technology
Figure 39 Market Size, By Technology, 2016-2021 (USD Million)
Figure 40 Market, By Sub Type
Figure 41 Regional Snapshot : Growth Rate Analysis, 2016-2021
Figure 42 Market Snapshot: North America
Figure 43 Market Snapshot: Europe
Figure 44 Market Snapshot: APAC
Figure 45 Companies Adopted New Product Launches as Key Growth Strategy From 2011 to 2016
Figure 46 Brand Analysis of Top Riot Control System Market Players
Figure 47 Product Mapping of Top Riot Control System Market Players
Figure 48 Revenue and Product-Based Rank Analysis of Top Riot Control System Market Players
Figure 49 Riot Control Systems Market Evolution Framework, 2013 to 2015
Figure 50 Contracts and Agreements, Collaborations, Partnerships &Joint Ventures Were the Key Growth Strategies
Figure 51 Geographical Revenue Mix, 2015
Figure 52 Financial Highlights of Major Players in the Riot Control System Market
Figure 53 BAE Systems, PLC.: Company Snapshot
Figure 54 BAE Systems PLC.: SWOT Analysis
Figure 55 Taser International, Inc.: Company Snapshot
Figure 56 Taser International, Inc.: SWOT Analysis
Figure 57 Lrad Corporation : Company Snapshot
Figure 58 Lrad Corporation: SWOT Analysis
Figure 59 Raytheon Company: Company Snapshot
Figure 60 Raytheon: SWOT Analysis
Figure 61 Lamperd Less Lethal Inc.: Company Snapshot
All percentage shares, splits, and breakdowns were determined using secondary sources and verified through primary sources. All possible parameters that affect the market covered in this research study have been accounted for, viewed in extensive detail, verified through primary research, and analyzed to get the final quantitative and qualitative data. This data is consolidated, and added with detailed inputs and analysis from MarketsandMarkets, and presented in this report.
To know about the assumptions considered for the study, download the pdf brochure
The ecosystem of the riot control system market comprises raw material suppliers, manufacturers, distributors, and end users. The key end users in the market are law enforcement and military sectors. Some of the key players in the riot control system market include Taser International Manufacturing Company (U.S.), Combined Systems Inc. (U.S.), and The SAFARILAND Group (U.S.). These players are adopting strategies, such as new product developments, long-term contracts, and business expansion to strengthen their positions in the global riot control system market.
Target Audience
- Riot Control System Manufacturers
- Riot Control System Dealers
- Sub-component Manufacturers
- Technology Support Providers
“Furthermore, this study answers several questions for stakeholders; primarily, which segments to focus over the next five years for prioritizing efforts and investments.”
Scope of the Report
This research report categorizes the global riot control system market into the following segments and subsegments:
Global Riot Control System Market, By End User
- Law Enforcement
- Military
Global Riot Control System Market, By Product
- Defensive Weapons
- Offensive Weapons
Global Riot Control System Market, By Technology
- Electromagnetic
- Mechanical and Kinetic
- Chemical
- Others
Global Riot Control System Market, By Region
- North America
- Europe
- Middle East
- Asia-Pacific
- Latin America
- Africa
Customizations available for the report
With the given market data, MarketsandMarkets offers customizations as per specific needs of a company. The following customization options are available for the report:
-
Geographic Analysis
- Further breakdown of the Rest of Asia-Pacific market into Australia, Malaysia, and New Zealand, among others
-
Company Information
- Detailed analysis and profiling of additional market players (Upto 5)


Growth opportunities and latent adjacency in Riot Control System Market