Robotic Radiotherapy Market Size by Product (System, Software, 3D Camera), Technology (LINAC, Stereotactic, Particle Therapy), Application (Lung, Breast, Colorectal), End-User (Hospitals, Radiotherapy Centres), & Region - Global Forecast to 2028
The global robotic radiotherapy market, valued at US$0.8 billion in 2021, stood at US$1.1 billion in 2023 and is projected to advance at a resilient CAGR of 11.9% from 2023 to 2028, culminating in a forecasted valuation of US$1.9 billion by the end of the period.
The market's expansion is driven by several factors, including the global rise in cancer cases, advancements in automation technologies enhancing the precision of radiotherapy, a growing preference for non-invasive cancer treatments, and the rapid proliferation of cancer treatment facilities. Additionally, increased merger and acquisition activities between manufacturers and radiotherapy software developers are expected to stimulate the uptake of radiotherapy systems. An illustrative example is the collaboration between GE Healthcare (US) and RaySearch Laboratories (Sweden) in May 2022 to pioneer a novel radiation therapy simulation and treatment planning workflow solution.
Furthermore, heightened government and private investments aimed at addressing the escalating need for cancer treatment, coupled with the rising healthcare expenditure and the burgeoning medical tourism sector in developing nations, are expected to present attractive growth prospects for stakeholders in the market in the foreseeable future.
Nevertheless, the substantial expense associated with radiotherapy systems may limit their availability in cancer centers, particularly in low-resource economies. Moreover, a scarcity of adequately trained personnel and the intricate nature of radiotherapy systems are anticipated to impede market expansion.
Global Robotic Radiotherapy Market Trends
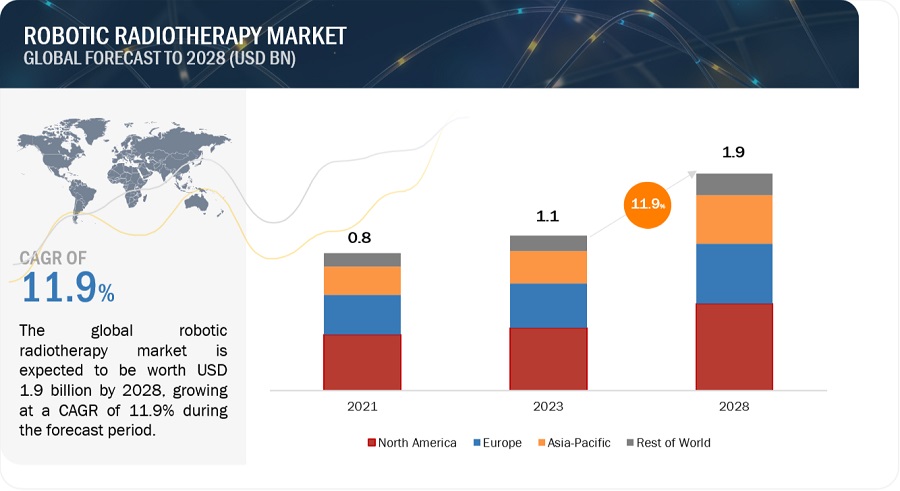
To know about the assumptions considered for the study, Request for Free Sample Report
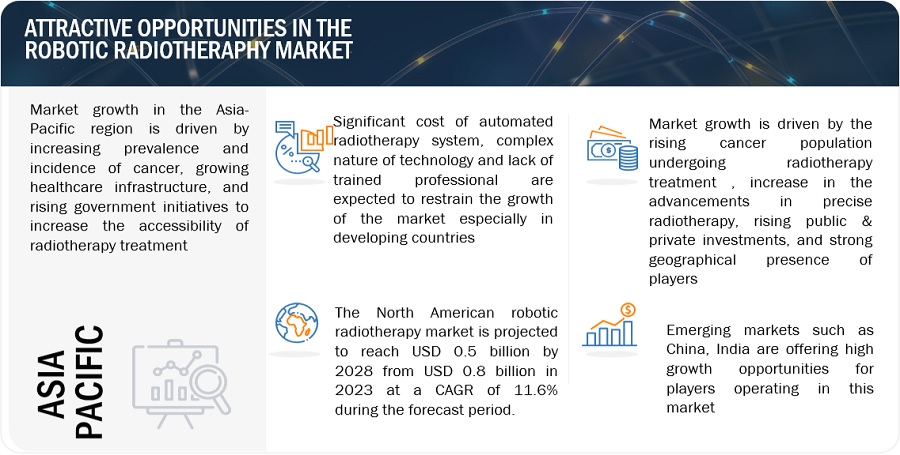
e- Estimated; p- Projected
Robotic Radiotherapy: Market Dynamics
Driver: Advancements in radiation therapy technologies
Technological progress has significantly transformed radiation therapy, resulting in the creation of sophisticated radiation therapy systems. These systems integrate advanced technologies and automation to enhance treatment efficiency, precision, and ultimately, patient outcomes.
The key technological advancement in radiation therapy involves the utilization of computerized treatment planning systems. These systems utilize algorithms and modeling techniques to create accurate treatment plans tailored to each patient. Through analysis of the patient's anatomy, tumor positioning, and radiation dosage needs, these automated systems optimize treatment plans, minimizing radiation exposure to healthy tissues and consequently lowering side effects. Some of the advancements are listed below:
- In 2023, MIM Software received FDA approval for its AI auto-contouring solution Contour ProtégéAI. This new software update offers improved algorithms for molecular radiotherapy and radiation oncology, further improving treatment outcomes.
- In May 2023, Brainlab AG launched the ExacTrac Dynamic Surface, a new product in the ExacTrac Dynamic product family of radiotherapy patient positioning and monitoring systems which is dedicated to surface-guided radiation therapy (SGRT).
In summary, technological advancements and automated systems in radiation therapy have revolutionized cancer treatment. As technology continues to advance, we can expect further innovations in robotic radiotherapy system, providing even more benefits for patients driven by the desire to offer patients less painless invasive, and more effective treatment options while reducing the risks and complications associated with traditional open surgeries.
Restraint: Dearth of skilled radiologists/oncologist
Robotic radiotherapy require radiologists to have a high level of expertise not only in radiation therapy but also in the use and interpretation of automated systems. These systems use complex algorithms and machine learning techniques to plan and deliver radiation treatments, and radiologists need to be well-versed in these technologies to effectively use these systems.
Unfortunately, there is a shortage of radiologists with the necessary skills and knowledge to work with radiotherapy systems. This is largely due to the lack of training opportunities and limited exposure to these systems during radiology education. Most radiology training programs focus on traditional radiation therapy techniques, and there is limited emphasis on the use of automated systems.
- The dearth of skilled radiologists has the potential to hinder the widespread adoption of radiotherapy systems. Healthcare facilities that invest in these systems may struggle to find qualified radiologists to operate them, limiting the benefits that these systems can provide.
Some of the related examples are mentioned below:
- The number of radiologists in the workforce is not growing as fast as the population and the demand for imaging. There’s absolutely a well-recognized shortage of radiologists in the U.K., Europe has 13 radiologists per 100,000 population but in the U.K., the rate is only 8.5 per 100,000.
- Similarly, India is also facing an acute shortage of oncologists, radiotherapists, and surgical oncologists. According to the Indian Council for Medical Research (ICMR), the number of Indians suffering from cancer is expected to increase to 29.8 million in the year 2025 from 26.7 million in 2021. However, the country has a huge shortfall of number of oncologists available for cancer patients. Currently, India has 200 oncologists per million cancer patients only.
By investing in the training and development of skilled radiologists, the robotic radiotherapy market can overcome the dearth of expertise and realize its full potential in improving cancer treatment outcomes.
Opportunity: Growing Government and Private Investments to Meet the Increasing Demand for Cancer Treatment
Radiotherapy has been accepted as a standard procedure for cancer treatment. The growing incidence of cancer and approval of different technologies for various radiation therapy applications are increasing the demand for radiotherapy procedures, globally. Currently, for every million people, there are almost 12 linear accelerators in the US, 5 to 8 radiotherapy machines in European countries, and less than one machine in developing countries across Asia, Latin America, and Africa. To bridge this gap, there is a requirement of over 10,000 more treatment machines, globally (Source: Cancer Control). Increasing public-private investments and funding for cancer research to bring in advancements in the diagnosis and treatment of cancer is one of the major factors supporting the growth of the robotic radiotherapy market. Listed below are some of the key developments in this regard:
- In July 2021, Leo Cancer Care (UK) successfully raised USD 25.3 million in funding from the investors across the globe taking an active interest in the businesses’ plan to develop upright radiotherapy solutions. The investors included Yu Galaxy, WARF, Alumni Ventures, Junson Capital and Serra Ventures, as well as industry players CHC, Cosylab, Toret Devices and Radiation Business Solutions.
- In August 2020, the Australian Government opened application for fundings of USD 45.5 million to develop regional radiation treatment centres for local cancer patients in rural and regional areas of New South Wales, Queensland, Victoria and South Australia.
Such investments from public and private sources are expected to offer potential growth opportunities for market players in the coming years.
Challenge: High cost of automated radiation therapy systems
Radiation therapy systems are highly sophisticated and require advanced technology and components. These systems must deliver precise and targeted radiation doses to minimize damage to healthy tissues while effectively treating tumors. Achieving this level of precision requires expensive machinery and software.
The cost of an radiotherapy system can vary depending on several factors, including the brand, model, features, and additional services. The high cost of automation radiation therapy systems can pose challenges for healthcare providers and patients, it is important to consider the value and benefits they offer in terms of improved treatment outcomes, enhanced precision, and reduced side effects. Continuous advancements in technology and growing market competition may also help drive down costs in the future.
Market Ecosystem
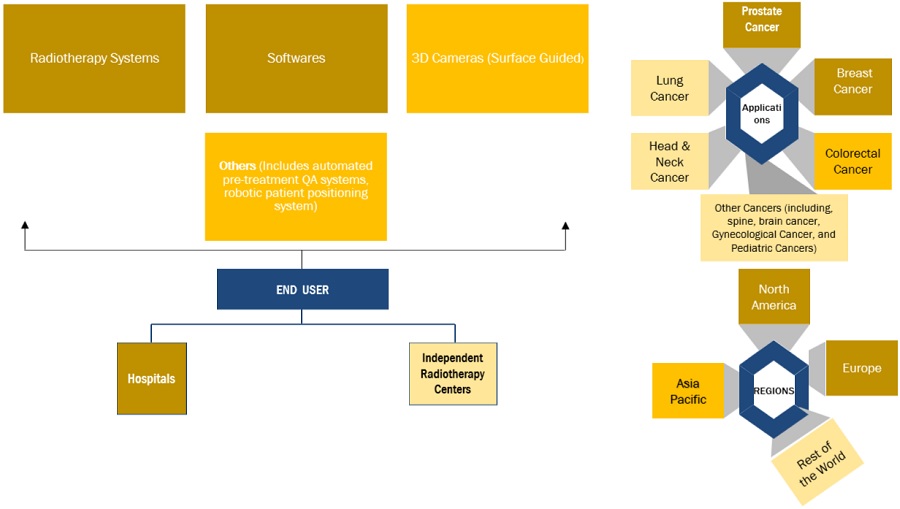
By product, the radiotherapy systems segment accounted for the largest share of robotic radiotherapy industry during the forecast period.
Based on the product, the robotic radiotherapy market is segmented into radiotherapy systems, software, 3D cameras, and others. The software segment accounted for the largest share of the global robotic radiotherapy market in 2022. Rapid penetration of AI in radiotherapy , increasing availability of radiation therapy software, and growing focus of market player on partnership & collaboration to enhance radiation software capabilities is supporting the overall growth of segment.
By technology, the linear accelerators segment accounted for the largest share of robotic radiotherapy industry during the forecast period.
Based on technology, the robotic radiotherapy market is segmented into linear accelerators, stereotactic radiation therapy systems, and particle therapy. The linear accelerators segment is expected to account for the for the largest share of robotic radiotherapy market owing to the availability of advanced systems and their growing adoption worldwide. Furthermore, oncologists are increasingly recognizing the advantages of MR LINAC, leading to heightened investments in research and development for automated LINAC technology. Collaborations between industry players and cancer institutes are also on the rise, aimed at fostering innovation and improving the accessibility of LINAC technology.
By application, lung cancer is expected to witness significant growth of robotic radiotherapy industry during the forecast period.
Based on application, the robotic radiotherapy market is segmented into prostate cancer, breast cancer, lung cancer, head & neck cancer, colorectal cancer, and other cancers. The lung cancer segment accounted for the largest share of the global robotic radiotherapy market in 2022. The rapid rise in lung cancer prevalence, coupled with a rising count of patients opting for radiotherapy, is expected to drive growth in this segment. As per the American Lung Association (ALA), approximately 237,000 individuals in the United States received a lung cancer diagnosis in 2022.
By End User, hospital segment to dominate robotic radiotherapy industry end user.
Based on end-user, the global robotic radiotherapy market is segmented into hospitals and independent radiotherapy centers. The Hospitals segment dominated the global robotic radiotherapy end-user market in 2022 owing to the increase in the cancer patients undergoing radiotherapy treatment in cancer hospitals, increasing partnerships between radiotherapy providers and hospitals, and the expansion of cancer hospitals in both developed and developing countries.
North America to account for the largest share of robotic radiotherapy industry during the forecast period.
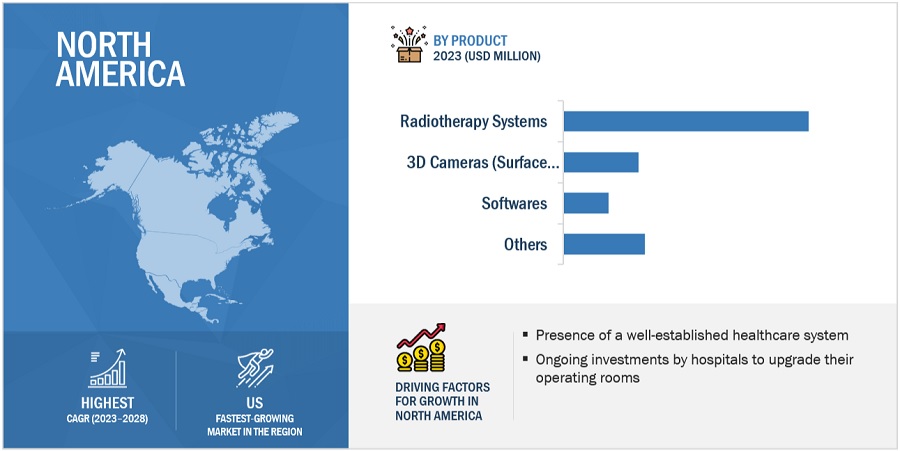
To know about the assumptions considered for the study, download the pdf brochure
North America is the expected largest regional market for robotic radiotherapy products in the forecast period. Countries in this market are witnessing a high volume of radiotherapy procedures, robust healthcare infrastructure, extensive patient base, and continuous hospital investments in upgrading their facilities. These elements collectively contribute to the region's significant share in the field.
As of 2022, prominent players in the robotic radiotherapy market are Siemens Healthcare GmbH (Germany), Elekta (Sweden), Accuray Incorporated (US), IBA (Belgium), ViewRay Technologies, Inc. (US), C-RAD (Sweden), IBA Worldwide (Belgium), Hitachi Ltd. (Japan (US), Mevion Medical Systems (US), Optivus Proton Therapy, Inc. (US), Panacea Medical Technologies Pvt. Ltd. (India) and P-Cure (Israel), among others.
Scope of the Robotic Radiotherapy Industry
|
Report Metric |
Details |
|
Market Revenue in 2023 |
USD 1.1 billion |
|
Projected Revenue by 2028 |
USD 1.9 billion |
|
Revenue Rate |
Poised to Grow at a CAGR of 11.9% |
|
Market Driver |
Advancements in radiation therapy technologies |
|
Market Opportunity |
Growing Government and Private Investments to Meet the Increasing Demand for Cancer Treatment |
This report has segmented the global robotic radiotherapy market to forecast revenue and analyze trends in each of the following submarkets:
By Product
- Radiotherapy Systems
- Softwares
- 3D Cameras (Surface Guided)
- Others
By Technology
- Linear Accelerators
- Conventional Linear Accelerators
- MRI - Linear Accelerators
- Stereotactic Radiation Therapy Systems
- Cyberknife
- Gamma Knife
- Particle Therapy
- Proton Beam Therapy
- Heavy Ion beam Therapy
By Application
- Prostate Cancer
- Breast Cancer
- Lung Cancer
- Head & Neck Cancer
- Colorectal Cancer
- Other Cancers
By End User
- Hospitals
- Independent Radiotherapy Centers
By Region
-
North America
- US
- Canada
-
Europe
- Germany
- France
- UK
- Italy
- Spain
- Rest of Europe
-
Asia Pacific
- Japan
- China
- India
- Australia
- South Korea
- Rest of Asia Pacific
- Rest of World
Recent Developments of Robotic Radiotherapy Industry:
- In May 2023, Vision RT (UK)received approval from FDA for the commercialization of its SGRT product Map RT in the US.
- In June 2023, RaySearch Laboratories (Sweden)launched RayStation 12A, an advanced treatment radiation treatment planning system.
- In February 2022, MIM Software formed a partnership with Genesis Care, one of the largest providers of cancer care services in Australia. Through this partnership, MIM Software will provide a comprehensive set of AI and automation radiotherapy software, including MIM Premier and MIM SurePlan MRT, across all the cancer treatment centers of GensisCare.
Frequently Asked Questions (FAQ):
What is the projected market revenue value of the global robotic radiotherapy market?
The global robotic radiotherapy market boasts a total revenue value of $1.9 billion by 2028.
What is the estimated growth rate (CAGR) of the global robotic radiotherapy market?
The global robotic radiotherapy market has an estimated compound annual growth rate (CAGR) of 11.9% and a revenue size in the region of $1.1 billion in 2023. .
To speak to our analyst for a discussion on the above findings, click Speak to Analyst


- 5.1 INTRODUCTION
-
5.2 MARKET DYNAMICSDRIVERS- Rising prevalence of cancer- Growing demand for noninvasive treatmentRESTRAINTS- Premium Product Pricing- Complexities associated with automated/robotic radiotherapyOPPORTUNITIES- Rising healthcare expenditure across emerging economies- Government and private investments to boost cancer treatment availabilityCHALLENGES- Risk of radiation exposure- Dearth of skilled personnel
- 5.3 TECHNOLOGY ANALYSIS
-
5.4 PORTER’S FIVE FORCES ANALYSISTHREAT OF NEW ENTRANTSTHREAT OF SUBSTITUTESBARGAINING POWER OF SUPPLIERSBARGAINING POWER OF BUYERSINTENSITY OF COMPETITIVE RIVALRY
-
5.5 KEY STAKEHOLDERS AND BUYING CRITERIAKEY STAKEHOLDERS IN BUYING PROCESS
-
5.6 REGULATORY ANALYSISUSEUROPEJAPAN
- 5.7 REIMBURSEMENT SCENARIO
-
5.8 ECOSYSTEM ANALYSIS
-
5.9 VALUE CHAIN ANALYSISRESEARCH & DEVELOPMENTPROCUREMENT AND PRODUCT DEVELOPMENTMARKETING, SALES & DISTRIBUTION, AND POST-SALES SERVICES
-
5.10 SUPPLY CHAIN ANALYSISPROMINENT COMPANIESSMALL & MEDIUM-SIZED COMPANIESEND USERS
- 5.11 PRICING ANALYSIS
-
5.12 PATENT ANALYSIS
- 5.13 TRADE ANALYSIS
- 5.14 KEY CONFERENCES AND EVENTS IN 2022–2023
-
5.15 TRENDS/DISRUPTIONS IMPACTING CUSTOMERS’ BUSINESSES
- 6.1 INTRODUCTION
-
6.2 RADIOTHERAPY SYSTEMSRISING USE OF AI AND AUTOMATION TO DRIVE MARKET
-
6.3 SOFTWARENEED TO ENSURE TREATMENT EFFECTIVENESS AND ACCURACY TO BOOST GROWTH
-
6.4 3D CAMERASGROWING USE OF SGRT TO DRIVE DEMAND
- 6.5 OTHER PRODUCTS
- 7.1 INTRODUCTION
-
7.2 LINEAR ACCELERATORSCONVENTIONAL LINEAR ACCELERATORS- Longer treatment duration to limit adoptionMRI LINEAR ACCELERATORS- Rising awareness about benefits to enhance demand
-
7.3 STEREOTACTIC RADIATION THERAPYCYBERKNIFE- Precision and correction capabilities to boost adoptionGAMMA KNIFE- Ongoing product development to drive market
-
7.4 PARTICLE THERAPY SYSTEMSPROTON BEAM THERAPY- Rising establishment of proton therapy cancer centers to drive marketHEAVY ION THERAPY- Limited number of facilities to slow growth
- 8.1 INTRODUCTION
-
8.2 LUNG CANCERLUNG CANCER TO DOMINATE APPLICATIONS MARKET
-
8.3 BREAST CANCERINCREASING INCIDENCE OF BREAST CANCER TO DRIVE MARKET
-
8.4 PROSTATE CANCERPREFERENCE FOR NONINVASIVE TREATMENT TO BOOST GROWTH
-
8.5 HEAD & NECK CANCERGROWING UTILIZATION OF CYBERKNIFE FOR TREATMENT TO DRIVE MARKET
-
8.6 COLORECTAL CANCERRISING INCIDENCE OF COLORECTAL CANCER TO SUPPORT GROWTH
- 8.7 OTHER CANCERS
- 9.1 INTRODUCTION
-
9.2 HOSPITALSLARGE NUMBER OF SURGICAL AND DIAGNOSTIC PROCEDURES TO PROPEL MARKET
-
9.3 INDEPENDENT RADIOTHERAPY CENTERSLIMITED SURGICAL CAPABILITIES OF AVAILABLE PRODUCTS TO RESTRAIN ADOPTION
- 10.1 INTRODUCTION
-
10.2 NORTH AMERICANORTH AMERICA: RECESSION IMPACTUS- US to dominate North American market over forecast periodCANADA- Increasing government initiatives and favorable reimbursement to drive market
-
10.3 EUROPEEUROPE: RECESSION IMPACTGERMANY- Increasing aging population and rising life expectancy to drive marketFRANCE- Well-developed healthcare sector and rising geriatric population to drive marketUK- High burden of chronic diseases to support adoptionITALY- Increasing geriatric population to drive marketSPAIN- Technological developments in healthcare to drive marketREST OF EUROPE
-
10.4 ASIA PACIFICASIA PACIFIC: RECESSION IMPACTJAPAN- Rising geriatric population and surgical procedures to drive marketCHINA- Developing healthcare infrastructure to drive marketINDIA- Rising awareness and government support to boost growthAUSTRALIA- Well-established healthcare system to favor adoptionSOUTH KOREA- Growing target patient population to drive marketREST OF ASIA PACIFIC
-
10.5 REST OF THE WORLDREST OF THE WORLD: RECESSION IMPACT

- 11.1 OVERVIEW
- 11.2 KEY PLAYER STRATEGIES
- 11.3 REVENUE ANALYSIS
- 11.4 MARKET SHARE ANALYSIS: ROBOTIC RADIOTHERAPY MARKET, BY KEY PLAYER (2022)
-
11.5 COMPANY EVALUATION MATRIX (2022)STARSPERVASIVE PLAYERSEMERGING LEADERSPARTICIPANTS
-
11.6 COMPANY EVALUATION MATRIX FOR START-UPS/SMES (2022)PROGRESSIVE COMPANIESDYNAMIC COMPANIESRESPONSIVE COMPANIESSTARTING BLOCKS
-
11.7 COMPETITIVE BENCHMARKINGOVERALL COMPANY FOOTPRINTCOMPANY PRODUCT FOOTPRINTCOMPANY REGIONAL FOOTPRINT
-
11.8 COMPETITIVE SCENARIO (2019–2023)PRODUCT LAUNCHES & APPROVALSDEALSOTHER DEVELOPMENTS
-
12.1 KEY PLAYERSSIEMENS HEALTHINEERS AG (VARIAN MEDICAL SYSTEMS, INC.)- Business overview- Products offered- Recent developments- MnM viewELEKTA- Business overview- Products offered- Recent developments- MnM viewACCURAY INCORPORATED- Business overview- Products offered- Recent developments- MnM viewVIEWRAY TECHNOLOGIES, INC.- Business overview- Products offered- Recent developmentsC-RAD- Business overview- Products offered- Recent developmentsIBA- Business overview- Products & services offered- Recent developmentsHITACHI LTD.- Business overview- Products offered- Recent developmentsMEVION MEDICAL SYSTEMS- Business overview- Products offered- Recent developmentsPANACEA MEDICAL TECHNOLOGIES PVT. LTD.- Business overview- Products offered- Recent developmentsP-CURE- Business overview- Products offered- Recent developmentsPROVISION HEALTHCARE- Business overview- Products offeredSUMITOMO HEAVY INDUSTRY LTD.- Business overview- Products offered- Recent developmentsPHILIPS HEALTHCARE- Business overview- Products offered- Recent developmentsRAYSEARCH LABORATORIES- Business overview- Products offered- Recent developmentsPROTOM INTERNATIONAL, INC.- Business overview- Products offered- Recent developmentsOPTIVUS PROTON THERAPY, INC.- Business overview- Products offeredTOSHIBA CORPORATION- Business overview- Products offered- Recent developmentsVISION RT LTD.- Business overview- Products offered- Recent developmentsADVANCED ONCOTHERAPY PLC- Business overview- Products offeredMIM SOFTWARE INC.- Business overview- Products offered- Recent developments
-
12.2 OTHER PLAYERSSTANDARD IMAGING, INC.BRAINLAB AGMAGNETTX ONCOLOGY SOLUTIONS LTD.PTW FREIBURG GMBHDOSISOFT SA
- 13.1 DISCUSSION GUIDE
- 13.2 KNOWLEDGESTORE: MARKETSANDMARKETS’ SUBSCRIPTION PORTAL
- 13.3 CUSTOMIZATION OPTIONS
- 13.4 RELATED REPORTS
- 13.5 AUTHOR DETAILS
- TABLE 1 LIMITATIONS AND ASSOCIATED RISKS
- TABLE 2 PROJECTED INCREASE IN CANCER CASES, 2020–2040
- TABLE 3 ROBOTIC RADIOTHERAPY MARKET: PORTER’S FIVE FORCES ANALYSIS
- TABLE 4 INFLUENCE OF STAKEHOLDERS ON BUYING PROCESS FOR KEY PRODUCT SEGMENTS (%)
- TABLE 5 US: MEDICAL DEVICE REGULATORY APPROVAL PROCESS
- TABLE 6 JAPAN: MEDICAL DEVICE CLASSIFICATION UNDER PMDA
- TABLE 7 CPT CODES FOR IMRT
- TABLE 8 CPT CODES FOR SBRT
- TABLE 9 CPT CODES FOR PROTON BEAM THERAPY
- TABLE 10 FREESTANDING PER COURSE NATIONAL AVERAGE MEDICARE REIMBURSEMENT, 2021 VS 2022
- TABLE 11 PROPOSED AMBULATORY PAYMENT CLASSIFICATION 2023 RATES
- TABLE 12 IMPACT OF CLINICAL LABOR PRICE CHANGES ON RADIATION ONCOLOGY SERVICES
- TABLE 13 PRICING ANALYSIS OF RADIOTHERAPY SYSTEMS (USD)
- TABLE 14 IMPORT DATA FOR RADIOTHERAPY SYSTEMS (HS CODE 9022), BY COUNTRY, 2018–2022 (USD THOUSAND)
- TABLE 15 EXPORT DATA FOR RADIOTHERAPY SYSTEMS (HS CODE 9022), BY COUNTRY, 2018–2022 (USD THOUSAND)
- TABLE 16 ROBOTIC RADIOTHERAPY MARKET: DETAILED LIST OF KEY CONFERENCES AND EVENTS IN 2022–2023
- TABLE 17 ROBOTIC RADIOTHERAPY MARKET, BY PRODUCT, 2020–2028 (USD MILLION)
- TABLE 18 RADIOTHERAPY SYSTEMS MARKET, BY REGION, 2020–2028 (USD MILLION)
- TABLE 19 SOFTWARE MARKET, BY REGION, 2020–2028 (USD MILLION)
- TABLE 20 3D CAMERAS MARKET, BY REGION, 2020–2028 (USD MILLION)
- TABLE 21 OTHER ROBOTIC RADIOTHERAPY MARKET, BY REGION, 2020–2028 (USD MILLION)
- TABLE 22 ROBOTIC RADIOTHERAPY MARKET, BY TECHNOLOGY, 2020–2028 (USD MILLION)
- TABLE 23 LINEAR ACCELERATORS MARKET, BY TYPE, 2020–2028 (USD MILLION)
- TABLE 24 STEREOTACTIC RADIATION THERAPY MARKET, BY TYPE, 2020–2028 (USD MILLION)
- TABLE 25 PARTICLE THERAPY SYSTEMS MARKET, BY TYPE, 2020–2028 (USD MILLION)
- TABLE 26 ROBOTIC RADIOTHERAPY MARKET, BY APPLICATION, 2020–2028 (USD MILLION)
- TABLE 27 ROBOTIC RADIOTHERAPY MARKET FOR LUNG CANCER, BY REGION, 2020–2028 (USD MILLION)
- TABLE 28 ROBOTIC RADIOTHERAPY MARKET FOR BREAST CANCER, BY REGION, 2020–2028 (USD MILLION)
- TABLE 29 ROBOTIC RADIOTHERAPY MARKET FOR PROSTATE CANCER, BY REGION, 2020–2028 (USD MILLION)
- TABLE 30 ROBOTIC RADIOTHERAPY MARKET FOR HEAD & NECK CANCER, BY REGION, 2020–2028 (USD MILLION)
- TABLE 31 ROBOTIC RADIOTHERAPY MARKET FOR COLORECTAL CANCER, BY REGION, 2020–2028 (USD MILLION)
- TABLE 32 ROBOTIC RADIOTHERAPY MARKET FOR OTHER CANCERS, BY REGION, 2020–2028 (USD MILLION)
- TABLE 33 ROBOTIC RADIOTHERAPY MARKET, BY END USER, 2020–2028 (USD MILLION)
- TABLE 34 ROBOTIC RADIOTHERAPY MARKET FOR HOSPITALS, BY REGION, 2020–2028 (USD MILLION)
- TABLE 35 ROBOTIC RADIOTHERAPY MARKET FOR INDEPENDENT RADIOTHERAPY CENTERS, BY REGION, 2020–2028 (USD MILLION)
- TABLE 36 ROBOTIC RADIOTHERAPY MARKET, BY REGION, 2020–2028 (USD MILLION)
- TABLE 37 NORTH AMERICA: ROBOTIC RADIOTHERAPY MARKET, BY COUNTRY, 2020–2028 (USD MILLION)
- TABLE 38 NORTH AMERICA: ROBOTIC RADIOTHERAPY MARKET, BY PRODUCT, 2020–2028 (USD MILLION)
- TABLE 39 NORTH AMERICA: ROBOTIC RADIOTHERAPY MARKET, BY TECHNOLOGY, 2020–2028 (USD MILLION)
- TABLE 40 NORTH AMERICA: ROBOTIC RADIOTHERAPY MARKET, BY APPLICATION, 2020–2028 (USD MILLION)
- TABLE 41 NORTH AMERICA: ROBOTIC RADIOTHERAPY MARKET, BY END USER, 2020–2028 (USD MILLION)
- TABLE 42 US: ROBOTIC RADIOTHERAPY MARKET, BY PRODUCT, 2020–2028 (USD MILLION)
- TABLE 43 CANADA: ROBOTIC RADIOTHERAPY MARKET, BY PRODUCT, 2020–2028 (USD MILLION)
- TABLE 44 EUROPE: ROBOTIC RADIOTHERAPY MARKET, BY COUNTRY, 2020–2028 (USD MILLION)
- TABLE 45 EUROPE: ROBOTIC RADIOTHERAPY MARKET, BY PRODUCT, 2020–2028 (USD MILLION)
- TABLE 46 EUROPE: ROBOTIC RADIOTHERAPY MARKET, BY TECHNOLOGY, 2020–2028 (USD MILLION)
- TABLE 47 EUROPE: ROBOTIC RADIOTHERAPY MARKET, BY APPLICATION, 2020–2028 (USD MILLION)
- TABLE 48 EUROPE: ROBOTIC RADIOTHERAPY MARKET, BY END USER, 2020–2028 (USD MILLION)
- TABLE 49 GERMANY: ROBOTIC RADIOTHERAPY MARKET, BY PRODUCT, 2020–2028 (USD MILLION)
- TABLE 50 FRANCE: ROBOTIC RADIOTHERAPY MARKET, BY PRODUCT, 2020–2028 (USD MILLION)
- TABLE 51 UK: ROBOTIC RADIOTHERAPY MARKET, BY PRODUCT, 2020–2028 (USD MILLION)
- TABLE 52 ITALY: ROBOTIC RADIOTHERAPY MARKET, BY PRODUCT, 2020–2028 (USD MILLION)
- TABLE 53 SPAIN: ROBOTIC RADIOTHERAPY MARKET, BY PRODUCT, 2020–2028 (USD MILLION)
- TABLE 54 REST OF EUROPE: ROBOTIC RADIOTHERAPY MARKET, BY PRODUCT, 2020–2028 (USD MILLION)
- TABLE 55 ASIA PACIFIC: ROBOTIC RADIOTHERAPY MARKET, BY COUNTRY, 2020–2028 (USD MILLION)
- TABLE 56 ASIA PACIFIC: ROBOTIC RADIOTHERAPY MARKET, BY PRODUCT, 2020–2028 (USD MILLION)
- TABLE 57 ASIA PACIFIC: ROBOTIC RADIOTHERAPY MARKET, BY TECHNOLOGY, 2020–2028 (USD MILLION)
- TABLE 58 ASIA PACIFIC: ROBOTIC RADIOTHERAPY MARKET, BY APPLICATION, 2020–2028 (USD MILLION)
- TABLE 59 ASIA PACIFIC: ROBOTIC RADIOTHERAPY MARKET, BY END USER, 2020–2028 (USD MILLION)
- TABLE 60 JAPAN: ROBOTIC RADIOTHERAPY MARKET, BY PRODUCT, 2020–2028 (USD MILLION)
- TABLE 61 CHINA: ROBOTIC RADIOTHERAPY MARKET, BY PRODUCT, 2020–2028 (USD MILLION)
- TABLE 62 INDIA: ROBOTIC RADIOTHERAPY MARKET, BY PRODUCT, 2020–2028 (USD MILLION)
- TABLE 63 AUSTRALIA: ROBOTIC RADIOTHERAPY MARKET, BY PRODUCT, 2020–2028 (USD MILLION)
- TABLE 64 SOUTH KOREA: ROBOTIC RADIOTHERAPY MARKET, BY PRODUCT, 2020–2028 (USD MILLION)
- TABLE 65 REST OF ASIA PACIFIC: ROBOTIC RADIOTHERAPY MARKET, BY PRODUCT, 2020–2028 (USD MILLION)
- TABLE 66 REST OF THE WORLD: ROBOTIC RADIOTHERAPY MARKET, BY PRODUCT, 2020–2028 (USD MILLION)
- TABLE 67 REST OF THE WORLD: ROBOTIC RADIOTHERAPY MARKET, BY TECHNOLOGY, 2020–2028 (USD MILLION)
- TABLE 68 REST OF THE WORLD: ROBOTIC RADIOTHERAPY MARKET, BY APPLICATION, 2020–2028 (USD MILLION)
- TABLE 69 REST OF THE WORLD: ROBOTIC RADIOTHERAPY MARKET, BY END USER, 2020–2028 (USD MILLION)
- TABLE 70 ROBOTIC RADIOTHERAPY MARKET: DEGREE OF COMPETITION
- TABLE 71 OVERALL FOOTPRINT ANALYSIS: ROBOTIC RADIOTHERAPY MARKET
- TABLE 72 PRODUCT FOOTPRINT ANALYSIS: ROBOTIC RADIOTHERAPY MARKET
- TABLE 73 REGIONAL FOOTPRINT ANALYSIS: ROBOTIC RADIOTHERAPY MARKET
- TABLE 74 SIEMENS HEALTHINEERS AG: COMPANY OVERVIEW
- TABLE 75 ELEKTA: COMPANY OVERVIEW
- TABLE 76 ACCURAY INCORPORATED: COMPANY OVERVIEW
- TABLE 77 VIEWRAY TECHNOLOGIES, INC.: COMPANY OVERVIEW
- TABLE 78 C-RAD: COMPANY OVERVIEW
- TABLE 79 IBA: COMPANY OVERVIEW
- TABLE 80 HITACHI LTD.: COMPANY OVERVIEW
- TABLE 81 MEVION MEDICAL SYSTEMS: COMPANY OVERVIEW
- TABLE 82 PANACEA MEDICAL TECHNOLOGIES PVT. LTD.: COMPANY OVERVIEW
- TABLE 83 P-CURE: COMPANY OVERVIEW
- TABLE 84 PROVISION HEALTHCARE: COMPANY OVERVIEW
- TABLE 85 SUMITOMO HEAVY INDUSTRY LTD.: COMPANY OVERVIEW
- TABLE 86 PHILIPS HEALTHCARE: COMPANY OVERVIEW
- TABLE 87 RAYSEARCH LABORATORIES: COMPANY OVERVIEW
- TABLE 88 PROTOM INTERNATIONAL, INC.: COMPANY OVERVIEW
- TABLE 89 OPTIVUS PROTON THERAPY, INC.: COMPANY OVERVIEW
- TABLE 90 TOSHIBA CORPORATION: COMPANY OVERVIEW
- TABLE 91 VISION RT LTD.: COMPANY OVERVIEW
- TABLE 92 ADVANCED ONCOTHERAPY PLC: COMPANY OVERVIEW
- TABLE 93 MIM SOFTWARE INC.: COMPANY OVERVIEW
- FIGURE 1 BREAKDOWN OF PRIMARY INTERVIEWS: SUPPLY-SIDE AND DEMAND-SIDE PARTICIPANTS
- FIGURE 2 BREAKDOWN OF PRIMARY INTERVIEWS: BY COMPANY TYPE, DESIGNATION, AND REGION
- FIGURE 3 RESEARCH METHODOLOGY: HYPOTHESIS BUILDING
- FIGURE 4 MARKET SIZE ESTIMATION FOR ROBOTIC RADIOTHERAPY: APPROACH 1 (COMPANY REVENUE ESTIMATION)
- FIGURE 5 ROBOTIC RADIOTHERAPY MARKET SIZE ESTIMATION: BOTTOM-UP APPROACH
- FIGURE 6 DATA TRIANGULATION METHODOLOGY
- FIGURE 7 ROBOTIC RADIOTHERAPY MARKET, BY PRODUCT, 2023 VS. 2028 (USD MILLION)
- FIGURE 8 ROBOTIC RADIOTHERAPY MARKET, BY APPLICATION, 2023 VS. 2028 (USD MILLION)
- FIGURE 9 ROBOTIC RADIOTHERAPY MARKET, BY TECHNOLOGY, 2023 VS. 2028 (USD MILLION)
- FIGURE 10 ROBOTIC RADIOTHERAPY MARKET, BY END USER, 2023 VS. 2028 (USD MILLION)
- FIGURE 11 GEOGRAPHICAL SNAPSHOT: ROBOTIC RADIOTHERAPY MARKET
- FIGURE 12 INCREASING GERIATRIC POPULATION AND GROWING R&D INVESTMENTS TO DRIVE MARKET
- FIGURE 13 RADIOTHERAPY SYSTEMS TO DOMINATE MARKET IN 2028
- FIGURE 14 HOSPITALS DOMINATED END-USER MARKET IN 2022
- FIGURE 15 INDIA AND CHINA TO SHOW HIGHEST GROWTH DURING FORECAST PERIOD
- FIGURE 16 ROBOTIC RADIOTHERAPY MARKET: DRIVERS, RESTRAINTS, OPPORTUNITIES, AND CHALLENGES
- FIGURE 17 INFLUENCE OF STAKEHOLDERS ON BUYING PROCESS OF RADIOTHERAPY SYSTEMS
- FIGURE 18 VALUE CHAIN ANALYSIS IN ROBOTIC RADIOTHERAPY MARKET
- FIGURE 19 SUPPLY CHAIN ANALYSIS OF ROBOTIC RADIOTHERAPY MARKET
- FIGURE 20 TOP TEN PATENT APPLICANTS FOR RADIOTHERAPY (JANUARY 2012 TO JUNE 2022)
- FIGURE 21 TOP TEN PATENT INVENTORS FOR RADIOTHERAPY (JANUARY 2012 TO JUNE 2023)
- FIGURE 22 TOP TEN PATENT OWNERS FOR RADIOTHERAPY (JANUARY 2012 TO JUNE 2023)
- FIGURE 23 EMERGING TRENDS AND OPPORTUNITIES AFFECTING FUTURE REVENUE MIX
- FIGURE 24 NORTH AMERICA: ROBOTIC RADIOTHERAPY MARKET SNAPSHOT
- FIGURE 25 ASIA PACIFIC: ROBOTIC RADIOTHERAPY MARKET SNAPSHOT
- FIGURE 26 KEY DEVELOPMENTS IN ROBOTIC RADIOTHERAPY MARKET (2019 TO 2023)
- FIGURE 27 REVENUE ANALYSIS OF TOP FIVE PLAYERS (2019–2022)
- FIGURE 28 ROBOTIC RADIOTHERAPY MARKET SHARE, BY KEY PLAYER, 2022
- FIGURE 29 ROBOTIC RADIOTHERAPY MARKET: COMPANY EVALUATION MATRIX, 2022
- FIGURE 30 COMPANY EVALUATION MATRIX FOR START-UPS/SMES, 2022
- FIGURE 31 SIEMENS HEALTHINEERS AG: COMPANY SNAPSHOT (2022)
- FIGURE 32 ELEKTA: COMPANY SNAPSHOT (2022)
- FIGURE 33 ACCURAY INCORPORATED: COMPANY SNAPSHOT (2022)
- FIGURE 34 VIEWRAY TECHNOLOGIES, INC.: COMPANY SNAPSHOT (2022)
- FIGURE 35 C-RAD: COMPANY SNAPSHOT (2022)
- FIGURE 36 IBA: COMPANY SNAPSHOT (2022)
- FIGURE 37 HITACHI LTD.: COMPANY SNAPSHOT (2021)
- FIGURE 38 SUMITOMO HEAVY INDUSTRIES: COMPANY SNAPSHOT (2021)
- FIGURE 39 PHILIPS HEALTHCARE: COMPANY SNAPSHOT (2022)
- FIGURE 40 RAYSEARCH LABORATORIES: COMPANY SNAPSHOT (2022)
- FIGURE 41 TOSHIBA CORPORATION: COMPANY SNAPSHOT (2022)
This study involved the extensive use of both primary and secondary sources. The research process involved the study of various factors affecting the industry to identify the segmentation types, industry trends, key players, competitive landscape, key market dynamics, and key player strategies.
Secondary Research
The secondary research process involves the widespread use of secondary sources, directories, databases (such as Bloomberg Businessweek, Factiva, and D&B Hoovers), white papers, annual reports, company house documents, investor presentations, and SEC filings of companies. Secondary research was used to identify and collect information useful for the extensive, technical, market-oriented, and commercial study of the robotic radiotherapy market. It was also used to obtain important information about the key players and market classification & segmentation according to industry trends to the bottom-most level and key developments related to market and technology perspectives. A database of the key industry leaders was also prepared using secondary research.
Primary Research
In the primary research process, various sources from both the supply and demand sides were interviewed to obtain qualitative and quantitative information for this report. The primary sources from the supply side include industry experts such as CEOs, vice presidents, marketing and sales directors, technology & innovation directors, and related key executives from various key companies and organizations in the robotic radiotherapy market. The primary sources from the demand side include medical OEMs, Analytical instrument OEMs, CDMOs, and service providers, among others. Primary research was conducted to validate the market segmentation, identify key players in the market, and gather insights on key industry trends & key market dynamics.
A breakdown of the primary respondents is provided below:
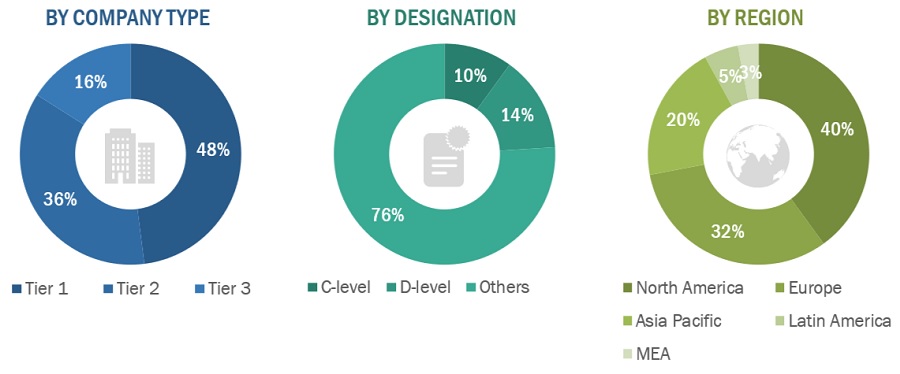
*Others include sales managers, marketing managers, business development managers, product managers, distributors, and suppliers.
Note: Companies are classified into tiers based on their total revenue. As of 2022, Tier 1 = >USD 10.00 billion, Tier 2 = USD 1.00 billion to USD 10.00 billion, and Tier 3 = <USD 1.00 billion.
To know about the assumptions considered for the study, download the pdf brochure
Market Estimation Methodology
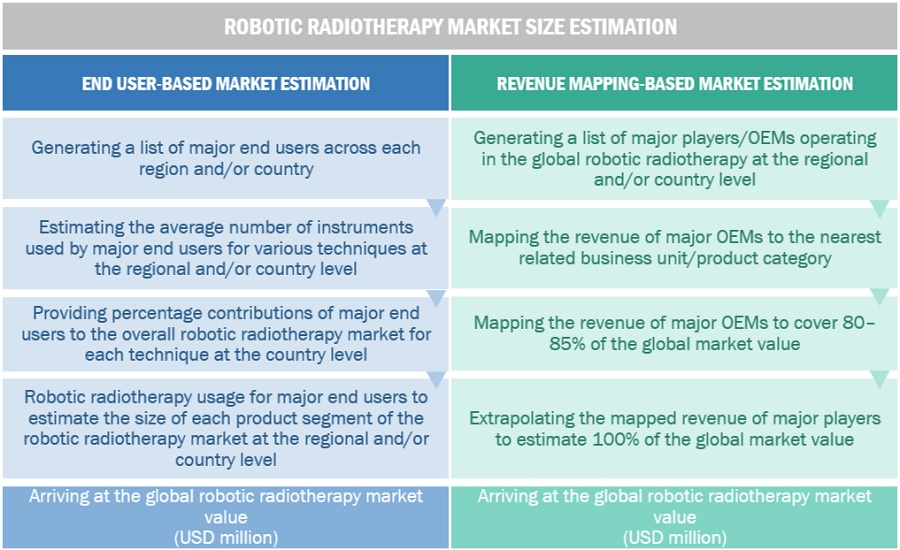
In this report, the global robotic radiotherapy market size was arrived at by using the revenue share analysis of leading players. For this purpose, key players in the market were identified, and their revenues from the robotic radiotherapy business were determined through various insights gathered during the primary and secondary research phases. Secondary research included the study of the annual and financial reports of the top market players. In contrast, primary research included extensive interviews with key opinion leaders, such as CEOs, directors, and key marketing executives.
To calculate the global market value, segmental revenues were calculated based on the revenue mapping of major solution/service providers. This process involved the following steps:
- Generating a list of major global players operating in the robotic radiotherapy market
- Mapping annual revenues generated by major global players from the robotic radiotherapy segment (or nearest reported business unit/product category)
- Revenue mapping of key players to cover a major share of the global market as of 2022
- Extrapolating the global value of the robotic radiotherapy industry
To know about the assumptions considered for the study, Request for Free Sample Report
Data Triangulation
After arriving at the overall market size from the market size estimation process explained above, the global robotic radiotherapy market was split into segments and subsegments. Data triangulation and market breakdown procedures were employed to complete the overall market engineering process and arrive at the exact statistics for all segments and subsegments. The data was triangulated by studying various factors and trends from both the demand and supply sides. Additionally, the robotic radiotherapy market was validated using both top-down and bottom-up approaches.
Market Definition
Robotic radiotherapy market is a segment of the radiotherapy industry that focuses on the development and supply of advanced technology for radiotherapy treatment. Robotic radiotherapy consists of several components, including advanced imaging technologies, treatment planning software, and robotic treatment delivery systems. These components work together to provide a fully automated, integrated radiation therapy solution and play a crucial role in modern cancer treatment by enabling precise, efficient, and safe delivery of radiation therapy to patients.
Key Market Stakeholders
- Radiotherapy product manufacturing companies
- Distributors, suppliers, and commercial service providers
- Healthcare service providers
- Clinical research organizations (CROs)
- Radiotherapy service providers
- Radiotherapy product distributors
- Medical research laboratories
- Cancer care centers
- Cancer research organizations
- Academic medical centers and universities
- Market research and consulting firms
Objectives of the Study
- To define, describe, and forecast the robotic radiotherapy market on the basis of product, technology, application, end user, and region
- To provide detailed information regarding the major factors influencing the growth potential of the global robotic radiotherapy market (drivers, restraints, opportunities, challenges, and trends).
- To analyze the micro markets with respect to individual growth trends, future prospects, and contributions to the global robotic radiotherapy market.
- To analyze key growth opportunities in the global robotic radiotherapy market for key stakeholders and provide details of the competitive landscape for market leaders.
- To forecast the size of market segments and/or subsegments with respect to four major regions, namely, North America (US and Canada), Europe (Germany, France, the UK, Italy, Spain, and the RoE), Asia Pacific (Japan, China, India, Australia, South Korea, ASEAN region and the RoAPAC), and Rest of the world.
- To profile the key players in the global robotic radiotherapy market and comprehensively analyze their market shares and core competencies.
- To track and analyze the competitive developments undertaken in the global robotic radiotherapy market, such as product launches, agreements, expansions, and & acquisitions.
Available Customizations
With the given market data, MarketsandMarkets offers customizations as per the company’s specific needs. The following customization options are available for the present global robotic radiotherapy market report:
Product Analysis
- Product matrix, which gives a detailed comparison of the product portfolios of the top fifteen companies
Company Information
- Detailed analysis and profiling of additional market players (up to 15)
Geographic Analysis
- Further breakdown of the Rest of Europe's robotic radiotherapy market into Russia, Belgium, the Netherlands, Switzerland, Austria, Finland, Sweden, Poland, and Portugal, among other
- Further breakdown of the Rest of Asia Pacific robotic radiotherapy market into Singapore, Taiwan, New Zealand, Philippines, Malaysia, and other APAC countries.


Growth opportunities and latent adjacency in Robotic Radiotherapy Market