Particle Therapy Market by Type (Proton Therapy, Heavy Ion), Products (Cyclotron, Synchrotron, Synchrocyclotron), Services, System (Single-room, Multi-room), Cancer Type (Pediatric, Prostate), Application (Treatment, Research) - Global Forecasts to 2027
Updated on : March 03, 2023
The global particle therapy market in terms of revenue was estimated to be worth $677 million in 2022 and is poised to reach $1,004 million by 2027, growing at a CAGR of 8.2% from 2022 to 2027. Market growth is largely driven by factors such as the various advantages offered by particle therapy over photon therapy, the growing global prevalence of cancer, the growing adoption of particle therapy in clinical trials, and the increasing number of particle therapy centers worldwide. Emerging markets such as China, India, Brazil, and South Africa are expected to offer lucrative growth opportunities to market players in the coming years.
To know about the assumptions considered for the study, Request for Free Sample Report
Drivers: Advantages offered by particle therapy over photon therapy
In recent years, particle therapy has undergone significant technological advancements. These advancements have helped manufacturers develop more effective and controlled particle therapy systems that are minimally invasive, deliver reduced levels of radiation to healthy tissues, and have fewer side effects.
Particle therapy, especially proton therapy, offers several advantages over conventional photon therapy. These benefits are propelling the growth of this market, especially in mature markets where the adoption rate of technologically advanced products is high. Listed below are some advantages of particle therapy over traditional photon-based radiotherapy methods:
- Targets tumors and cancer cells with more precision
- Less energy is released and minimal exit dose, which reduces the risk of damage to the surrounding healthy tissues and organs
- Reduces the overall toxicity and probability and/or severity of short- and long-term side-effects on the surrounding healthy tissues and organs, which, in turn, reduces the likelihood of secondary tumors caused by the treatment
- Is an appropriate alternative for patients who have reached the limit of conventional radiation
- Is more beneficial for pediatric patients in comparison to photon therapy as children have a constant high rate of mitosis, which requires a more targeted approach (easily achieved with proton therapy) with reduced risk of long-term side-effects
- Is a preferred alternative in cancers with limited treatment options
- Offers improved quality of life during and after treatment, with reduced chances of secondary tumors
Also, with technological advancements such as spot scanning and motion tracking, the application areas for particle therapy are increasing. Spot scanning significantly reduces the dose exposure of the surrounding healthy tissues, and real-time motion tracking enables clinicians to keep the target in the path of the radiation beam at all times, ensuring a controlled treatment. Considering these factors, several key market players are continuously focusing on R&D activities to upgrade their existing products and launch new and technologically advanced products.
Growing global prevalence of cancer
The growing prevalence of cancer is a significant factor driving the demand for particle therapy treatments (proton therapy and heavy-ion therapy) across the globe. According to the American Cancer Society, in 2021, around 1.9 million new cases of cancer are expected to be diagnosed in the US alone. The World Cancer Research Fund International estimated that 19.3 million new cancer cases were registered in 2021 globally; this number is expected to increase to 24 million by 2035. Thus, the increasing prevalence of pediatric cancer will fuel the growth of the particle therapy market.
The various advantages associated with proton therapy systems (high precision & radiation control, reduced risk of side effects, and minimal exposure of normal tissues to radiation) make it the most suitable treatment option for pediatric cancer cases. This is another major factor driving the market growth. In the US, an estimated 12,690 new cancer cases are diagnosed among children aged 0–14 years in 2021 (Source: American Cancer Society). Similarly, the total lifetime health expenditure with the use of proton therapy for children is less in comparison with conventional radiotherapy. This further fuels its adoption for pediatric cancer cases. According to the Department of Health, the average lifetime cost savings for the treatment of the side-effects caused by radiation therapy is more in proton beam therapy (PBT) as compared to conventional radiotherapy; the cost savings total ~USD 16,000 (£13,919) per child for PBT.
Restraints: Infrastructural challenges in healthcare facilities
Particle therapy systems are high-priced and require advanced infrastructure for installation. As these devices are comparatively larger (including cyclotrons and synchrotrons) than photon therapy systems, they require ample space for installation.
Particle therapy facilities incur significant expenses in terms of construction, maintenance, staffing, and running costs. As a result, a limited number of healthcare institutions in underdeveloped and developing countries are capable of using advanced particle therapy systems. Underequipped healthcare facilities due to limited healthcare expenditure are one of the major factors hampering the adoption of particle therapy systems, which in turn is limiting the number of particle beam therapy procedures despite their high demand.
According to IBA’s (Belgium) projection from the Proton Radiotherapy Horizon scanning report, only 265 proton therapy rooms have currently been sold worldwide. There is a need for more than 2,500 proton therapy rooms, representing a shortfall of 2,237 proton therapy rooms. This huge gap between the requirement and the existing installed base is primarily due to the high purchase and maintenance costs. According to the MD Anderson Proton Therapy Center, the annual cost of operating a photon therapy facility is USD 2.75 million, while that of a particle therapy facility is USD 10.95 million.
Affordability and accessibility of treatments
Particle therapy requires complex equipment and other services, such as patient positioning, individualized treatment planning, and dose management software. The entire treatment cycle requires the input of many healthcare professionals, thereby increasing the overall cost of the procedure. Particle systems are also equipped with incredibly advanced features and functionalities for treating various cancers and are thus very costly. It becomes difficult for small hospitals and institutes, especially in low- and medium-income countries, to invest such high capital in a particle therapy center. As a result, the adoption rate of these devices is limited despite the increasing incidence of cancer.
The cost per treatment with particle systems remains two to three times higher than conventional radiotherapy, and insurance companies often deny coverage. Healthcare facilities that purchase such costly systems often depend on third-party payers (such as Medicare, Medicaid, or private health insurance plans) to get reimbursements for the costs incurred in the therapeutic procedures performed using these systems. Also, healthcare facilities with controlled budgets cannot afford such expensive systems and thus opt for refurbished systems, limiting the production and demand for new particle therapy systems.
The cost of building heavy-ion therapy centers is even higher than proton therapy as ions are much heavier than protons. For instance, the cost of equipment in a proton facility is USD 34–260 million (single to multi-room facilities), while in a carbon ion beam facility, the cost of equipment is USD 180–290 million (multi-room facilities) (Source: HealthPACT). With single-room facilities, the cost per treatment room is USD 30 million (as opposed to USD 100 million for a multi-room facility). This jump from USD 5 to 10 million for a conventional radiation therapy treatment room to USD 30 million for proton therapy is still difficult for smaller clinics.
Additionally, particle therapy facilities have added costs such as high annual maintenance and service costs, which are approximately one-tenth of the purchase price. As a result, issues related to the affordability and accessibility of particle therapy treatments are considered a major challenge in the market. However, particle accelerators and treatment gantries have a lifespan of around 30 years, whereas the linear accelerators utilized in conventional radiotherapy have a lifespan of only 10 years. Thus, linear accelerators may require multiple replacements over the lifetime of the particle accelerator.
Opportunities: Growing adoption of particle therapy in emerging markets
Rapid economic development and the increasing healthcare expenditure in many emerging countries such as China, India, Brazil, and Mexico are expected to improve access to quality healthcare in these countries. This is considered a positive indicator of the particle therapy market. The rising incidence of cancer in these countries results in the growth in the demand for various particle therapy devices and techniques. According to GLOBOCAN 2021, there were 9.5 million new cancer cases in the Asian region in 2021, and this figure is projected to reach 12.8 million by 2030.
In order to leverage the high growth opportunities for particle therapy in these markets, manufacturers are strategically focusing on expanding their presence in these countries. Some related developments are listed below:
- In April 2019, The Varian office in Hertford Office Park, Johannesburg, was officially inaugurated.
- In October 2019, Samyang Biopharmaceutical Corp. (South Korea) announced to expand its business operations in the US to leverage the company’s biopharmaceutical and medical device market in the country.
Additionally, due to less-stringent regulations and data requirements, the regulatory policies in the Asia Pacific region are considered more adaptive and business-friendly by market players. This encourages several companies to focus more on emerging markets in the coming years.
Challenges: Difficulties in visualizing tumors during particle therapy procedures
One of the major challenges faced during particle therapy procedures is the lack of clear visualization of tumors and their demarcation from normal healthy tissues. However, since tumors can change their shape daily, it becomes highly difficult to only radiate the cancerous outgrowth without affecting the surrounding tissues. To limit this, radiologists include a safety margin around the tumor. Also, to minimize the damage to the surrounding healthy tissue, it becomes a compulsion to limit the radiotherapy dose range, increasing the number of treatment cycles needed to eradicate tumorous cells. This is one of the major factors responsible for increasing the cancer treatment costs for patients undergoing radiotherapy. Moreover, despite advancements in imaging techniques, detecting tumor progression is still a clinical challenge. Due to these challenges, alternative treatment approaches such as chemotherapy and conventional surgical procedures are preferred by oncologists.
To avoid damage to the surrounding tissues, manufacturers continuously focus on developing advanced technologies with a precise and narrow tumor-specific window of radiation and better imaging techniques. This will help reduce the safety margins and increase the dose per session, which will lead to fewer patient visits to hospitals and, in turn, reduce the treatment time and costs.
Proton therapy accounted for the largest share in the particle therapy market by product type
On the basis of type, the market is segmented into proton therapy and heavy ion therapy. The proton therapy segment is expected to account for the largest share (85.7%) of the market in 2021. The large share of this segment can be attributed to factors such as the high dose of radiation, a high degree of precision, shorter treatment time, and reduced side effects as compared to conventional photon therapies using X-rays.
Products accounted for the largest share in the particle therapy market by products and services
Based on products & services, the market is segmented into products and services. In 2021, products are estimated to account for the largest share of 78.6% of the market. The increasing incidence of cancer cases is the major factor responsible for the growth of this segment.
Cyclotrons segment accounted for the largest share in the particle therapy market by Products
Based on product, the market is further segmented into cyclotrons, synchrotrons, and synchrocyclotrons. In 2021, the cyclotrons segment is expected to account for a share of 71.4% of the market; this segment is projected to grow at a CAGR of 6.7% during the forecast period. The development of technologically advanced systems, advantages offered by cyclotrons over other accelerators, and the growing adoption of cyclotrons among users are the major factors driving the growth of this market segment.
Asia pacific segment accounted for the largest share in the particle therapy market by Region
The market has been segmented on the basis of five regional segments, namely, North America, Europe, the Asia Pacific, Latin America, and the Middle East & Africa. Among these, the Asia Pacific market is expected to account for the largest market share in 2021 and is also projected to witness the highest growth rate during the forecast period. The Asia Pacific region is expected to offer significant growth opportunities for players operating in the market owing to the increasing healthcare expenditure and growing initiatives to promote the use of advanced particle therapy technologies in the Asia Pacific countries.
Geographic Snapshot: soft tissue repair Market
To know about the assumptions considered for the study, download the pdf brochure
Prominent players in the particle therapy market include IBA Worldwide (EU), Varian Medical Systems, Inc. (US), Hitachi, Ltd. (Japan), Mevion Medical Systems (US), and Sumitomo Heavy Industries, Ltd. (Japan). These players have adopted various growth strategies such as acquisition, product launches, and expansion to increase their presence and reach in the market
Particle Therapy Market Report Scope:
Report Metric |
Details |
Market Size Available for Years |
2020–2027 |
Base Year Considered |
2021 |
Forecast Period |
2022–2027 |
Forecast Unit |
Value (USD Million) |
Segments Covered |
By Product, Application, End User and Region |
Countries Covered |
|
Companies Covered |
IBA Worldwide (EU), Mevion Medical Systems (US), Varian Medical Systems, Inc. (US), Sumitomo Heavy Industries, Ltd. (Japan), Hitachi, Ltd. (Japan), Toshiba Medical Systems Corporation (Japan), and Provision Healthcare, LLC (US) among others. |
The research report categorizes particle therapy market into the following segments and sub-segments:
By Type
- Proton Therapy
- Heavy Ion Therapy
By Product & Service
-
Products
- Cyclotrons
- Synchrotrons
- Synchrocyclotrons
- Services
By System
- Multi-Room Systems
- Single-Room Systems
By Cancer Type
- Pediatric Cancer
- Prostate Cancer
- Lung Cancer
- Breast Cancer
- Head and Neck Cancer
- Other Cancers
By Application
- By App Treatment Applications
- Research Applications
By Region
-
North America
- US
- Canada
-
Europe
- Germany
- France
- UK
- Italy
- Spain
- Rest of europe
-
Asia pacific
- Japan
- China
- India
- Rest of Asia Pacific
- Latin america
- Middle east & africa
Recent Developments:
- In January 2019, Varian Medical Systems, Inc. (US) partnership with Oncora Medical (US). This investment partnership was aimed at accelerating the development of software tools to enable precision medicine in radiation oncology.
- In April 2021 2021, IBA Worldwide (EU) partnership with Tractebel (US). This partnership agreement to support IBA’s customers with their proton therapy design and construction projects.
Frequently Asked Questions (FAQ):
What is the projected market value of the global particle therapy market?
The global market of particle therapy is projected to reach USD 1,004 million.
What is the estimated growth rate (CAGR) of the global particle therapy market for the next five years?
The global particle therapy market is projected to grow at a Compound Annual Growth Rate (CAGR) of 8.2% from 2022 to 2027.
What are the major revenue pockets in the particle therapy market currently?
The market has been segmented on the basis of five regional segments, namely, North America, Europe, the Asia Pacific, Latin America, and the Middle East & Africa. Among these, the Asia Pacific market is expected to account for the largest market share in 2021 and is also projected to witness the highest growth rate during the forecast period. The Asia Pacific region is expected to offer significant growth opportunities for players operating in the particle therapy market owing to the increasing healthcare expenditure and growing initiatives to promote the use of advanced particle therapy technologies in the Asia Pacific countries.
To speak to our analyst for a discussion on the above findings, click Speak to Analyst
TABLE OF CONTENTS
1 INTRODUCTION (Page No. - 27)
1.1 STUDY OBJECTIVES
1.2 MARKET DEFINITION
1.2.1 INCLUSIONS AND EXCLUSIONS
1.3 MARKET SCOPE
1.3.1 MARKETS COVERED
1.3.2 MARKETS COVERED – BY REGION
1.3.3 YEARS CONSIDERED
1.4 CURRENCY
TABLE 1 EXCHANGE RATES UTILIZED FOR CONVERSION TO USD
1.5 STAKEHOLDERS
1.6 SUMMARY OF CHANGES
2 RESEARCH METHODOLOGY (Page No. - 32)
2.1 RESEARCH APPROACH
FIGURE 1 RESEARCH DESIGN
2.1.1 SECONDARY DATA
2.1.1.1 Key data from secondary sources
2.1.2 PRIMARY DATA
2.1.2.1 Primary sources
2.1.2.2 Key data from primary sources
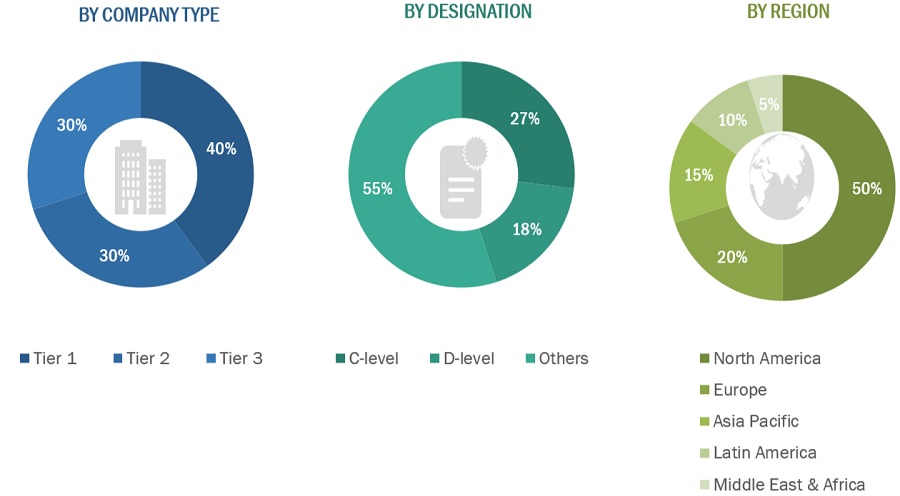
2.1.2.3 Breakdown of primaries
FIGURE 2 BREAKDOWN OF PRIMARY INTERVIEWS (SUPPLY SIDE): BY COMPANY TYPE, DESIGNATION, AND REGION
FIGURE 3 BREAKDOWN OF PRIMARY INTERVIEWS (DEMAND SIDE): BY END USER TYPE, DESIGNATION, AND REGION
2.2 MARKET SIZE ESTIMATION
FIGURE 4 MARKET SIZE ESTIMATION: REVENUE SHARE ANALYSIS (2020)
FIGURE 5 SUPPLY SIDE ANALYSIS: MARKET
FIGURE 6 TOP-DOWN APPROACH
FIGURE 7 CAGR PROJECTIONS FROM ANALYSIS OF DRIVERS, RESTRAINTS, OPPORTUNITIES, AND CHALLENGES (2022– 2027)
FIGURE 8 CAGR PROJECTIONS: SUPPLY SIDE ANALYSIS (2021)
2.3 MARKET BREAKDOWN & DATA TRIANGULATION
FIGURE 9 DATA TRIANGULATION METHODOLOGY
2.4 KEY INDUSTRY INSIGHTS
2.5 LIMITATIONS
2.5.1 METHODOLOGY-RELATED LIMITATIONS
2.6 RISK ASSESSMENT
2.7 STUDY ASSUMPTIONS
3 EXECUTIVE SUMMARY (Page No. - 45)
FIGURE 10 PARTICLE THERAPY MARKET, BY TYPE, 2022 VS. 2027 (USD MILLION)
FIGURE 11 MARKET, BY PRODUCT & SERVICE, 2022 VS. 2027 (USD MILLION)
FIGURE 12 MARKET, BY PRODUCTS, 2022 VS. 2027 (USD MILLION)
FIGURE 13 MARKET, BY SYSTEMS, 2022 VS. 2027 (USD MILLION)
FIGURE 14 MARKET, BY CANCER TYPE, 2022 VS. 2027 (USD MILLION)
FIGURE 15 MARKET, BY APPLICATION, 2022 VS. 2027 (USD MILLION)
FIGURE 16 GEOGRAPHICAL SNAPSHOT OF MARKET
4 PREMIUM INSIGHTS (Page No. - 50)
4.1 MARKET OVERVIEW
FIGURE 17 INCREASING CANCER PREVALENCE TO DRIVE MARKET GROWTH
4.2 REGIONAL MIX: MARKET
FIGURE 18 ASIA PACIFIC TO REGISTER HIGHEST CAGR DURING FORECAST PERIOD
4.3 ASIA PACIFIC: PARTICLE THERAPY M ARKET, BY TYPE AND COUNTRY (2021)
FIGURE 19 PROTON THERAPY TO ACCOUNT FOR LARGEST SHARE OF ASIA PACIFIC MARKET IN 2021
4.4 MARKET: GEOGRAPHIC GROWTH OPPORTUNITIES
FIGURE 20 CHINA TO REGISTER HIGHEST REVENUE GROWTH DURING FORECAST PERIOD
4.5 MARKET: DEVELOPED VS. DEVELOPING MARKETS
FIGURE 21 DEVELOPING MARKETS TO REGISTER HIGHER GROWTH RATE DURING FORECAST PERIOD
5 MARKET OVERVIEW (Page No. - 54)
5.1 INTRODUCTION
TABLE 2 MARKET DYNAMICS: IMPACT ANALYSIS
5.1.1 DRIVERS
5.1.1.1 Advantages offered by particle therapy over photon therapy
5.1.1.2 Growing global prevalence of cancer
5.1.1.3 Growing adoption of particle therapy in clinical trials
5.1.1.4 Increasing number of particle therapy centers worldwide
5.1.1.5 Rising technological advancements
5.1.2 RESTRAINTS
5.1.2.1 Infrastructural challenges in healthcare facilities
5.1.2.2 Affordability and accessibility of treatments
5.1.2.3 Unfavorable reimbursement policies and limited insurance coverage for particle therapy
5.1.3 OPPORTUNITIES
5.1.3.1 Growing adoption of particle therapy in emerging markets
5.1.3.2 Rising healthcare expenditure across developing countries
5.1.4 CHALLENGES
5.1.4.1 Difficulties in visualizing tumors during particle therapy procedures
5.1.4.2 Increasing risk of radiation exposure
5.2 COVID-19 IMPACT ON ECONOMIC SCENARIO IN PARTICLE THERAPY MARKET
5.3 ECOSYSTEM ANALYSIS
FIGURE 22 MARKET: ECOSYSTEM ANALYSIS
5.4 PRICING ANALYSIS
5.5 SUPPLY CHAIN ANALYSIS
FIGURE 23 SUPPLY CHAIN ANALYSIS: MARKET (2021)
5.6 PATENT ANALYSIS
5.6.1 PATENT PUBLICATION TRENDS FOR MARKET
FIGURE 24 GLOBAL PATENT PUBLICATION TRENDS IN PARTICLE THERAPY, 2016-2021
5.6.2 TOP APPLICANTS (COMPANIES) FOR PARTICLE THERAPY PATENTS
FIGURE 25 TOP COMPANIES THAT APPLIED FOR PARTICLE THERAPY PRODUCTS PATENTS, 2016–2021
5.6.3 JURISDICTION ANALYSIS: TOP APPLICANTS (COUNTRIES) FOR PATENTS IN MARKET
FIGURE 26 JURISDICTION ANALYSIS: TOP APPLICANT COUNTRIES FOR PARTICLE THERAPY PATENTS, 2016–2021
5.7 VALUE CHAIN ANALYSIS
FIGURE 27 MARKET: VALUE CHAIN ANALYSIS (2021)
5.8 TECHNOLOGY ANALYSIS
5.9 KEY CONFERENCES & EVENTS IN 2022-2023
5.10 REGULATORY LANDSCAPE
TABLE 3 LIST OF REGULATORY BODIES, GOVERNMENT AGENCIES, AND OTHER ORGANIZATIONS IN DIFFERENT REGIONS/COUNTRIES
TABLE 4 REGULATORY STANDARDS/APPROVALS REQUIRED FOR PARTICLE THERAPY PRODUCTS BY COUNTRY/REGION
5.11 PORTER’S FIVE FORCES ANALYSIS
TABLE 5 MARKET: PORTER’S FIVE FORCES ANALYSIS
5.11.1 THREAT OF NEW ENTRANTS
FIGURE 28 THREAT OF NEW ENTRANTS
5.11.2 THREAT OF SUBSTITUTES
FIGURE 29 THREAT OF SUBSTITUTES
5.11.3 BARGAINING POWER OF SUPPLIERS
FIGURE 30 BARGAINING POWER OF SUPPLIERS
5.11.4 BARGAINING POWER OF BUYERS
FIGURE 31 BARGAINING POWER OF BUYERS
5.11.5 DEGREE OF COMPETITION
FIGURE 32 DEGREE OF COMPETITION
5.12 KEY STAKEHOLDERS & BUYING CRITERIA
5.12.1 KEY STAKEHOLDERS IN BUYING PROCESS
FIGURE 33 INFLUENCE OF STAKEHOLDERS IN BUYING PROCESS FOR TOP 3 APPLICATIONS
TABLE 6 INFLUENCE OF STAKEHOLDERS IN BUYING PROCESS FOR TOP 3 APPLICATIONS (%)
5.12.2 BUYING CRITERIA
FIGURE 34 KEY BUYING CRITERIA FOR TOP 3 APPLICATIONS
TABLE 7 KEY BUYING CRITERIA FOR TOP 3 APPLICATIONS
6 PARTICLE THERAPY MARKET, BY TYPE (Page No. - 75)
6.1 INTRODUCTION
TABLE 8 MARKET, BY TYPE, 2020–2027 (USD MILLION)
6.2 PROTON THERAPY
6.2.1 PROTON THERAPY TO BE INCREASINGLY ADOPTED AS PRIMARY TREATMENT MODE FOR VARIOUS CANCER TYPES
TABLE 9 MARKET FOR PROTON THERAPY, BY COUNTRY, 2020–2027 (USD MILLION)
6.3 HEAVY ION THERAPY
6.3.1 USE OF HEAVY ION THERAPY TO BE STILL IN EXPERIMENTAL PHASE ACROSS MANY REGIONS
TABLE 10 MARKET FOR HEAVY ION THERAPY, BY COUNTRY, 2020–2027 (USD MILLION)
7 PARTICLE THERAPY MARKET, BY PRODUCT & SERVICE (Page No. - 79)
7.1 INTRODUCTION
TABLE 11 MARKET, BY PRODUCT & SERVICE, 2020–2027 (USD MILLION)
7.2 PRODUCTS
TABLE 12 PARTICLE THERAPY PRODUCTS MARKET, BY TYPE, 2020–2027(USD MILLION)
TABLE 13 PARTICLE THERAPY PRODUCT MARKET, BY COUNTRY, 2020–2027 (USD MILLION)
7.3 CYCLOTRONS
7.3.1 INCREASED MANUFACTURING BY LEADING PLAYERS IN PARTICLE THERAPY TO PROPEL MARKET GROWTH
TABLE 14 PARTICLE THERAPY CYCLOTRONS MARKET, BY COUNTRY, 2020–2027 (USD MILLION)
7.4 SYNCHROTRONS
7.4.1 INCREASING INVESTMENTS FOR DEVELOPMENT FACILITIES TO AID MARKET GROWTH
TABLE 15 PARTICLE THERAPY SYNCHROTRONS MARKET, BY COUNTRY, 2020–2027 (USD MILLION)
7.5 SYNCHROCYCLOTRON
7.5.1 HIGH SPACE REQUIREMENTS TO LIMIT WIDESPREAD ADAPTION
TABLE 16 PARTICLE THERAPY SYNCHROCYCLOTRON MARKET, BY COUNTRY, 2020–2027 (USD MILLION)
7.6 SERVICES
TABLE 17 PARTICLE THERAPY SERVICES MARKET, BY COUNTRY, 2020–2027 (USD MILLION)
8 PARTICLE THERAPY MARKET, BY SYSTEM (Page No. - 86)
8.1 INTRODUCTION
TABLE 18 MARKET, BY SYSTEM, 2020–2027 (USD MILLION)
8.2 MULTI-ROOM SYSTEMS
8.2.1 LOWER SHIELDING REQUIREMENTS AND FASTER BEAM-SWITCHING CAPABILITIES TO DRIVE INTEREST AMONG END USERS
TABLE 19 MARKET FOR MULTI-ROOM SYSTEMS, BY COUNTRY, 2020–2027 (USD MILLION)
8.3 SINGLE-ROOM SYSTEMS
8.3.1 COMPACT STRUCTURE AND REDUCED CAPITAL COSTS TO PROPEL SEGMENT GROWTH
TABLE 20 MARKET FOR SINGLE ROOM SYSTEM, BY COUNTRY, 2020–2027 (USD MILLION)
9 PARTICLE THERAPY MARKET, BY CANCER TYPE (Page No. - 90)
9.1 INTRODUCTION
TABLE 21 MARKET, BY CANCER TYPE, 2020–2027 (USD MILLION)
9.2 PEDIATRIC CANCER
9.2.1 BETTER CONTROL OF RADIATION WITH PARTICLE THERAPY TO POPULARIZE THIS TREATMENT MODE
TABLE 22 MARKET FOR PEDIATRIC CANCER, BY COUNTRY, 2020–2027 (USD MILLION)
9.3 PROSTATE CANCER
9.3.1 PARTICLE THERAPY TO OFFER MINIMALLY INVASIVE ALTERNATIVE WITH INCREASED ACCURACY
TABLE 23 MARKET FOR PROSTATE CANCER, BY COUNTRY, 2020–2027 (USD MILLION)
9.4 LUNG CANCER
9.4.1 RISING NUMBER OF CLINICAL TRIALS TO OPTIMIZE PARTICLE THERAPY TO DRIVE MARKET GROWTH
TABLE 24 MARKET FOR LUNG CANCER, BY COUNTRY, 2020–2027 (USD MILLION)
9.5 BREAST CANCER
9.5.1 LIMITED RADIATION EXPOSURE WITH REDUCED SIDE-EFFECTS TO INCREASE ADOPTION OF PARTICLE THERAPY
TABLE 25 MARKET FOR BREAST CANCER, BY COUNTRY, 2020–2027 (USD MILLION)
9.6 HEAD & NECK CANCER
9.6.1 USE OF PENCIL-BEAM SCANNING FOR PROTON THERAPY TO SUPPORT SEGMENT GROWTH
TABLE 26 MARKET FOR HEAD AND NECK CANCER, BY COUNTRY, 2020–2027 (USD MILLION)
9.7 OTHER CANCERS
TABLE 27 MARKET FOR OTHER CANCERS, BY COUNTRY, 2020–2027 (USD MILLION)
10 PARTICLE THERAPY MARKET, BY APPLICATION (Page No. - 98)
10.1 INTRODUCTION
TABLE 28 MARKET, BY APPLICATION, 2020–2027 (USD MILLION)
10.2 TREATMENT APPLICATIONS
10.2.1 INTRODUCTION OF SMALL FOOTPRINT SINGLE-ROOM PARTICLE THERAPY CENTERS TO PROMOTE PARTICLE THERAPY FOR CANCER TREATMENT
TABLE 29 MARKET FOR TREATMENT APPLICATION, BY COUNTRY, 2020–2027 (USD MILLION)
10.3 RESEARCH APPLICATIONS
10.3.1 INCREASING AVAILABILITY OF FUNDING FOR PARTICLE THERAPY-RELATED RESEARCH PROJECTS TO PROVIDE GROWTH OPPORTUNITIES
TABLE 30 MARKET FOR RESEARCH APPLICATION, BY COUNTRY, 2020–2027 (USD MILLION)
11 PARTICLE THERAPY MARKET, BY REGION (Page No. - 102)
11.1 INTRODUCTION
FIGURE 35 CHINA TO DOMINATE MARKET DURING FORECAST PERIOD
TABLE 31 MARKET, BY REGION, 2020–2027 (USD MILLION)
TABLE 32 MARKET, BY COUNTRY, 2020–2027 (USD MILLION)
11.2 NORTH AMERICA
FIGURE 36 NORTH AMERICA: PARTICLE THERAPY MARKET SNAPSHOT
TABLE 33 NORTH AMERICA: MARKET, BY COUNTRY, 2020–2027 (USD MILLION)
TABLE 34 NORTH AMERICA: MARKET, BY TYPE, 2020–2027 (USD MILLION)
TABLE 35 NORTH AMERICA: MARKET, BY PRODUCT & SERVICE, 2020–2027 (USD MILLION)
TABLE 36 NORTH AMERICA: MARKET, BY PRODUCT, 2020–2027 (USD MILLION)
TABLE 37 NORTH AMERICA: MARKET, BY SYSTEM, 2020–2027 (USD MILLION)
TABLE 38 NORTH AMERICA: MARKET, BY CANCER TYPE, 2020–2027 (USD MILLION)
TABLE 39 NORTH AMERICA: MARKET, BY APPLICATION, 2020–2027 (USD MILLION)
11.2.1 US
11.2.1.1 Growing number of particle therapy centers to drive market growth
TABLE 40 US: MACROECONOMIC INDICATORS
TABLE 41 US: PARTICLE THERAPY MARKET, BY TYPE, 2020–2027 (USD MILLION)
TABLE 42 US: MARKET, BY PRODUCT & SERVICE, 2020–2027 (USD MILLION)
TABLE 43 US: MARKET, BY PRODUCT, 2020–2027 (USD MILLION)
TABLE 44 US: MARKET, BY SYSTEM, 2020–2027 (USD MILLION)
TABLE 45 US: MARKET, BY CANCER TYPE, 2020–2027 (USD MILLION)
TABLE 46 US: MARKET, BY APPLICATION, 2020–2027 (USD MILLION)
11.2.2 CANADA
11.2.2.1 Canadian government to initiate inclusion of particle therapy as treatment method
TABLE 47 CANADA: MACROECONOMIC INDICATORS
TABLE 48 CANADA: PARTICLE THERAPY MARKET, BY TYPE, 2020–2027 (USD MILLION)
TABLE 49 CANADA: MARKET, BY PRODUCT & SERVICE, 2020–2027 (USD MILLION)
TABLE 50 CANADA: MARKET, BY PRODUCT, 2020–2027 (USD MILLION)
TABLE 51 CANADA: MARKET, BY SYSTEM, 2020–2027 (USD MILLION)
TABLE 52 CANADA: MARKET, BY CANCER TYPE, 2020–2027 (USD MILLION)
TABLE 53 CANADA: MARKET, BY APPLICATION, 2020–2027 (USD MILLION)
11.3 EUROPE
FIGURE 37 EUROPE: PARTICLE THERAPY MARKET SNAPSHOT
TABLE 54 EUROPE: MARKET, BY COUNTRY, 2020–2027 (USD MILLION)
TABLE 55 EUROPE: MARKET, BY TYPE, 2020–2027 (USD MILLION)
TABLE 56 EUROPE: MARKET, BY PRODUCT & SERVICE, 2020–2027 (USD MILLION)
TABLE 57 EUROPE: MARKET, BY PRODUCT, 2020–2027 (USD MILLION)
TABLE 58 EUROPE: MARKET, BY SYSTEM, 2020–2027 (USD MILLION)
TABLE 59 EUROPE: MARKET, BY CANCER TYPE, 2020–2027 (USD MILLION)
TABLE 60 EUROPE: MARKET, BY APPLICATION, 2020–2027 (USD MILLION)
11.3.1 GERMANY
11.3.1.1 Increasing research in proton and heavy ion therapy to drive market growth
TABLE 61 GERMANY: MACROECONOMIC INDICATORS
TABLE 62 GERMANY: PARTICLE THERAPY MARKET, BY TYPE, 2020–2027 (USD MILLION)
TABLE 63 GERMANY: MARKET, BY PRODUCT & SERVICE, 2020–2027 (USD MILLION)
TABLE 64 GERMANY: MARKET, BY PRODUCT, 2020–2027 (USD MILLION)
TABLE 65 GERMANY: MARKET, BY SYSTEM, 2020–2027 (USD MILLION)
TABLE 66 GERMANY: MARKET, BY CANCER TYPE, 2020–2027 (USD MILLION)
TABLE 67 GERMANY: MARKET, BY APPLICATION, 2020–2027 (USD MILLION)
11.3.2 FRANCE
11.3.2.1 Increasing healthcare expenditure to support particle therapy products adoption
TABLE 68 FRANCE: MACROECONOMIC INDICATORS
TABLE 69 FRANCE: PARTICLE THERAPY MARKET, BY TYPE, 2020–2027 (USD MILLION)
TABLE 70 FRANCE: MARKET, BY PRODUCT & SERVICE, 2020–2027 (USD MILLION)
TABLE 71 FRANCE: MARKET, BY PRODUCT, 2020–2027 (USD MILLION)
TABLE 72 FRANCE: MARKET, BY SYSTEM, 2020–2027 (USD MILLION)
TABLE 73 FRANCE: MARKET, BY CANCER TYPE, 2020–2027 (USD MILLION)
TABLE 74 FRANCE: MARKET, BY APPLICATION, 2020–2027 (USD MILLION)
11.3.3 UK
11.3.3.1 Cyclotrons segment to dominate market growth
TABLE 75 UK: MACROECONOMIC INDICATORS
TABLE 76 UK: PARTICLE THERAPY MARKET, BY TYPE, 2020–2027 (USD MILLION)
TABLE 77 UK: MARKET, BY PRODUCT & SERVICE, 2020–2027 (USD MILLION)
TABLE 78 UK: MARKET, BY PRODUCT, 2020–2027 (USD MILLION)
TABLE 79 UK: MARKET, BY SYSTEM, 2020–2027 (USD MILLION)
TABLE 80 UK: MARKET, BY CANCER TYPE, 2020–2027 (USD MILLION)
TABLE 81 UK: MARKET, BY APPLICATION, 2020–2027 (USD MILLION)
11.3.4 ITALY
11.3.4.1 Increasing awareness activities to support market growth
TABLE 82 ITALY: MACROECONOMIC INDICATORS
TABLE 83 ITALY: PARTICLE THERAPY MARKET, BY TYPE, 2020–2027 (USD MILLION)
TABLE 84 ITALY: MARKET, BY PRODUCT & SERVICE, 2020–2027 (USD MILLION)
TABLE 85 ITALY: MARKET, BY PRODUCT, 2020–2027 (USD MILLION)
TABLE 86 ITALY: MARKET, BY SYSTEM, 2020–2027 (USD MILLION)
TABLE 87 ITALY: MARKET, BY CANCER TYPE, 2020–2027 (USD MILLION)
TABLE 88 ITALY: MARKET, BY APPLICATION, 2020–2027 (USD MILLION)
11.3.5 SPAIN
11.3.5.1 Increasing number of conferences and government funding for cancer research to drive market growth
TABLE 89 SPAIN: MACROECONOMIC INDICATORS
TABLE 90 SPAIN: PARTICLE THERAPY MARKET, BY TYPE, 2020–2027 (USD MILLION)
TABLE 91 SPAIN: MARKET, BY PRODUCT & SERVICE, 2020–2027 (USD MILLION)
TABLE 92 SPAIN: MARKET, BY PRODUCT, 2020–2027 (USD MILLION)
TABLE 93 SPAIN: MARKET, BY SYSTEM, 2020–2027 (USD MILLION)
TABLE 94 SPAIN: MARKET, BY CANCER TYPE, 2020–2027 (USD MILLION)
TABLE 95 SPAIN: MARKET, BY APPLICATION, 2020–2027 (USD MILLION)
11.3.6 REST OF EUROPE
TABLE 96 REST OF EUROPE: PARTICLE THERAPY MARKET, BY TYPE, 2020–2027 (USD MILLION)
TABLE 97 REST OF EUROPE: MARKET, BY PRODUCT & SERVICE, 2020–2027 (USD MILLION)
TABLE 98 REST OF EUROPE: MARKET, BY PRODUCT, 2020–2027 (USD MILLION)
TABLE 99 REST OF EUROPE: MARKET, BY SYSTEM, 2020–2027 (USD MILLION)
TABLE 100 REST OF EUROPE: MARKET, BY CANCER TYPE, 2020–2027 (USD MILLION)
TABLE 101 REST OF EUROPE: MARKET, BY APPLICATION, 2020–2027 (USD MILLION)
11.4 ASIA PACIFIC
FIGURE 38 ASIA PACIFIC: PARTICLE THERAPY MARKET SNAPSHOT
TABLE 102 ASIA PACIFIC: MARKET, BY COUNTRY, 2020–2027 (USD MILLION)
TABLE 103 ASIA PACIFIC: MARKET, BY TYPE, 2020–2027 (USD MILLION)
TABLE 104 ASIA PACIFIC: MARKET, BY PRODUCT & SERVICE, 2020–2027 (USD MILLION)
TABLE 105 ASIA PACIFIC: MARKET, BY PRODUCT, 2020–2027 (USD MILLION)
TABLE 106 ASIA PACIFIC: MARKET, BY SYSTEM, 2020–2027 (USD MILLION)
TABLE 107 ASIA PACIFIC: MARKET, BY CANCER TYPE, 2020–2027 (USD MILLION)
TABLE 108 ASIA PACIFIC: MARKET, BY APPLICATION, 2020–2027 (USD MILLION)
11.4.1 JAPAN
11.4.1.1 Increasing use of heavy ion therapy for cancer treatment to propel market growth
TABLE 109 JAPAN: MACROECONOMIC INDICATORS
TABLE 110 JAPAN: PARTICLE THERAPY MARKET, BY TYPE, 2020–2027 (USD MILLION)
TABLE 111 JAPAN: MARKET, BY PRODUCT & SERVICE, 2020–2027 (USD MILLION)
TABLE 112 JAPAN: MARKET, BY PRODUCT, 2020–2027 (USD MILLION)
TABLE 113 JAPAN: MARKET, BY SYSTEM, 2020–2027 (USD MILLION)
TABLE 114 JAPAN: MARKET, BY CANCER TYPE, 2020–2027 (USD MILLION)
TABLE 115 JAPAN: MARKET, BY APPLICATION, 2020–2027 (USD MILLION)
11.4.2 CHINA
11.4.2.1 Growing interest of major market players to increase their presence to drive market growth
TABLE 116 CHINA: MACROECONOMIC INDICATORS
TABLE 117 CHINA: PARTICLE THERAPY MARKET, BY TYPE, 2020–2027 (USD MILLION)
TABLE 118 CHINA: MARKET, BY PRODUCT & SERVICE, 2020–2027 (USD MILLION)
TABLE 119 CHINA: MARKET, BY PRODUCT, 2020–2027 (USD MILLION)
TABLE 120 CHINA: MARKET, BY SYSTEM, 2020–2027 (USD MILLION)
TABLE 121 CHINA: MARKET, BY CANCER TYPE, 2020–2027 (USD MILLION)
TABLE 122 CHINA: MARKET, BY APPLICATION, 2020–2027 (USD MILLION)
11.4.3 INDIA
11.4.3.1 Leading product manufacturers with high growth opportunities to propel market growth
TABLE 123 INDIA: MACROECONOMIC INDICATORS
TABLE 124 INDIA: PARTICLE THERAPY MARKET, BY TYPE, 2020–2027 (USD MILLION)
TABLE 125 INDIA: MARKET, BY PRODUCT & SERVICE, 2020–2027 (USD MILLION)
TABLE 126 INDIA: MARKET, BY PRODUCT, 2020–2027 (USD MILLION)
TABLE 127 INDIA: MARKET, BY SYSTEM, 2020–2027 (USD MILLION)
TABLE 128 INDIA: MARKET, BY CANCER TYPE, 2020–2027 (USD MILLION)
TABLE 129 INDIA: MARKET, BY APPLICATION, 2020–2027 (USD MILLION)
11.4.4 REST OF ASIA PACIFIC
TABLE 130 REST OF ASIA PACIFIC: PARTICLE THERAPY MARKET, BY TYPE, 2020–2027 (USD MILLION)
TABLE 131 REST OF ASIA PACIFIC: MARKET, BY PRODUCT & SERVICE, 2020–2027 (USD MILLION)
TABLE 132 REST OF ASIA PACIFIC: MARKET, BY PRODUCT, 2020–2027 (USD MILLION)
TABLE 133 REST OF ASIA PACIFIC: MARKET, BY SYSTEM, 2020–2027 (USD MILLION)
TABLE 134 REST OF ASIA PACIFIC: MARKET, BY CANCER TYPE, 2020–2027 (USD MILLION)
TABLE 135 REST OF ASIA PACIFIC: MARKET, BY APPLICATION, 2020–2027 (USD MILLION)
11.5 LATIN AMERICA
11.5.1 LOW-COST SURGERIES TO DRIVE MEDICAL TOURISM
TABLE 136 LATIN AMERICA: PARTICLE THERAPY MARKET, BY TYPE, 2020–2027 (USD MILLION)
TABLE 137 LATIN AMERICA: MARKET, BY PRODUCT & SERVICE, 2020–2027 (USD MILLION)
TABLE 138 LATIN AMERICA: MARKET, BY PRODUCT, 2020–2027 (USD MILLION)
TABLE 139 LATIN AMERICA: MARKET, BY SYSTEM, 2020–2027 (USD MILLION)
TABLE 140 LATIN AMERICA: MARKET, BY CANCER TYPE, 2020–2027 (USD MILLION)
TABLE 141 LATIN AMERICA: MARKET, BY APPLICATION, 2020–2027 (USD MILLION)
11.6 MIDDLE EAST & AFRICA
11.6.1 IMPROVING HEALTHCARE INFRASTRUCTURE AND INCREASING PUBLIC-PRIVATE INVESTMENTS TO DRIVE MARKET GROWTH
TABLE 142 MIDDLE EAST & AFRICA: PARTICLE THERAPY MARKET, BY TYPE, 2020–2027 (USD MILLION)
TABLE 143 MIDDLE EAST & AFRICA: MARKET, BY PRODUCT & SERVICE, 2020–2027 (USD MILLION)
TABLE 144 MIDDLE EAST & AFRICA: MARKET, BY PRODUCT, 2020–2027 (USD MILLION)
TABLE 145 MIDDLE EAST & AFRICA: MARKET, BY SYSTEM, 2020–2027 (USD MILLION)
TABLE 146 MIDDLE EAST & AFRICA: MARKET, BY CANCER TYPE, 2020–2027 (USD MILLION)
TABLE 147 MIDDLE EAST & AFRICA: MARKET, BY APPLICATION, 2020–2027 (USD MILLION)
12 COMPETITIVE LANDSCAPE (Page No. - 156)
12.1 OVERVIEW
12.2 KEY PLAYER STRATEGIES/RIGHT TO WIN
12.3 REVENUE SHARE ANALYSIS OF TOP MARKET PLAYERS
12.4 MARKET SHARE ANALYSIS
12.5 COMPANY EVALUATION QUADRANT
FIGURE 41 PARTICLE THERAPY MARKET: COMPANY EVALUATION MATRIX, 2021
12.5.1 STARS
12.5.2 PERVASIVE PLAYERS
12.5.3 EMERGING LEADERS
12.5.4 PARTICIPANTS
12.6 COMPETITIVE BENCHMARKING
12.6.1 OVERALL COMPANY FOOTPRINT
TABLE 148 OVERALL COMPANY FOOTPRINT (13 COMPANIES)
TABLE 149 COMPANY FOOTPRINT: BY-TYPE (13 COMPANIES)
TABLE 150 COMPANY FOOTPRINT: BY PRODUCT & SERVICES (13 COMPANIES)
TABLE 151 COMPANY FOOTPRINT: BY SYSTEM (13 COMPANIES)
TABLE 152 COMPANY FOOTPRINT: BY CANCER TYPE (13 COMPANIES)
TABLE 153 COMPANY FOOTPRINT: BY APPLICATION (13 COMPANIES)
TABLE 154 COMPANY FOOTPRINT: BY REGION (13 COMPANIES)
12.7 COMPETITIVE SCENARIO
12.7.1 PRODUCT LAUNCHES & APPROVALS
12.7.2 DEALS
TABLE 155 DEALS
12.7.3 EXPANSIONS
TABLE 156 EXPANSIONS
13 COMPANY PROFILES (Page No. - 171)
13.1 KEY PLAYERS
(Business Overview, Products Offered, Recent Developments, and MnM View (Key strengths/Right to Win, Strategic Choices Made, and Weaknesses and Competitive Threats))*
13.1.1 IBA WORLDWIDE
TABLE 157 IBA WORLDWIDE: BUSINESS OVERVIEW
FIGURE 42 IBA WORLDWIDE: COMPANY SNAPSHOT (2021)
13.1.2 VARIAN MEDICAL SYSTEMS, INC.
TABLE 158 VARIAN MEDICAL SYSTEMS, INC.: BUSINESS OVERVIEW
FIGURE 43 VARIAN MEDICAL SYSTEMS, INC: COMPANY SNAPSHOT (2021)
13.1.3 HITACHI LTD.
TABLE 159 HITACHI LTD.: BUSINESS OVERVIEW
FIGURE 44 HITACHI LTD.: COMPANY SNAPSHOT (2020)
13.1.4 MEVION MEDICAL SYSTEMS
TABLE 160 MEVION MEDICAL SYSTEMS: BUSINESS OVERVIEW
13.1.5 SUMITOMO HEAVY INDUSTRIES LTD.
TABLE 161 SUMITOMO HEAVY INDUSTRIES LTD.: BUSINESS OVERVIEW
FIGURE 45 SUMITOMO HEAVY INDUSTRIES LTD.: COMPANY SNAPSHOT (2020)
13.1.6 PROVISION HEALTHCARE, LLC
TABLE 162 PROVISION HEALTHCARE, LLC: BUSINESS OVERVIEW
13.1.7 TOSHIBA MEDICAL SYSTEMS CORPORATION
TABLE 163 TOSHIBA MEDICAL SYSTEMS CORPORATION: BUSINESS OVERVIEW
FIGURE 46 TOSHIBA MEDICAL SYSTEMS CORPORATION: COMPANY SNAPSHOT (2020)
13.1.8 OPTIVUS PROTON THERAPY, INC.
TABLE 164 OPTIVUS PROTON THERAPY, INC.: BUSINESS OVERVIEW
13.1.9 PROTOM INTERNATIONAL, INC.
TABLE 165 PROTOM INTERNATIONAL INC.: BUSINESS OVERVIEW
13.1.10 ADVANCED ONCOTHERAPY PLC.
TABLE 166 ADVANCED ONCOTHERAPY PLC.: BUSINESS OVERVIEW
13.2 OTHER PLAYERS
13.2.1 DANFYSIK A/S
TABLE 167 DANFYSIK A/S.: BUSINESS OVERVIEW
13.2.2 P-CUREA
TABLE 168 P-CURE: BUSINESS OVERVIEW
13.2.3 PTW FREIBURG GMBH
*Details on Business Overview, Products Offered, Recent Developments, and MnM View (Key strengths/Right to Win, Strategic Choices Made, and Weaknesses and Competitive Threats) might not be captured in case of unlisted companies.
14 APPENDIX (Page No. - 201)
14.1 DISCUSSION GUIDE
14.2 INDUSTRY INSIGHTS
14.3 KNOWLEDGE STORE: MARKETSANDMARKETS’ SUBSCRIPTION PORTAL
14.4 AVAILABLE CUSTOMIZATIONS
14.5 RELATED REPORTS
14.6 AUTHOR DETAILS
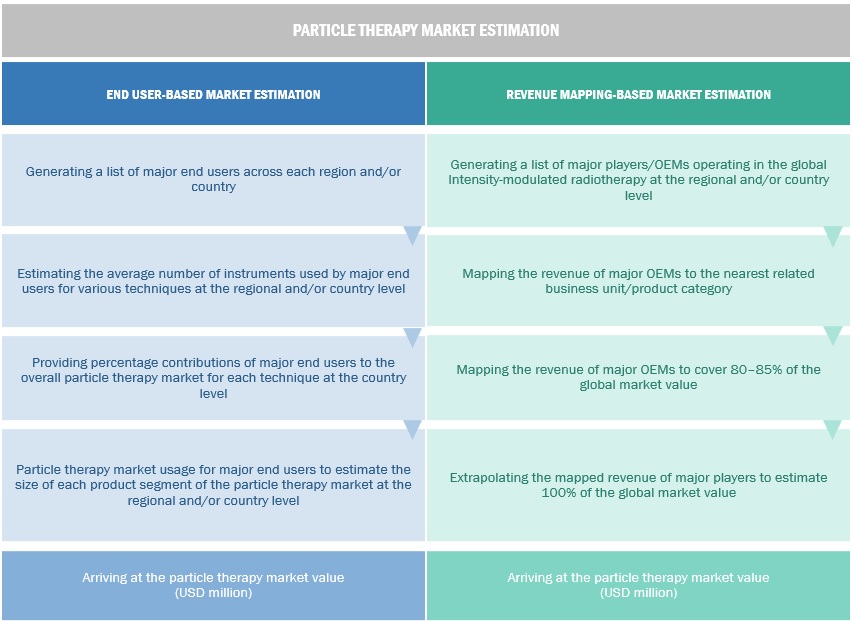
This study involved four major approaches in estimating the current particle therapy market size. Extensive research was conducted to collect information on the market as well as its peer and parent markets. The next step was to validate these findings, assumptions, and sizing with industry experts across the value chain through primary research. Both top-down and bottom-up approaches were employed to estimate the value market. After that, market breakdown and data triangulation procedures were used to estimate the market size of segments and subsegments.
Secondary Research
This research study involved widespread secondary sources; directories; databases such as Bloomberg Business, Factiva, and Dun & Bradstreet; white papers; annual reports; company house documents; investor presentations; and SEC filings of companies. Secondary research was used to identify and collect information useful for the extensive, technical, market-oriented, and commercial study of the particle therapy market. It was also used to obtain important information about key players, market classification and segmentation according to industry trends to the bottom-most level, and key developments related to market and technology perspectives. A database of the key industry leaders was also prepared using secondary research.
Primary Research
In the primary research process, various sources from both the supply and demand sides were interviewed to obtain qualitative and quantitative information for this report. Primary sources from the supply side include industry experts such as CEOs, vice presidents, marketing and sales directors, technology and innovation directors, and related key executives from various key companies and organizations operating in the particle therapy market. Primary sources from the demand side include personnel from hospitals, hospital staff and C-level executives.
Market Size Estimation
The total size of the particle therapy market was arrived at after data triangulation from four different approaches, as mentioned below.
Bottom-up Approach: Revenues of individual companies were gathered from public sources and databases. Shares of the particle therapy businesses of leading players were gathered from secondary sources to the extent available. In certain cases, the share of the business unit was ascertained after a detailed analysis of various parameters, including product portfolio, market positioning, selling price, and geographic reach and strength. Individual shares or revenue estimates were validated through expert interviews.
Country level Analysis: The size of the particle therapy market was obtained from the annual presentations of leading players and secondary data available in the public domain. The share of particle therapy products in the overall market was obtained from secondary data and validated by primary participants to arrive at the total market. Primary participants further validated the numbers.
Primary Interviews: As a part of the primary research process, individual respondent insights on the market size and growth were taken during the interview (regional and global, as applicable). All the responses were collated, and a weighted average was taken to derive a probabilistic estimate of the market size and growth rate.
Geographic market assessment (by region & country): The geographic assessment was done using the following approaches:
Approach 1: Geographic revenue contributions/splits of leading players in the market (wherever available) and respective growth trends
Approach 2: Geographic adoption trends for individual product segments by end users and growth prospects for each of the segments (assumptions and indicative estimates validated from primary interviews)
At each point, the assumptions and approaches were validated through industry experts contacted during primary research. Considering the limitations of data available from secondary research, revenue estimates for individual companies (for the overall particle therapy market and geographic market assessment) were ascertained based on a detailed analysis of their respective product offerings, geographic reach/strength (direct or through distributors or suppliers), and the shares of the leading players in a particular region or country.
To know about the assumptions considered for the study, download the pdf brochure
Data Triangulation
After arriving at the market size, the total market was divided into several segments and subsegments. To complete the overall market engineering process and arrive at the exact statistics for all segments and subsegments, data triangulation and market breakdown procedures were employed wherever applicable.
Approach to derive the market size and estimate market growth
The market rankings for leading players were ascertained after a detailed assessment of their revenues from the particle therapy business using secondary data available through paid and unpaid sources. Owing to data limitations, in certain cases, the revenue share was arrived at after a detailed assessment of the product portfolios of major companies and their respective sales performance. At each point, this data was validated through primary interviews with industry experts.
Objectives of the Study
- To define, describe, analyze, and forecast the particle therapy market by type, products and services, systems, cancer type, application, and region
- To provide detailed information about the major factors influencing the market growth (drivers, restraints, opportunities, and challenges)
- To analyze micro-markets with respect to individual growth trends, prospects, and contributions to the overall market
- To analyze market opportunities for stakeholders and provide details of the competitive landscape for key players
- To forecast the size of the market in North America, Europe, the Asia Pacific, Latin America, and the Middle East & Africa
- To strategically profile key players in the global market and comprehensively analyze their core competencies2
- To track and analyze competitive developments such as product launches, expansions, acquisitions, partnerships, and agreements, in the global particle therapy market
Available Customizations
With the given market data, MarketsandMarkets offers customizations as per your company’s specific needs. The following customization options are available for the report:
Product Analysis
- Further segmentation of individual product segments by cancer type and application
Geographic Analysis
- Further breakdown of the Rest of Asia Pacific particle therapy system market into South Korea, Australia, New Zealand, and others
- Further breakdown of the Rest of Europe particle therapy market into Belgium, Russia, the Netherlands, Switzerland, and others
Company Information
- Detailed analysis and profiling of additional market players (Up to 5)
Growth opportunities and latent adjacency in Particle Therapy Market
Which is the targeted audience in the study of Particle Therapy Market?
How the growing adoption of particle therapy in emerging markets is benefiting global growth of Particle Therapy Market?
What are the recent developments in the global Particle Therapy Market?