Rugged Display Market by Product (Smartphone & Handheld Computer, Tablet, Laptop, Mission-Critical Display, Avionic Display, Vehicle-Mounted), Size, Ruggedness, OS, Vertical (Govt., Defense, Aerospace, Industrial, Transportation) - Global Forecast to 2036


Rugged Display Market Summary
The Rugged Display Market size was valued at approximately USD 10–12 billion in 2025 and is projected to reach around USD 22–25 billion by 2036, growing at a CAGR of 6–8% during the forecast period. The market is witnessing steady expansion driven by the increasing demand for durable, high-performance display solutions across harsh and mission-critical environments. Growth is primarily fueled by the rapid adoption of industrial automation, defense modernization programs, and the expansion of smart infrastructure. The integration of AI-enabled diagnostics, IoT-based monitoring systems, and advanced automation technologies is further accelerating demand for rugged displays in sectors such as aerospace, transportation, oil & gas, and manufacturing. As digital transformation intensifies globally, rugged displays are becoming indispensable for real-time data visualization and operational efficiency in extreme environments.
Key Market Trends & Insights
The Rugged Display Market is evolving rapidly with several notable trends shaping its trajectory. North America continues to dominate the market due to strong defense investments and early adoption of industrial automation technologies. Meanwhile, Asia Pacific is emerging as the fastest-growing region, driven by expanding manufacturing ecosystems and infrastructure development.
The fully rugged display segment leads the market, particularly in military and field operations where durability is critical. Emerging technologies such as sunlight-readable displays, anti-glare coatings, and touch-sensitive rugged screens are gaining traction. Additionally, AI-powered predictive maintenance integrated into display systems is enhancing operational efficiency.
Automation and IoT are significantly influencing the market, enabling real-time monitoring and remote control of industrial systems. The growing demand for edge computing and connected devices is further boosting the adoption of rugged displays across multiple industries.
Market Size & Forecast
-
Base year market size (2025): USD 10–12 billion
-
Forecast market size (2036): USD 22–25 billion
-
CAGR (2025–2036): 6–8%
-
Growth factors: Rising demand for durable displays in harsh environments, increasing adoption of AI and IoT technologies, expansion of industrial automation, and growing investments in defense and aerospace sectors
Rugged Display Market Top 10 key takeaway
-
Growing demand from defense and aerospace sectors is a major growth driver
-
Increasing adoption of AI-enabled rugged display systems
-
Asia Pacific is the fastest-growing regional market
-
Fully rugged displays dominate due to superior durability
-
Industrial automation is boosting demand across manufacturing sectors
-
Integration with IoT platforms enhances real-time monitoring capabilities
-
Expansion of smart cities and infrastructure projects supports market growth
-
Rising demand for sunlight-readable and touch-enabled rugged displays
-
Edge computing and digital transformation are accelerating adoption
-
Continuous innovation in display materials and technologies is driving competitiveness
Product Insights
The fully rugged display segment holds the largest share in the Rugged Display Market, primarily due to its extensive use in defense, aerospace, and heavy industrial applications. These displays are designed to withstand extreme temperatures, vibrations, moisture, and dust, making them ideal for mission-critical environments. Their robust construction, combined with high brightness and readability under direct sunlight, ensures consistent performance in challenging conditions.
Semi-rugged displays are also gaining traction, particularly in logistics, transportation, and field services, where moderate durability is required. These displays offer a balance between cost and performance, making them suitable for commercial applications.
Emerging product categories such as ultra-thin rugged displays and flexible rugged screens are gaining attention. These innovations are driven by advancements in material science and display technologies. AI integration is enabling features such as predictive failure alerts, automated brightness adjustments, and real-time diagnostics, further enhancing product value.
Technology / Component Insights
The Rugged Display Market is heavily influenced by advancements in display technologies, including LCD, LED, and OLED panels. LED-backlit LCDs remain the most widely used due to their durability, energy efficiency, and cost-effectiveness. However, OLED technology is gradually gaining traction due to its superior contrast, flexibility, and lightweight properties.
AI and IoT are playing a transformative role in this market. AI algorithms are being integrated into rugged displays to enable predictive maintenance, anomaly detection, and intelligent user interfaces. IoT connectivity allows these displays to function as part of a larger ecosystem, facilitating real-time data exchange and remote monitoring.
Cloud computing and edge computing are also influencing the market by enabling faster data processing and decision-making at the device level. Automation technologies are further enhancing operational efficiency, particularly in industrial and manufacturing environments.
Future innovations are expected to focus on augmented reality (AR)-enabled rugged displays, enhanced touch sensitivity in extreme conditions, and improved energy efficiency through advanced power management systems.
Application Insights
The defense and aerospace segment dominates the Rugged Display Market, driven by the need for reliable and durable display systems in mission-critical operations. These displays are widely used in military vehicles, aircraft cockpits, and naval systems, where performance under extreme conditions is essential.
The industrial and manufacturing sector is another key application area, benefiting from the increasing adoption of automation and smart factory solutions. Rugged displays are used for monitoring production processes, controlling machinery, and ensuring worker safety.
Transportation and logistics are also emerging as significant application areas, with rugged displays being used in fleet management, navigation systems, and warehouse operations. Additionally, sectors such as oil & gas, healthcare, and public safety are witnessing growing adoption due to the need for reliable display solutions in challenging environments.
Future opportunities lie in the integration of rugged displays with smart city infrastructure and autonomous systems, where real-time data visualization is critical.
Regional Insights
North America leads the Rugged Display Market, supported by strong investments in defense modernization and advanced industrial infrastructure. The presence of key market players and early adoption of cutting-edge technologies further strengthen the region’s dominance.
Europe follows closely, driven by the growing demand for automation and stringent safety regulations across industries. The region is also witnessing increased adoption of rugged displays in transportation and energy sectors.
Asia Pacific is the fastest-growing region, fueled by rapid industrialization, infrastructure development, and expanding manufacturing capabilities. Countries such as China and Japan are investing heavily in smart factories and digital transformation, boosting demand for rugged display solutions.
-
North America dominates due to defense and industrial investments
-
Europe shows steady growth with strong regulatory support
-
Asia Pacific is the fastest-growing region
-
Increasing digitalization is driving regional demand
-
Infrastructure development is a key growth factor globally
Country-Specific Market Trends
In Asia Pacific, China is leading the market with a CAGR of 7–9%, driven by large-scale manufacturing and smart infrastructure projects. Japan follows with a CAGR of 6–8%, supported by technological advancements and automation in industrial sectors.
In North America, the United States dominates with a CAGR of 6–7%, fueled by defense spending and technological innovation. Canada and Mexico are also experiencing moderate growth due to increasing industrial activities.
In Europe, Germany leads with a CAGR of 5–7%, driven by its strong manufacturing base and Industry 4.0 initiatives. France is also witnessing steady growth due to investments in transportation and energy sectors.
-
China is the fastest-growing market in Asia Pacific
-
Japan focuses on automation and advanced technologies
-
The United States leads in defense and innovation
-
Germany drives growth in Europe through Industry 4.0
-
France shows steady adoption in energy and transportation sectors
Key Rugged Display Market Company Insights
The Rugged Display Market is highly competitive, with major players focusing on innovation, product differentiation, and strategic partnerships. Companies are investing in AI integration, advanced materials, and enhanced display technologies to gain a competitive edge.
Key players include Panasonic Corporation, Advantech Co., Ltd., Zebra Technologies Corporation, Getac Technology Corporation, Sparton Corporation, and Winmate Inc. These companies are focusing on developing lightweight, energy-efficient, and highly durable display solutions.
AI adoption is becoming a key strategy, enabling companies to offer smart features such as predictive maintenance and real-time analytics. Product strategies include the launch of customizable rugged displays tailored to specific industry requirements.
-
Companies are focusing on AI-driven innovation
-
Strategic partnerships are enhancing market presence
-
Product customization is a key competitive strategy
-
Investment in advanced materials is increasing
-
Focus on energy efficiency and durability is driving product development
Recent Developments
Recent developments in the Rugged Display Market highlight the growing focus on innovation and technology integration. Several companies have launched AI-enabled rugged displays with enhanced predictive maintenance capabilities and real-time analytics features.
In addition, partnerships between display manufacturers and industrial automation companies are enabling the development of integrated solutions for smart factories. New product launches featuring ultra-bright displays and improved touch sensitivity for extreme conditions are also gaining traction.
Market Segmentation
The Rugged Display Market is segmented based on product, technology, application, and region. By product, the market includes fully rugged, semi-rugged, and ultra-rugged displays. Fully rugged displays dominate due to their extensive use in harsh environments.
By technology, the market is categorized into LCD, LED, and OLED displays, with LED-based LCDs holding the largest share. By application, key segments include defense & aerospace, industrial, transportation, and energy.
Regionally, the market is segmented into North America, Europe, Asia Pacific, and the Rest of the World, with North America leading and Asia Pacific witnessing the fastest growth.
-
Fully rugged displays dominate the product segment
-
LED-based LCD technology leads the market
-
Defense and aerospace is the largest application segment
-
Asia Pacific is the fastest-growing regional market
-
Market segmentation reflects diverse industry applications
The Rugged Display Market is poised for significant growth through 2036, driven by increasing demand for durable and high-performance display solutions across critical industries. The integration of AI, IoT, and automation technologies is transforming the market, enabling smarter and more efficient operations.
As industries continue to embrace digital transformation, rugged displays will play a crucial role in enabling real-time data visualization and decision-making. The market offers substantial growth opportunities for companies that focus on innovation, customization, and strategic partnerships.
FAQs
-
What is the market size of the Rugged Display Market?
The market size was approximately USD 10–12 billion in 2025. -
What is the expected growth rate of the market?
The market is expected to grow at a CAGR of 6–8% from 2025 to 2036. -
What are the key drivers of the Rugged Display Market?
Key drivers include AI integration, IoT adoption, industrial automation, and defense modernization. -
Which region leads the Rugged Display Market?
North America is the leading region. -
Who are the key companies in the market?
Major companies include Panasonic Corporation, Advantech Co., Ltd., Zebra Technologies, Getac Technology, and Winmate Inc.
To speak to our analyst for a discussion on the above findings, click Speak to Analyst
 Exclusive indicates content/data unique to MarketsandMarkets and not available with any competitors.
Table of Contents
1 Introduction (Page No. - 16)
1.1 Objectives of the Study
1.2 Market Definition
1.3 Study Scope
1.3.1 Markets Covered
1.3.2 Scope Definition
1.3.3 Years Considered for the Study
1.4 Currency
1.5 Package Size
1.6 Limitations
1.7 Stakeholders
2 Research Methodology (Page No. - 21)
2.1 Research Data
2.1.1 Secondary Data
2.1.1.1 List of Major Secondary Sources
2.1.1.2 Key Data From Secondary Sources
2.1.2 Primary Data
2.1.2.1 Breakdown of Primaries
2.1.2.2 Key Industry Insights
2.2 Market Size Estimation
2.2.1 Bottom-Up Approach
2.2.1.1 Approach for Capturing Market Share By Bottom-Up Analysis (Demand Side)
2.2.2 Top-Down Approach
2.2.2.1 Approach for Capturing the Market Share By Top-Down Analysis (Supply Side)
2.3 Market Breakdown and Data Triangulation
2.4 Research Assumptions
3 Executive Summary (Page No. - 30)
4 Premium Insights (Page No. - 35)
4.1 Attractive Opportunities in the Rugged Display Market (2017–2023)
4.2 Rugged Display Market, By Product, 2014–2023
4.3 Market, By Display Size, 2014–2023
4.4 Market, By Level of Ruggedness, 2014–2023
4.5 Market, By Operating System, 2017 vs 2023
4.6 Market, By Vertical, 2017 vs 2023
4.7 Market, By Region and Vertical, 2016
5 Market Overview (Page No. - 39)
5.1 Introduction
5.2 Market Dynamics
5.2.1 Drivers
5.2.1.1 Reduced Total Cost of Ownership (TCO) Over A Long Period of Time
5.2.1.2 Rising Demand for HMI and IoT in Various Industries
5.2.2 Restraints
5.2.2.1 Adoption of Consumer-Grade Devices for Industrial Applications
5.2.3 Opportunities
5.2.3.1 Development of OLED and E-Paper Display Technologies
5.2.3.2 Technological Shift and Development of High-Specification Display Devices
5.2.4 Challenges
5.2.4.1 High Initial Cost of Rugged Display Devices
5.2.4.2 Fluctuating Average Selling Price of Display Panels
6 Industry Trends (Page No. - 47)
6.1 Value Chain Analysis
6.1.1 Introduction
6.1.2 Research and Development
6.1.3 Display Panel Manufacturing & Input Suppliers
6.1.4 Device Assembly and Testing
6.1.5 Distribution, Marketing, and Post-Sales Services
6.2 Standards for Ruggedized Devices
6.2.1 Ingress Protection (IP) Rating
6.2.2 Military Standard (MIL-STD) Or Military SPEC (MIL-SPEC)
7 Market Display Market, By Product (Page No. - 51)
7.1 Introduction
7.2 Smartphone and Handheld Computer
7.3 Tablet PC
7.4 Laptop and Notebook
7.5 Avionics Display
7.6 Vehicle-Mounted Computer
7.7 Panel PC & Mission-Critical Display
8 Rugged Display Market, By Level of Ruggedness (Page No. - 72)
8.1 Introduction
8.2 Semi-Rugged
8.3 Fully Rugged
8.4 Ultra-Rugged
9 Rugged Display Market, By Display Size (Page No. - 79)
9.1 Introduction
9.2 Less Than 10 Inches
9.3 10 to 15 Inches
9.4 More Than 15 Inches
10 Rugged Display Market, By Operating System (Page No. - 84)
10.1 Introduction
10.2 Android
10.3 Windows
10.4 Others
11 Rugged Display Market, By Vertical (Page No. - 91)
11.1 Introduction
11.2 Government, Defense, and Aerospace
11.3 Industrial
11.4 Automotive and Transportation
11.5 Healthcare
11.6 Others
12 Geographical Analysis (Page No. - 102)
12.1 Introduction
12.2 North America
12.2.1 US
12.2.2 Canada
12.2.3 Mexico
12.3 Europe
12.3.1 UK
12.3.2 Germany
12.3.3 France
12.3.4 Rest of Europe
12.4 Asia Pacific
12.4.1 China
12.4.2 Japan
12.4.3 South Korea
12.4.4 Rest of APAC
12.5 Rest of the World (RoW)
12.5.1 South America
12.5.2 Middle East
12.5.3 Africa
13 Competitive Landscape (Page No. - 123)
13.1 Overview
13.2 Market Ranking Analysis: Rugged Display Market, 2016
13.3 Competitive Leadership Mapping
13.3.1 Visionary Leaders
13.3.2 Dynamic Differentiators
13.3.3 Innovators
13.3.4 Emerging Companies
13.4 Business Strategy Excellence (25 Companies)
13.5 Strength of Product Portfolio (25 Companies)
*Top 25 companies analyzed for this study are - Getac Technology Corp. (Taiwan), Sparton Corp. (US), Xplore Technologies Corp. (US), Zebra Technologies Corp. (US), Trimble, Inc. (US), Honeywell International, Inc. (US), Esterline Technologies Corp. (US), General Dynamics Corp. (US), Beijer Electronics AB (Sweden), VarTech Systems Inc. (US), Panasonic Corp. (Japan), L3 Technologies, Inc. (US), Kyocera Corp. (Japan), Curtiss-Wright Corp. (US), Bluebird, Inc. (South Korea), MilDef Group AB (Sweden), Handheld Group AB (Sweden), Elbit Systems, Ltd. (Israel), WinMate Inc. (Taiwan), JLT Mobile Computers AB (Sweden), Epsilon Systems Solutions, Inc. (US), Dell Technologies Inc. (US), Advantech Co., Ltd. (Taiwan), AAEON Technology, Inc. (Taiwan), Juniper Systems, Inc. (US)
14 Company Profiles (Page No. - 129)
(Business Overview, Products Offered, Product Offering Scorecard, Business Strategy Scorecard, Recent Developments, Key Relationships)*
14.1 Introduction
14.2 Getac Technology Corp.
14.3 Zebra Technologies Corp.
14.4 Panasonic Corporation
14.5 Sparton Corp.
14.6 Xplore Technologies Corp.
14.7 Beijer Electronics AB
14.8 Kyocera Corp.
14.9 Esterline Technologies Corp.
14.10 L3 Technologies, Inc.
14.11 General Dynamics Corp.
14.12 Curtiss-Wright Corp.
14.13 Key Innovators
14.13.1 Roda Computer GmbH
14.13.2 Bluebird Inc.
14.13.3 Mildef AB
14.13.4 Handheld Group AB
14.13.5 Trimble Inc.
*Details on Business Overview, Products Offered, Product Offering Scorecard, Business Strategy Scorecard, Recent Developments, Key Relationships Might Not Be Captured in Case of Unlisted Companies.
15 Appendix (Page No. - 173)
15.1 Discussion Guide
15.2 Knowledge Store: Marketsandmarkets’ Subscription Portal
15.3 Introducing RT: Real-Time Market Intelligence
15.4 Available Customizations
15.5 Related Reports
15.6 Author Details
List of Tables (63 Tables)
Table 1 IP Rating First Digits: Solid
Table 2 IP Rating Second Digits: Liquids
Table 3 Rugged Display Market, 2014–2023
Table 4 Rugged Display Market Size, By Product, 2014–2023 (Thousand Units)
Table 5 Rugged Display Market, By Product, 2014–2023 (USD Million)
Table 6 Rugged Display Market for Rugged Smartphone & Handheld Computer, By Level of Ruggedness, 2014–2023 (USD Million)
Table 7 Rugged Display Market for Rugged Smartphone & Handheld Computer, By Operating System, 2014–2023 (USD Million)
Table 8 Rugged Display Market for Rugged Smartphone & Handheld Computer, By Vertical, 2014–2023 (USD Million)
Table 9 Market for Rugged Smartphone & Handheld Computer, By Region, 2014–2023 (USD Million)
Table 10 Market for Rugged Tablet PC, By Level of Ruggedness, 2014–2023 (USD Million)
Table 11 Market for Rugged Tablet PC, By Operating System, 2014–2023 (USD Million)
Table 12 Rugged Display Market for Rugged Tablet PC, By Display Size, 2014–2023 (USD Million)
Table 13 Rugged Display Market for Rugged Tablet PC, By Vertical, 2014–2023 (USD Million)
Table 14 Rugged Display Market for Rugged Tablet PC, By Region, 2014–2023 (USD Million)
Table 15 Rugged Display Market for Rugged Laptop and Notebook, By Level of Ruggedness, 2014–2023 (USD Million)
Table 16 Rugged Display Market for Rugged Laptop and Notebook, By Operating System, 2014–2023 (USD Million)
Table 17 Rugged Display Market for Rugged Laptop and Notebook, By Display Size, 2014–2023 (USD Million)
Table 18 Rugged Display Market for Rugged Laptop and Notebook, By Vertical, 2014–2023 (USD Million)
Table 19 Rugged Display Market for Rugged Laptop and Notebook, By Region, 2014–2023 (USD Million)
Table 20 Rugged Display Market for Rugged Avionics Display, By Level of Ruggedness, 2014–2023 (USD Million)
Table 21 Rugged Display Market for Rugged Avionics Display, By Display Size 2014–2023 (USD Million)
Table 22 Rugged Display Market for Rugged Avionics Display, By Region, 2014–2023 (USD Million)
Table 23 Rugged Display Market for Rugged Vehicle-Mounted Computer, By Level of Ruggedness, 2014–2023 (USD Million)
Table 24 Rugged Display Market for Rugged Vehicle-Mounted Computer, By Operating System, 2014–2023 (USD Million)
Table 25 Rugged Display Market for Rugged Vehicle-Mounted Computer, By Display Size, 2014–2023 (USD Million)
Table 26 Market for Rugged Vehicle-Mounted Computer, By Vertical, 2014–2023 (USD Million)
Table 27 Market for Rugged Vehicle-Mounted Computer, By Region, 2014–2023 (USD Million)
Table 28 Market for Panel PC & Mission-Critical Display, By Level of Ruggedness, 2014–2023 (USD Million)
Table 29 Market for Rugged Panel PC & Mission-Critical Display, By Operating System, 2014–2023 (USD Million)
Table 30 Market for Rugged Panel PC & Mission-Critical Display, By Display Size, 2014–2023 (USD Million)
Table 31 Market for Rugged Panel PC & Mission-Critical Display, By Vertical, 2014–2023 (USD Million)
Table 32 Market for Rugged Panel PC & Mission-Critical Display, By Region, 2014–2023 (USD Million)
Table 33 Market, By Level of Ruggedness, 2014–2023 (USD Billion)
Table 34 Market for Semi-Rugged Displays, By Product, 2014–2023 (USD Million)
Table 35 Market for Fully Rugged Display, By Product, 2014–2023 (USD Million)
Table 36 Rugged Display Market for Ultra-Rugged Display, By Product, 2014–2023 (USD Million)
Table 37 Market, By Display Size 2014–2023 (USD Million)
Table 38 Rugged Display Market for Display Size Less Than 10 Inches, By Product, 2014–2023 (USD Million)
Table 39 Rugged Display Market for Display Size Between 10 and 15 Inches, By Product, 2014–2023 (USD Million)
Table 40 Rugged Display Market for Display Size More Than 15 Inches, By Product, 2014–2023 (USD Million)
Table 41 Rugged Display Market, By Operating System, 2014–2023 (USD Billion)
Table 42 Android OS-Based Market, By Product, 2014–2023 (USD Million)
Table 43 Windows OS-Based Market, By Product, 2014–2023 (USD Million)
Table 44 Other OS-Based Market, By Product, 2014–2023 (USD Million)
Table 45 Market, By Vertical, 2014–2023 (USD Million)
Table 46 Market for Government, Defense, and Aerospace Vertical, By Product, 2014–2023 (USD Million)
Table 47 Market for Government, Defense, and Aerospace Vertical, By Region, 2014–2023 (USD Million)
Table 48 Market for Industrial Vertical, By Product, 2014–2023 (USD Million)
Table 49 Market for Industrial Vertical, By Region, 2014–2023 (USD Million)
Table 50 Market for Automotive & Transportation Vertical, By Product, 2014–2023 (USD Million)
Table 51 Market for Automotive & Transportation Vertical, By Region, 2014–2023 (USD Million)
Table 52 Market for Healthcare Vertical, By Product, 2014–2023 (USD Million)
Table 53 Market for Other Verticals, By Product, 2014–2023 (USD Million)
Table 54 Market, By Region, 2014–2023 (USD Million)
Table 55 Market in North America, By Product, 2014–2023 (USD Million)
Table 56 Market in North America, By Country, 2014–2023 (USD Million)
Table 57 Market in Europe, By Product, 2014–2023 (USD Million)
Table 58 Market in Europe, By Country, 2014–2023 (USD Million)
Table 59 Market in APAC, By Product, 2014–2023 (USD Million)
Table 60 Market in APAC, By Country, 2014–2023 (USD Million)
Table 61 Market in RoW, By Product, 2014–2023 (USD Million)
Table 62 Market in RoW, By Region, 2014–2023 (USD Million)
Table 63 Key Player Market Ranking, 2016
List of Figures (56 Figures)
Figure 1 Market Segmentation
Figure 2 Geographic Segmentation
Figure 3 Market: Process Flow of Market Size Estimation
Figure 4 Market: Research Design
Figure 5 Data Triangulation
Figure 6 Assumptions of the Research Study
Figure 7 Fully Rugged Display Devices Expected to Dominate the Market During the Forecast Period
Figure 8 Rugged Display Devices With Panel Size Less Than 10 Inches Expected to Dominate the Market During the Forecast Period
Figure 9 Android OS-Based Rugged Devices Expected to Witness the Highest CAGR During the Forecast Period
Figure 10 Smartphones & Handheld Computers to Hold A Larger Share of the Market During the Forecast Period
Figure 11 Government, Defense, and Aerospace Vertical to Dominate the Market During the Forecast Period
Figure 12 Market, By Region, 2016
Figure 13 Market Expected to Grow at A Significant Rate During the Forecast Period
Figure 14 Smartphone and Handheld Computers to Dominate the Market During the Forecast Period
Figure 15 Less Than 10 Inches Segment Held the Larger Market Size of Rugged Displays in 2016
Figure 16 Fully Rugged Display Devices Expected to Hold the Largest Market Share By 2023
Figure 17 Android OS-Based Market to Grow at the Highest CAGR During the Forecast Period
Figure 18 Rugged Displays in Automotive and Transportation Vertical Expected to Witness the Highest CAGR During the Forecast Period
Figure 19 North America Expected to Dominate the Market During the Forecast Period
Figure 20 Market Dynamics: Overview
Figure 21 Ruggedized Mobile Display Device: Total Cost of Ownership (TCO) (Five Years)
Figure 22 Human–Machine Interface (HMI) Market, 2014–2022 (USD Billion)
Figure 23 Rugged Display System Market: Value Chain Analysis
Figure 24 Market, By Product
Figure 25 Rugged Smartphones & Handheld Computers to Dominate the Market During the Forecast Period
Figure 26 Market, By Level of Ruggedness
Figure 27 Fully Rugged Displays Expected to Hold A Large Share of the Market Between 2017 and 2023
Figure 28 Market, By Display Size
Figure 29 Market, By Display Size, 2017 vs 2023 (USD Million)
Figure 30 Market, By Operating System
Figure 31 Rugged Display Devices Operating on Android OS to Grow at the Highest CAGR Between 2017 and 2023
Figure 32 Market, By Vertical
Figure 33 Government, Defense, & Aerospace Vertical Expected to Hold A Large Share of the Market Between 2017 and 2023
Figure 34 Market: By Region
Figure 35 APAC Expected to Be the Fastest-Growing Region in the Market (2017–2023)
Figure 36 Market Geographic Snapshot: Rapidly Growing Markets Emerging as New Hotspots
Figure 37 North America: Market Snapshot
Figure 38 Market for Rugged Vehicle-Mounted Computer to Grow at the Highest CAGR in North America (2017–2023)
Figure 39 Europe: Market Snapshot
Figure 40 Rugged Avionics Display Market in Europe to Grow at the Highest CAGR During the Forecast Period
Figure 41 Asia Pacific: Market Snapshot
Figure 42 Rugged Tablet PC Market in APAC to Grow at the Highest CAGR During the Forecast Period
Figure 43 Market for Rugged Tablet PC in RoW to Grow at the Highest CAGR During the Forecast Period
Figure 44 Companies Adopted Product Launch as the Key Growth Strategy Between 2015 and 2017
Figure 45 Market(Global): Competitive Leadership Mapping, 2017
Figure 46 Getac Technology Corp.: Company Snapshot
Figure 47 Zebra Technologies Corp. : Company Snapshot
Figure 48 Panasonic Corporation : Company Snapshot
Figure 49 Sparton Corp. : Company Snapshot
Figure 50 Xplore Technologies Corp.: Company Snapshot
Figure 51 Beijer Electronics AB: Company Snapshot
Figure 52 Kyocera Corp. : Company Snapshot
Figure 53 Esterline Technologies Corp. : Company Snapshot
Figure 54 L3 Technologies, Inc. : Company Snapshot
Figure 55 General Dynamics Corp.: Company Snapshot
Figure 56 Curtiss-Wright Corp. : Company Snapshot
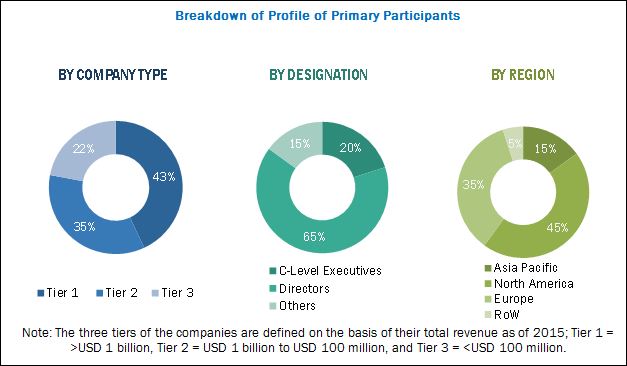
This research study incorporates the usage of secondary sources, directories, and databases such as Hoovers, Bloomberg BusinessWeek, Factiva, and OneSource to identify and collect information useful for the extensive technical, market-oriented, and commercial study of the digital signage rugged display market. Primary sources mainly comprise several experts from core and related industries, along with preferred suppliers, manufacturers, distributors, service providers, technology developers, alliances, standards, and certification organizations related to various parts of this industry’s value chain. In-depth interviews of various primary respondents, including key industry participants, subject matter experts (SMEs), C-level executives of key companies, and consultants, have been conducted to obtain and verify critical qualitative and quantitative information as well as assess future prospects. The breakdown of the profiles of primaries has been depicted in the figure below:
To know about the assumptions considered for the study, download the pdf brochure
This report provides valuable insights regarding the value chain of the market, such as research & development, display panel manufacturing, device assembly and testing, distribution, and marketing & post sales services, and end use industries. The key players of the rugged display market are Getac Technology Corp. (Taiwan), Sparton Corp. (US), Xplore Technologies Corp. (US), Panasonic Corp. (Japan), and Zebra Technologies Corp. (US)
Scope of the Report:
|
Report Metric |
Details |
|
Report Name |
Rugged Display Market |
|
Base year |
2016 |
|
Forecast period |
2017–2023 |
|
Forecast units |
Value in terms of USD million and billion |
|
Segments covered |
Product, System Type, Software & Services, Function, Industry, and Region |
|
Geographic regions covered |
North America, APAC, Europe, and RoW |
|
Companies covered |
Getac Technology Corp. (Taiwan), Sparton Corp. (US), Xplore Technologies Corp. (US), Panasonic Corp. (Japan), and Zebra Technologies Corp. (US) |
Target Audience
- Raw material providers
- Display panel manufacturers
- Display manufacturing equipment suppliers
- Brand customers/OEMs/ODMs
- Display-related service providers
- Display-related associations, organizations, forums, and alliances
- Government bodies such as regulating authorities and policy makers
- Venture capitalists and start-ups
- Semiconductor component suppliers
- Display panel and device distributors and sales firms
- Display device end users and industries
- Research institutes, organizations, and consulting companies
RESEARCH SCOPE
The market covered in this report has been segmented as follows:
Rugged Display Market, by Product:
- Smartphone & Handheld Computer
- Tablet PC
- Panel PC & Mission-Critical Display
- Laptop & Notebook
- Avionics Display
- Vehicle-Mounted Computer
Rugged Display Market, by Display Size:
- Less than 10 Inches
- 10 to 15 Inches
- More than 15 Inches
Rugged Display Market, by Level of Ruggedness:
- Ultra-Rugged
- Fully Rugged
- Semi-Rugged
Rugged Display Market, by Operating System:
- Android
- Windows
- Others
Rugged Display Market, by Vertical:
- Automotive & Transportation
- Government, Defense, & Aerospace
- Healthcare
- Industrial
- Others
Rugged Display Market, by Region:
- North America
- Europe
- Asia Pacific
- Rest of the World (RoW)
KEY QUESTIONS
- Which are the top use cases/applications/verticals of rugged display market to invest in and what are the untapped opportunities in retail, agriculture, construction, waste management, telecommunication, and food & beverages?
- How much growth is expected in rugged display market from automotive & transportation; government, defense, and aerospace; healthcare; and industrial applications?
- How the demand for rugged display products will shape in the next 5 years for newer and emerging applications?
- What are the trends and penetration rate of different operating systems (OS) and products into various applications or industries?
- Who are the major current and potential competitors in the market and what are their top priorities, strategies, and developments?
AVAILABLE CUSTOMIZATIONS
With the given market data, MarketsandMarkets offers the following customization options available for the report
Competitive Landscape
- Detailed analysis and profiling of additional market players
- Detailed analysis and profiling of key input suppliers (component suppliers, display panel suppliers, rugged solution suppliers) in rugged display supply chain
- Product-display size-OS-industry mapping of specific players in the market
Industry-Specific Data
- Detailed analysis of specific industries and respective use cases or applications in rugged display market
- Opportunities for payers in market w.r.t. growing trends of IoT, HMI, and digitization in manufacturing environment in different countries


Growth opportunities and latent adjacency in Rugged Display Market