The study involves four major activities that estimate the size of the HMI market. Exhaustive secondary research was conducted to collect information related to the market. Following this was validating these findings, assumptions, and sizing with the industry experts across the value chain through primary research. Both top-down and bottom-up approaches were employed to estimate the overall size of the HMI market. Subsequently, market breakdown and data triangulation procedures were used to determine the extent of different segments and subsegments of the market.
Secondary Research
Secondary sources in this research study include corporate filings (such as annual reports, investor presentations, and financial statements); trade, business, and professional associations; white papers, certified publications, articles from recognized authors; directories; and databases. The secondary data were collected and analyzed to estimate the overall market size, further validated by primary research.
Primary Research
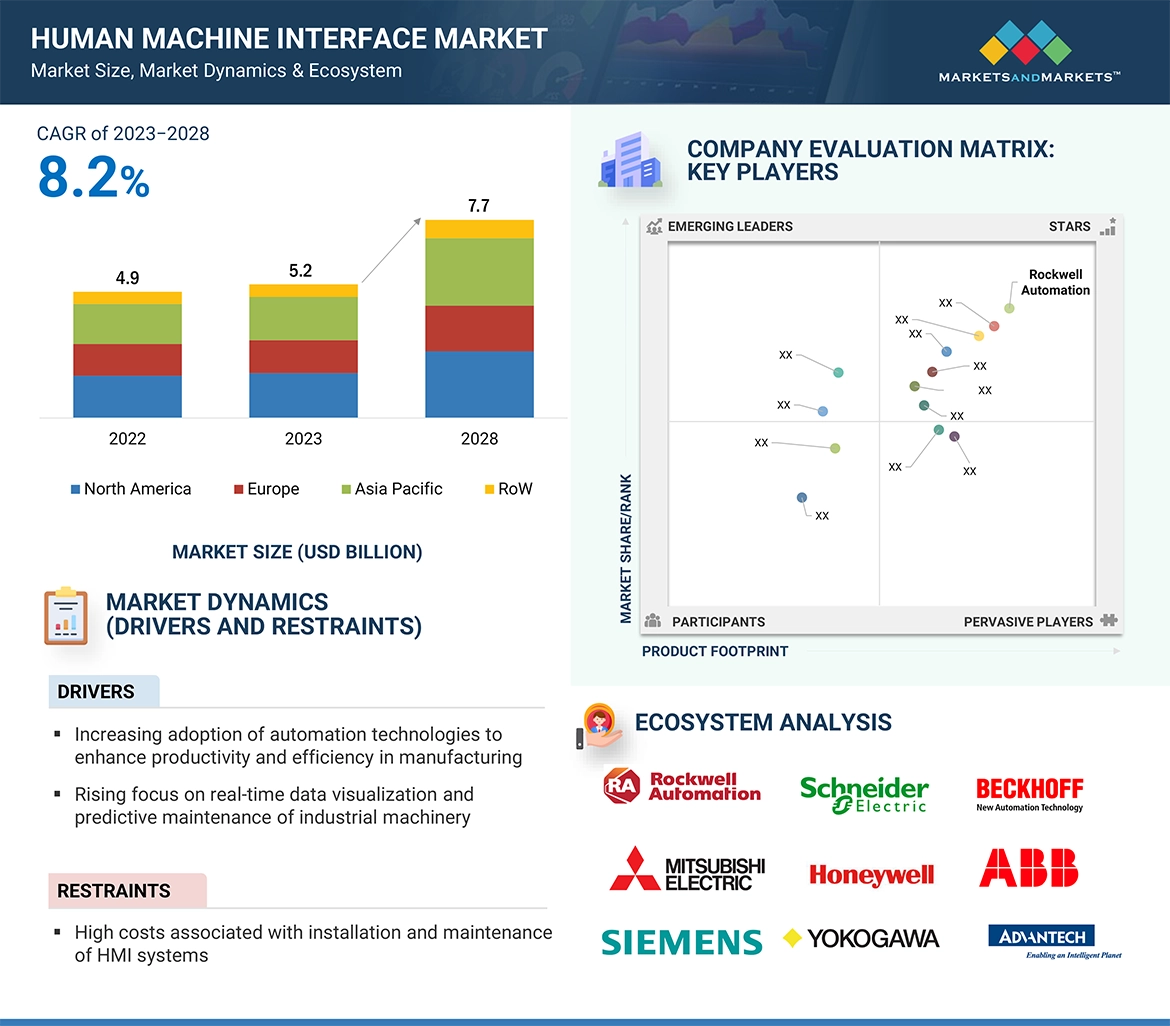
In the primary research process, numerous sources from both the supply and demand sides were interviewed to obtain qualitative and quantitative information about this report. The primary sources from the supply side included various industry experts such as Chief X Officers (CXOs), Vice Presidents (VPs), and Directors from business development, marketing, product development/innovation teams, and related key executives from HMI providers, such as Rockwell Automation (US), Siemens (Germany), Schneider Electric (France), ABB (Switzerland), and Honeywell International Inc. (US); research organizations, distributors, professional and managed service providers, industry associations, and key opinion leaders. Approximately 25% of the primary interviews were conducted with the demand side and 75% with the supply side. These data were collected mainly through questionnaires, emails, and telephonic interviews, accounting for 80% of the primary interviews.

To know about the assumptions considered for the study, download the pdf brochure
Market Size Estimation
In the market engineering process, both top-down and bottom-up approaches were implemented, along with several data triangulation methods, to estimate and validate the size of the market and other dependent submarkets listed in this report.
-
The key players in the industry and markets were identified through extensive secondary research.
-
Both the supply chain of the industry and the market size, in terms of value, were determined through primary and secondary research.
-
All percentage shares, splits, and breakdowns were determined using secondary sources and verified through primary sources.
-
Market Size Estimation Methodology-Bottom-up approach and Top-down Approach


Data Triangulation
After estimating the overall market size, the total market was split into several segments. The market breakdown and data triangulation procedures were employed wherever applicable to complete the overall market engineering process and gauge exact statistics for all segments. The data were triangulated by studying various factors and trends from both the demand and supply sides. The market was also validated using both top-down and bottom-up approaches.
Market Definition
HMI, commonly known as the man-machine interface (MMI), is a technology that serves as the point of interaction between humans and machines or systems. It encompasses both the hardware and software components that enable users to monitor, control, and interact with devices, equipment, or industrial processes. It reduces human involvement in the manufacturing process, thereby increasing the productivity and safety of operators. HMIs provide a visual and often tactile interface, such as touchscreens, keypads, or other input methods, to facilitate the exchange of information and commands, offering users a user-friendly and intuitive means to access and manage complex machinery, automation systems, or digital devices across various industries, including manufacturing, automotive, healthcare, and more.
Stakeholders
-
Associations and industrial bodies
-
Component suppliers and distributors
-
End users of HMI systems across various industries
-
Government bodies such as regulatory authorities and policymakers
-
HMI hardware manufacturers
-
HMI software and services providers
-
Industrial automation equipment providers
-
Market research and consulting firms
-
Original equipment manufacturers (OEMs)
-
Research institutes and organizations
The main objectives of this study are as follows:
-
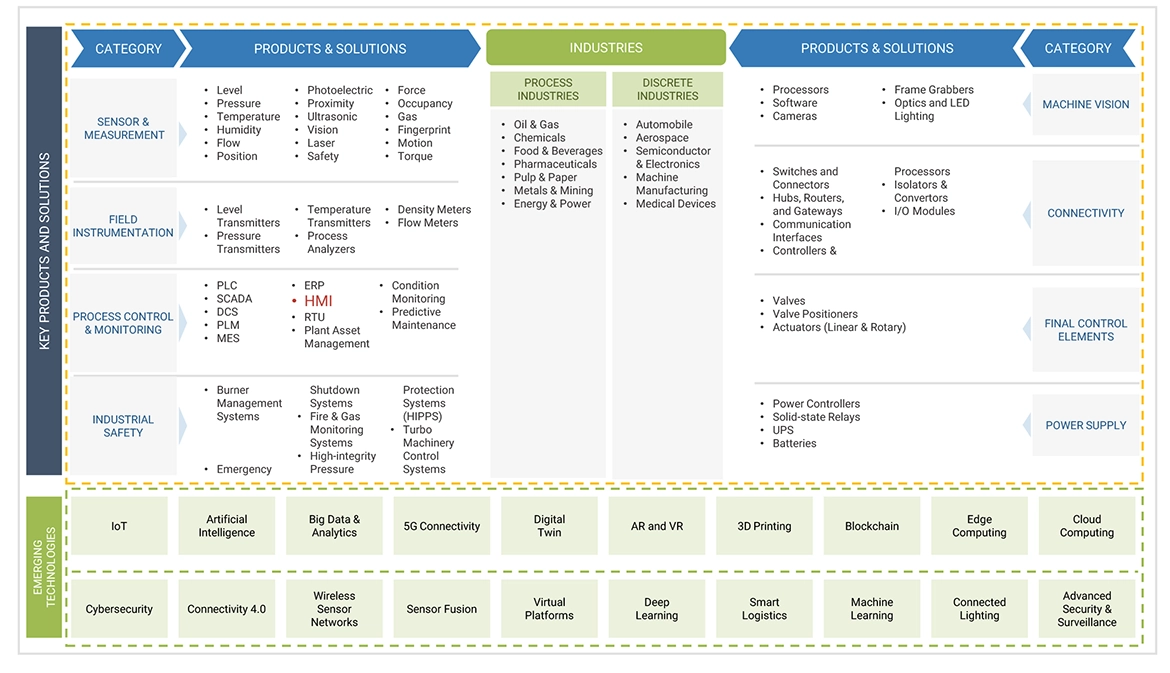
To define, describe, and forecast the human machine interface (HMI) market based on offering, end-user industry, configuration, and region
-
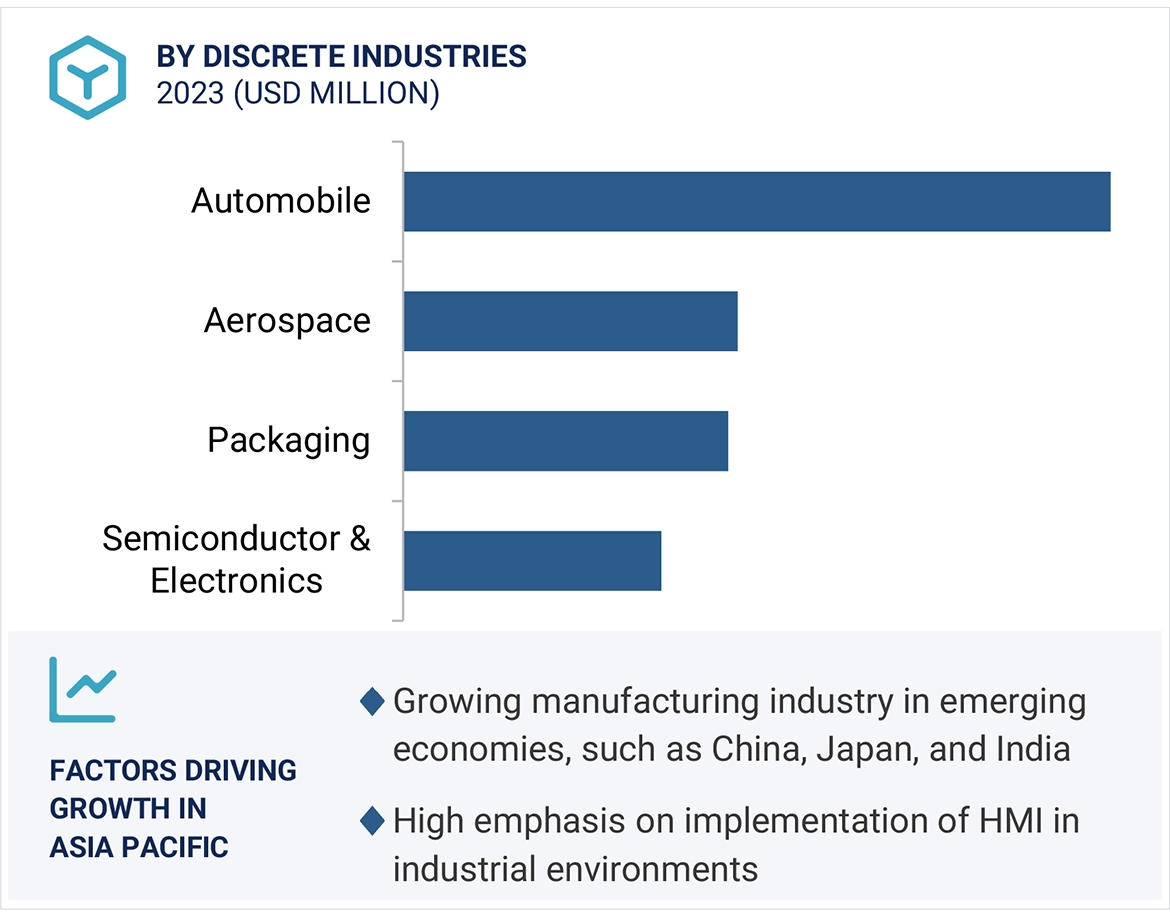
To estimate and forecast the market size, in terms of value, of various segments with regard to four main regions—North America, Europe, Asia Pacific, and the Rest of the World (RoW)
-
To forecast the market size, in terms of volume, for the hardware offering
-
To describe various sales channels through which the sales operations of HMI solutions are conducted
-
To provide detailed information regarding the major factors influencing the growth of the HMI market (drivers, restraints, opportunities, industry-specific challenges)
-
To study and analyze technologies used in HMI devices, trends and emerging applications of HMI technology, components used in HMI systems, and screen size based classification of HMI systems
-
To strategically analyze the micromarkets1 with respect to individual growth trends, future prospects, and contribution to the total market
-
To analyze the opportunities in the market for various stakeholders by identifying the high-growth segments of the HMI market
-
To strategically profile the key players and comprehensively analyze their market shares and core competencies2 and provide a detailed competitive landscape for the market leaders
-
To analyze various development strategies such as mergers and acquisitions, new product launches and developments, and research and development implemented by the key market players in the HMI markets
Available Customizations:
With the given market data, MarketsandMarkets offers customizations according to the specific requirements of companies. The following customization options are available for the report:
Country-wise Information:
-
Analysis for additional countries (up to five)
Company Information:
-
Detailed analysis and profiling of different market players (up to five)


marcyliuse
Jul, 2021
In addition to the above mentioned brands, I think some other HMI products are also good, such as Proface and Hitech. Although the market share is not as good as Schneider, but in fact the product is quite good..