Sensor Bearing Market by Functionality (Speed, Temperature, Vibration, Displacement), Application (ABS, Material Handling Equipment, Electric Motors), End-use Industry (Automotive, Transportation, Metal & Mining), and Region - Global Forecast to 2023


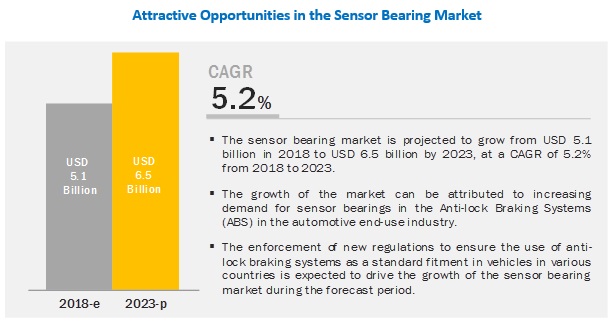
The sensor bearing market is estimated to grow USD 6.5 billion by 2023, at a CAGR of 5.2%. The major factors driving the sensor bearing market are increasing demand for sensor bearings from end-use industries, such as automotive and transportation, and the enforcement of stringent regulations related to the mandatory installation of ABS systems in cars in various Asia Pacific and European countries.
The speed functionality segment is expected to grow at the highest CAGR due to the increasing demand from the automotive industry
The demand for sensor bearings used to measure the speed of rotating shafts and wheels is increasing in the automotive industry. Presently, over 90% vehicles that ply on roads are equipped with wheel speed sensors. Additionally, the US and some member countries of the European Union have made the use of ABS and ESC systems mandatory in passenger cars since 2011 and 2014, respectively, thereby leading to the increasing demand for sensor bearings.
ABS application segment is projected to be the leading segment
ABS control systems determine the requirement of using anti-lock braking. High demand for vehicles with ABS in developed countries is leading to the growth of the ABS segment of the sensor bearing market. Moreover, the US and some member countries of the European Union have also made the use of ABS and ESC systems mandatory in vehicles since 2011 and 2014, respectively. This is also leading to the growth of the ABS segment.
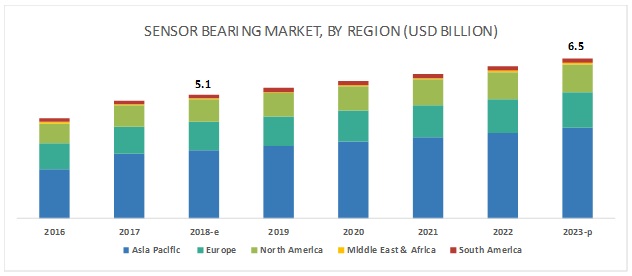
Asia Pacific is expected to lead the market during the forecast period
The sensor bearing market in the Asia Pacific is expected to witness significant growth on account of the high demand for the sensor bearings from the growing automotive industry. The Asia Pacific region has emerged as a hub for automotive production, with OEMs and suppliers setting up production facilities to cater to the growing demand for automotive vehicles. The Asia Pacific region has also witnessed an increase in population and income levels, which has subsequently raised the demand for automobiles. Thus, leading to the increasing demand for sensor bearings.
Key Sensor Bearing Market Players
Key players in the market include SKF (Sweden), Schaeffler Technologies AG & Co. KG (Germany), NTN Corporation (Japan), Timken (US), NSK Corporation (Japan), JTEKT Corporation (Japan), ABB Group (Switzerland), Mageba SA (Switzerland), BRTEC (China), ABB Group (Switzerland), Fersa Bearing SA (Spain), and Nachi Europe GmbH (Germany). These players have expanded their geographical presence through new product launches, acquisitions, and expansions.
Scope of Sensor Bearing Market report:
|
Report Metric |
Details |
|
Market size available for years |
2016-2023 |
|
Base year considered |
2017 |
|
Forecast period |
2018-2023 |
|
Forecast units |
Value (USD) |
|
Segments covered |
Functionality, Application, End-use Industry, and Region |
|
Geographies covered |
North America, APAC, Europe, Middle East & Africa, and South America |
|
Companies covered |
SKF (Sweden), Schaeffler Technologies AG & Co. KG (Germany), NTN Corporation (Japan), Timken (US), NSK Corporation (Japan), JTEKT Corporation (Japan), ABB Group (Switzerland), Mageba SA (Switzerland), BRTEC (China), ABB Group (Switzerland), Fersa Bearing SA (Spain), and Nachi Europe GmbH (Germany). |
This research report categorizes the sensor bearing market, based on functionality, application, end-use industry, and region, forecasting revenues as well as analyzing trends in each of these submarkets.
Based on Functionality, the sensor bearing market is segmented into:
- Speed
- Temperature
- Vibration
- Displacement
- Other (Acceleration, Sound, Power/ Power shift, Load, Angle of rotation)
Based on Application, the sensor bearing market is segmented into:
- ABS (Anti-lock Braking System)
- Material Handling Equipment
- Electric Motors
- Others (blowers, wind turbines, pumps, and compressors)
Based on End-use industry, the sensor bearing market is segmented into:
- Automotive
- Transportation
- Metal & Mining
- Aerospace & Defense
- Oil & Gas
- Others (Agriculture and Construction)
Based on Region, the sensor bearing market is segmented into:
- Asia Pacific
- North America
- Europe
- Middle East & Africa
- South America
Recent Developments
- In June 2018, SKF and National Renewable Energy Laboratory (NREL) entered into a three-year collaboration to study wind turbine drivetrains. Sensors installed in the bearing will be installed to measure gearbox condition and shaft bearing. The project will be an ideal opportunity for SKF to showcase its expertise in the wind energy industry.
- In January 2018, SKF and Koncar KEV signed an agreement for the supply of bearings, axle boxes, and associated equipment for its latest low-floor electric and diesel-electric multiple unit trains.
Key Questions Addressed by the Report:
- How will these developments affect the industry in the mid to long term?
- What are the upcoming industry applications for sensor bearings?
- What is the impact of changes in government policies on the sensor bearing market?
- What is the total size of the sensor bearing market?
- What are the different applications of sensor bearings?
Frequently Asked Questions (FAQ):
What are sensor bearing?
Sensor bearings are mechatronic machine components that feature a bearing and a sensor packaged together. The result is a compact solution that reduces weight, takes up less space, and cuts purchasing, manufacturing and assembly costs.
What are the different applications of sensor bearings?
Senor bearings are used in different applications such as ABS, Material Handling Equipment, Electric Motor, and others.
What are the different functionalities of a sensor bearing?
A typical sensor bearing is used for measuring different parameters such as speed, temperature, vibration, displacement, among others.
What is the biggest challenge for the growth of sensor bearing market?
Lack of awareness about the advantages of the senor bearings, reluctant to utilize the product, and growing number of counterfeit products are some of the major challenges faced by the senor bearing market.
To speak to our analyst for a discussion on the above findings, click Speak to Analyst
 Exclusive indicates content/data unique to MarketsandMarkets and not available with any competitors.
Table of Contents
1 Introduction (Page No. - 19)
1.1 Objectives of the Study
1.2 Market Definition
1.3 Scope of the Study
1.3.1 Markets Covered
1.3.2 Years Considered for the Study
1.4 Currency
1.5 Limitations
1.6 Stakeholders
2 Research Methodology (Page No. - 23)
2.1 Research Data
2.1.1 Secondary Data
2.1.1.1 Key Data From Secondary Sources
2.1.2 Primary Data
2.1.2.1 Key Data From Primary Sources
2.1.2.2 Key Industry Insights
2.1.2.3 Breakdown of Primary Interviews
2.2 Market Size Estimation
2.2.1 Bottom-Up Approach
2.2.2 Top-Down Approach
2.3 Data Triangulation
2.4 Research Assumptions
3 Executive Summary (Page No. - 31)
4 Premium Insights (Page No. - 35)
4.1 Attractive Opportunities in the Sensor Bearing Market
4.2 Sensor Bearing Market, By Region
4.3 Asia Pacific Sensor Bearing Market, By Functionality and Country
4.4 Sensor Bearing Market: Major Countries
4.5 Sensor Bearing Market, By Application
5 Market Overview (Page No. - 38)
5.1 Introduction
5.2 Market Dynamics
5.2.1 Drivers
5.2.1.1 Increasing Demand for Bearings With Longer Service Life, Higher Efficiency, and Lower Maintenance Requirements
5.2.1.2 Increasing Demand for Sensor Bearings From End-Use Industries
5.2.1.3 Growing Demand for Off-Highway and Material Handling Equipment
5.2.2 Restraints
5.2.2.1 Volatility of Raw Material Prices
5.2.2.2 Easy Access to Low-Quality Products
5.2.2.3 Falling After Sales Market
5.2.3 Opportunities
5.2.3.1 Growth Prospects in Emerging Economies
5.2.3.2 Adoption of Industrial Internet of Things (IIoT) in the Bearing Technology
5.2.4 Challenges
5.2.4.1 Lack of Awareness About the Advantages of the Sensor Bearings and Reluctant to Utilize the Product
5.2.4.2 Growing Number of Counterfeit Products
5.3 Macroeconomic Indicators
5.3.1 Annual GDP Growth of Major Economies
5.3.1.1 Construction
5.3.1.2 Manufacturing
5.3.1.3 Automotive
5.4 Porter’s Five Forces Analysis
5.4.1 Threat of Substitutes
5.4.2 Bargaining Power of Suppliers
5.4.3 Bargaining Power of Buyers
5.4.4 Threat of New Entrants
5.4.5 Intensity of Competitive Rivalry
6 Sensor Bearing Market, By Functionality (Page No. - 51)
6.1 Introduction
6.2 Speed
6.3 Temperature
6.4 Vibration
6.5 Displacement
6.6 Others
7 Sensor Bearing Market, By Application (Page No. - 57)
7.1 Introduction
7.2 ABS
7.3 Material Handling Equipment
7.4 Electric Motors
7.5 Others
8 Sensor Bearing Market, By End-Use Industry (Page No. - 63)
8.1 Introduction
8.2 Automotive
8.2.1 Automotive End-Use Industry Segment to Hold the Largest Market Share Through 2023
8.3 Transportation
8.3.1 Growing Demand for Sensor Bearings From Railway Manufacturers is Expected to Drive Sensor Bearing Market in Transportation End-Use Industry
8.4 Metal & Mining
8.4.1 Metal & Mining End-Use Industry to Grow Due to Rising Metal Processing and Mining Activities Globally
8.5 Aerospace & Defense
8.5.1 Growing Awareness About Passenger Safety is Expected to Drive the Aerospace & Defense End-Use Industry
8.6 Oil & Gas
8.6.1 Reduction in Downtime is Expected to Drive the Sensor Bearing Market in Oil & Gas End-Use Industry
8.7 Others
9 Sensor Bearing Market, By Region (Page No. - 71)
9.1 Introduction
9.2 Asia Pacific
9.2.1 China
9.2.1.1 High Demand for Automotive Vehicles is Expected to Drive the Sensor Bearing Market
9.2.2 Japan
9.2.2.1 Japan to Have the Second Largest Share in the Asia Pacific Sensor Bearing Market
9.2.3 India
9.2.3.1 High Demand From Automotive End-Use Industry is Expected to Drive the Sensor Bearing Market in India
9.2.4 South Korea
9.2.4.1 South Korea Accounted for Fourth Largest Share in Asia Pacific Sensor Bearing Market
9.2.5 Thailand
9.2.5.1 High Demand for Automotive Vehicles is Expected to Drive Sensor Bearing Market in Thailand
9.2.6 Malaysia
9.2.6.1 The Growing Urban Population of Malaysia and Rising Disposable Income of Its Middle-Class Population are Fueling the Growth of the Automotive Sector in the Country
9.2.7 Rest of APAC
9.3 Europe
9.3.1 Germany
9.3.1.1 High Demand From the Automotive Oem Manufacturers is Expected to Drive Sensor Bearing Market in Germany
9.3.2 France
9.3.2.1 High Demand for Sensor Bearings From End-Use Industries Such as Automotive and Transportation is Expected to Drive the France Sensor Bearing Market
9.3.3 UK
9.3.3.1 Growth in the Automotive and Transportation Sector has Driven the Sensor Bearing Market in the UK
9.3.4 Spain
9.3.4.1 Growth in the Automotive Sector has Led to Growth in the Spain Sensor Bearing Market
9.3.5 Russia
9.3.5.1 Increased Demand for Sensor Bearings From Various End-Use Industries, Such as Automotive, Transportation, and Aerospace & Defense is Driving the Market for Sensor Bearing in Russia
9.3.6 Rest of Europe
9.4 North America
9.4.1 US
9.4.1.1 High Demand for Sensor Bearing From the Automotive Oem Manufacturers is Expected to Drive the US Sensor Bearing Market
9.4.2 Canada
9.4.2.1 High Demand From the End-Use Industries Such as Automotive and Aerospace & Defense is Expected to Drive the Sensor Bearing Market in Canada
9.4.3 Mexico
9.4.3.1 Increasing Middle-Class Population and Growing Manufacturing Industry is Expected to Drive Sensor Bearing Market in Mexico
9.5 Middle East & Africa
9.5.1 Saudi Arabia
9.5.1.1 Saudi Arabia to Have the Largest Share in Middle East & Africa Sensor Bearing Market
9.5.2 UAE
9.5.2.1 UAE Accounted for Second Largest Share in the Middle East & Africa Sensor Bearing Market
9.5.3 Qatar
9.5.3.1 Presence of Less Number of Automotive Oems in the Country has Led to Slow Growth of Sensor Bearing Market in Qatar
9.5.4 Rest of Middle East & Africa
9.6 South America
9.6.1 Brazil
9.6.1.1 High Demand From the Automotive & Transportation End-Use Industry is Expected to Drive Brazil Sensor Bearing Market
9.6.2 Argentina
9.6.2.1 Argentina Accounted for the Second Largest Share in the South American Sensor Bearing Market
9.6.3 Chile
9.6.3.1 Presence of Less Number of Automotive Oems in Chile has Accounted for Slow Growth of Sensor Bearing Market
9.6.4 Rest of South America
10 Competitive Landscape (Page No. - 122)
10.1 Introduction
10.2 Competitive Landscape Mapping
10.2.1 Visionary Leaders
10.2.2 Innovators
10.2.3 Dynamic Differentiators
10.2.4 Emerging Companies
10.3 Competitive Benchmarking
10.3.1 Strength of Product Portfolio
10.3.2 Business Strategy Excellence
10.4 Business Overview
10.5 Competitive Situation & Trends
10.5.1 New Product Launches/Developments
10.5.2 Partnerships, Collaborations & Joint Ventures
10.5.3 Contracts & Agreements
10.5.4 Mergers & Acquisitions
10.5.5 Expansions
10.6 Market Share Analysis
11 Company Profiles (Page No. - 133)
(Business Overview, Strength of Product Portfolio, Products Offered, Business Strategy Excellence, Recent Developments, SWOT Analysis, MnM View)*
11.1 SKF
11.2 NTN Corporation
11.3 The Timken Company
11.4 Schaeffler Technologies AG & Co. Kg
11.5 NSK Corporation
11.6 Jtekt Corporation
11.7 ABB Group
11.8 Thomson Industries Inc.
11.9 Mageba SA
11.10 BRTEC
11.11 Fersa Bearings
11.12 Nachi Europe
11.13 Wafangdian Bearing Co. Ltd.
11.14 Harbin Bearing Manufacturing Co., Ltd.
*Details on Business Overview, Strength of Product Portfolio, Products Offered, Business Strategy Excellence, Recent Developments, SWOT Analysis, MnM View Might Not Be Captured in Case of Unlisted Companies.
12 Appendix (Page No. - 173)
12.1 Discussion Guide
12.2 Knowledge Store: Marketsandmarkets’ Subscription Portal
12.3 Available Customizations
12.4 Related Reports
12.5 Author Details
List of Tables (119 Tables)
Table 1 Sensor Bearing Market Snapshot
Table 2 Annual GDP Growth of Major Economies, 2013 to 2017
Table 3 International Car Sales
Table 4 Sensor Bearing Market, By Functionality, 2016–2023 (USD Million)
Table 5 Speed Functionality in Sensor Bearing Market, By Region, 2016–2023 (USD Million)
Table 6 Temperature Functionality in Sensor Bearing Market, By Region, 2016–2023 (USD Million)
Table 7 Vibration Functionality in Sensor Bearing Market, By Region, 2016–2023 (USD Million)
Table 8 Displacement Functionality in Sensor Bearing Market, By Region, 2016–2023 (USD Million)
Table 9 Other Functionalities in Sensor Bearing Market, By Region, 2016–2023 (USD Million)
Table 10 Sensor Bearing Market, By Application, 2016–2023 (USD Million)
Table 11 Sensor Bearing Market in ABS, By Region, 2016–2023 (USD Million)
Table 12 Sensor Bearing Market in Material Handling Equipment, By Region, 2016–2023 (USD Million)
Table 13 Sensor Bearing Market in Electric Motors, By Region, 2016–2023 (USD Million)
Table 14 Sensor Bearing Market in Other Applications, By Region, 2016–2023 (USD Million)
Table 15 Sensor Bearing Market, By End-Use Industry, 2016–2023 (USD Million)
Table 16 Sensor Bearing Market for Automotive, By Region, 2016–2023 (USD Million)
Table 17 Sensor Bearing Market for Transportation, By Region, 2016–2023 (USD Million)
Table 18 Sensor Bearing Market for Metal & Mining, By Region, 2016–2023 (USD Million)
Table 19 Sensor Bearing Market for Aerospace & Defense, By Region, 2016–2023 (USD Million)
Table 20 Sensor Bearing Market for Oil & Gas, By Region, 2016–2023 (USD Million)
Table 21 Sensor Bearing Market for Other End-Use Industries, By Region, 2016–2023 (USD Million)
Table 22 Sensor Bearing Market, By Region, 2016–2023 (USD Million)
Table 23 Asia Pacific By Market, By End-Use Industry, 2016–2023 (USD Million)
Table 24 Asia Pacific By Market, By Country, 2016–2023 (USD Million)
Table 25 Asia Pacific By Market, By Functionality, 2016–2023 (USD Million)
Table 26 Asia Pacific By Market, By Application, 2016–2023 (USD Million)
Table 27 China By Market, By End-Use Industry, 2016–2023 (USD Million)
Table 28 China By Market, By Functionality, 2016–2023 (USD Million)
Table 29 China By Market, By Application, 2016–2023 (USD Million)
Table 30 Japan By Market, By End-Use Industry, 2016–2023 (USD Million)
Table 31 Japan By Market, By Functionality, 2016–2023 (USD Million)
Table 32 Japan By Market, By Application, 2016–2023 (USD Million)
Table 33 India By Market, By End-Use Industry, 2016–2023 (USD Million)
Table 34 India By Market, By Functionality, 2016–2023 (USD Million)
Table 35 India By Market, By Application, 2016–2023 (USD Million)
Table 36 South Korea By Market, By End-Use Industry, 2016–2023 (USD Million)
Table 37 South Korea By Market, By Functionality, 2016–2023 (USD Million)
Table 38 South Korea By Market, By Application, 2016–2023 (USD Million)
Table 39 Thailand By Market, By End-Use Industry, 2016–2023 (USD Million)
Table 40 Thailand By Market, By Functionality, 2016–2023 (USD Million)
Table 41 Thailand By Market, By Application, 2016–2023 (USD Million)
Table 42 Malaysia By Market, By End-Use Industry, 2016–2023 (USD Million)
Table 43 Malaysia By Market, By Functionality, 2016–2023 (USD Million)
Table 44 Malaysia By Market, By Application, 2016–2023 (USD Million)
Table 45 Rest of APAC By Market, By End-Use Industry, 2016–2023 (USD Million)
Table 46 Rest of APAC By Market, By Functionality, 2016–2023 (USD Million)
Table 47 Rest of APAC By Market, By Application, 2016–2023 (USD Million)
Table 48 Europe By Market, By End-Use Industry, 2016–2023 (USD Million)
Table 49 Europe By Market, By Country, 2016–2023 (USD Million)
Table 50 Europe By Market, By Functionality, 2016–2023 (USD Million)
Table 51 Europe By Market, By Application, 2016–2023 (USD Million)
Table 52 Germany By Market, By End-Use Industry, 2016–2023 (USD Million)
Table 53 Germany By Market, By Functionality, 2016–2023 (USD Million)
Table 54 Germany By Market, By Application, 2016–2023 (USD Million)
Table 55 France By Market, By End-Use Industry, 2016–2023 (USD Million)
Table 56 France By Market, By Functionality, 2016–2023 (USD Million)
Table 57 France By Market, By Application, 2016–2023 (USD Million)
Table 58 UK By Market, By End-Use Industry, 2016–2023 (USD Million)
Table 59 UK By Market, By Functionality, 2016–2023 (USD Million)
Table 60 UK By Market, By Application, 2016–2023 (USD Million)
Table 61 Spain By Market, By End-Use Industry, 2016–2023 (USD Million)
Table 62 Spain By Market, By Functionality, 2016–2023 (USD Million)
Table 63 Spain By Market, By Application, 2016–2023 (USD Million)
Table 64 Russia By Market, By End-Use Industry, 2016–2023 (USD Million)
Table 65 Russia By Market, By Functionality, 2016–2023 (USD Million)
Table 66 Russia By Market, By Application, 2016–2023 (USD Million)
Table 67 Rest of Europe By Market, By End-Use Industry, 2016–2023 (USD Million)
Table 68 Rest of Europe By Market, By Functionality, 2016–2023 (USD Million)
Table 69 Rest of Europe By Market, By Application, 2016–2023 (USD Million)
Table 70 North America By Market, By End-Use Industry, 2016–2023 (USD Million)
Table 71 North America By Market, By Country, 2016–2023 (USD Million)
Table 72 North America By Market, By Functionality, 2016–2023 (USD Million)
Table 73 North America By Market, By Application, 2016–2023 (USD Million)
Table 74 US By Market, By End-Use Industry, 2016–2023 (USD Million)
Table 75 US By Market, By Functionality, 2016–2023 (USD Million)
Table 76 US By Market, By Application, 2016–2023 (USD Million)
Table 77 Canada By Market, By End-Use Industry, 2016–2023 (USD Million)
Table 78 Canada By Market, By Functionality, 2016–2023 (USD Million)
Table 79 Canada By Market, By Application, 2016–2023 (USD Million)
Table 80 Mexico By Market, By End-Use Industry, 2016–2023 (USD Million)
Table 81 Mexico By Market, By Functionality, 2016–2023 (USD Million)
Table 82 Mexico By Market, By Application, 2016–2023 (USD Million)
Table 83 Middle East & Africa By Market, By End-Use Industry, 2016–2023 (USD Million)
Table 84 Middle East & Africa By Market, By Country, 2016–2023 (USD Million)
Table 85 Middle East & Africa By Market, By Functionality, 2016–2023 (USD Million)
Table 86 Middle East & Africa By Market, By Application, 2016–2023 (USD Million)
Table 87 Saudi Arabia By Market, By End-Use Industry, 2016–2023 (USD Million)
Table 88 Saudi Arabia By Market, By Functionality, 2016–2023 (USD Million)
Table 89 Saudi Arabia By Market, By Application, 2016–2023 (USD Million)
Table 90 UAE By Market, By End-Use Industry, 2016–2023 (USD Million)
Table 91 UAE By Market, By Functionality, 2016–2023 (USD Million)
Table 92 UAE By Market, By Application, 2016–2023 (USD Million)
Table 93 Qatar By Market, By End-Use Industry, 2016–2023 (USD Million)
Table 94 Qatar By Market, By Functionality, 2016–2023 (USD Million)
Table 95 Qatar By Market, By Application, 2016–2023 (USD Million)
Table 96 Rest of Middle East & Africa By Market, By End-Use Industry, 2016–2023 (USD Million)
Table 97 Rest of Middle East & Africa By Market, By Functionality, 2016–2023 (USD Million)
Table 98 Rest of Middle East & Africa By Market, By Application, 2016–2023 (USD Million)
Table 99 South America Sensor Bearing Market, By End-Use Industry, 2016–2023 (USD Million)
Table 100 South America By Market, By Country, 2016–2023 (USD Million)
Table 101 South America By Market, By Functionality, 2016–2023 (USD Million)
Table 102 South America By Market, By Application, 2016–2023 (USD Million)
Table 103 Brazil By Market, By End-Use Industry, 2016–2023 (USD Million)
Table 104 Brazil By Market, By Functionality, 2016–2023 (USD Million)
Table 105 Brazil By Market, By Application, 2016–2023 (USD Million)
Table 106 Argentina By Market, By End-Use Industry, 2016–2023 (USD Million)
Table 107 Argentina By Market, By Functionality, 2016–2023 (USD Million)
Table 108 Argentina By Market, By Application, 2016–2023 (USD Million)
Table 109 Chile By Market, By End-Use Industry, 2016–2023 (USD Million)
Table 110 Chile By Market, By Functionality, 2016–2023 (USD Million)
Table 111 Chile By Market, By Application, 2016–2023 (USD Million)
Table 112 Rest of South America By Market, By End-Use Industry, 2016–2023 (USD Million)
Table 113 Rest of South America By Market, By Functionality, 2016–2023 (USD Million)
Table 114 Rest of South America By Market, By Application, 2016–2023 (USD Million)
Table 115 New Product Launches/Developments, 2013-2018
Table 116 Partnerships, Collaborations & Joint Ventures, 2013 - 2018
Table 117 Contracts & Agreements, 2013-2018
Table 118 Mergers & Acquisitions, 2013-2018
Table 119 Expansions, 2013-2018
List of Figures (39 Figures)
Figure 1 Sensor Bearing Market: Research Design
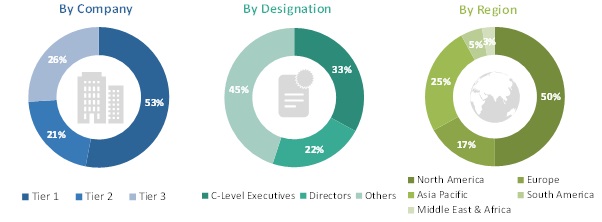
Figure 2 Breakdown of Primary Interviews, By Company, Designation, and Region
Figure 3 Market Size Estimation: Bottom-Up Approach
Figure 4 Market Size Estimation: Top-Down Approach
Figure 5 Based on End-Use Industry, the Automotive Segment is Estimated to Account for the Largest Share of the Sensor Bearing Market in 2018
Figure 6 Based on Functionality, the Speed Segment is Estimated to Account for the Largest Share of the Sensor Bearing Market in 2018
Figure 7 Sensor Bearing Market, By Region, 2017
Figure 8 The Asia Pacific Region is Estimated to Account for the Largest Share of the Sensor Bearing Market in 2018
Figure 9 Growing Demand for Sensor Bearings From the Automotive Industry is Expected to Drive Market Growth From 2018 to 2023
Figure 10 Asia Pacific Sensor Bearing Market is Projected to Grow at the Highest CAGR From 2018 to 2023
Figure 11 Speed Functionality Segment and China Estimated to Account for the Largest Share of the Asia Pacific Sensor Bearing Market in 2018
Figure 12 China Sensor Bearing Market is Projected to Grow at the Highest CAGR From 2018 to 2023
Figure 13 Anti-Lock Braking System Segment is Projected to Lead the Sensor Bearing Market From 2018 to 2023
Figure 14 Drivers, Restraints, Opportunities, and Challenges: Sensor Bearing Market
Figure 15 Global Automobile Production Data, 2011–2017
Figure 16 Average Crude Oil Prices in USD Per Barrel, 2011 - 2017
Figure 17 Average Steel Prices in USD Per Metric Ton, 2011–2018
Figure 18 Growth Rate of Construction Industry, 2015
Figure 19 Growth Rate of Manufacturing Industry, 2017
Figure 20 Porter’s Five Forces Analysis: Sensor Bearing Market
Figure 21 Sensor Bearing Market, By Functionality, 2018 & 2023 (USD Million)
Figure 22 Sensor Bearing Market, By Application, 2018 & 2023 (USD Million)
Figure 23 Sensor Bearing Market, By End-Use Industry, 2018 & 2023 (USD Million)
Figure 24 China to Grow at the Highest CAGR During the Forecast Period
Figure 25 Asia Pacific Sensor Bearing Market Snapshot
Figure 26 Europe Sensor Bearing Market Snapshot
Figure 27 North America Sensor Bearing Market Snapshot
Figure 28 Middle East & Africa Sensor Bearing Market Snapshot
Figure 29 South America Sensor Bearing Market Snapshot
Figure 30 Competitive Landscape Mapping
Figure 31 Companies in the Global Sensor Bearing Market Have Adopted Organic Growth Strategies Between 2013 and 2018
Figure 32 Sensor Bearing Market Ranking, By Company, 2018
Figure 33 SKF: Company Snapshot
Figure 34 NTN Corporation: Company Snapshot
Figure 35 The Timken Company: Company Snapshot
Figure 36 Schaeffler Technologies AG & Co. Kg: Company Snapshot
Figure 37 NSK Corporation: Company Snapshot
Figure 38 Jtekt Corporation: Company Snapshot
Figure 39 ABB Group: Company Snapshot
The study involved 4 major activities to estimate the current sensor bearing market size. Exhaustive secondary research was undertaken to collect information on the market, peer market, and parent market. The next step was to validate these findings, assumptions, and sizing with industry experts across the value chain through primary research. Both, top-down and bottom-up approaches were employed to estimate the complete market size. Thereafter, market breakdown and data triangulation procedures were used to estimate the market sizes of segments and subsegments.
Secondary Research
As a part of the secondary research process, various secondary sources, such as Hoovers, Bloomberg, BusinessWeek, and Dun & Bradstreet were referred to identify and collect information for this study. Secondary sources included annual reports, press releases & investor presentations of companies, white papers, certified publications, and articles from recognized authors, authenticated directories, and databases.
Secondary research was mainly conducted to obtain key information about the industry’s supply chain, market’s monetary chain, total pool of players, and market classification and segmentation according to industry trends to the bottom-most level, regional markets, and key developments from both, market- and technology-oriented perspectives.
Primary Research
As a part of the primary research process, various primary sources from both, supply and demand sides were interviewed to obtain qualitative and quantitative information for this report. Primary sources from the supply side included industry experts, such as CEOs, vice presidents, marketing directors, technology and innovation directors, and related key executives from various key companies and organizations operating in the sensor bearing market. Primary sources from the demand side included directors, marketing heads, and purchase managers from end-use industries. Following is the breakdown of primary respondents.
To know about the assumptions considered for the study, download the pdf brochure
Market Size Estimation
Both, top-down and bottom-up approaches were used to estimate and validate the total size of the sensor bearing market. These methods were also used extensively to estimate the size of various subsegments in the market. The research methodology used to estimate the market size includes the following:
- The key players in the industry and markets have been identified through extensive secondary research.
- The industry’s supply chain and market size, in terms of value, have been determined through the primary and secondary research processes.
- All percentage shares, splits, and breakdowns have been determined using secondary sources and verified through primary sources.
Data Triangulation
After arriving at the overall size from the market size estimation process explained above, the total market was split into several segments and subsegments. To complete the overall market engineering process, and arrive at the exact statistics for all segments and subsegments, data triangulation and market breakdown procedures were used, wherever applicable. The data were triangulated by studying various factors and trends from both, the demand and supply sides. In addition to this, the market was validated using both, top-down and bottom-up approaches.
Report Objectives
- To define, describe, and forecast the global sensor bearing market, based on functionality, application, end-use industry, and region
- To strategically analyze micromarkets with respect to individual growth trends, prospects, and contribution to the total market
- To analyze the opportunities in the market for stakeholders and draw a competitive landscape of the market
- To forecast the market size in terms of value with respect to main regions (along with countries), namely, Asia Pacific, North America, Europe, Middle East & Africa, and South America
- To strategically profile key players and comprehensively analyze their market share and core competencies
- To analyze competitive developments, such as joint ventures, mergers & acquisitions, new product developments, and Research & Development (R&D) activities in the global sensor bearing market
The following customization options are available for the report:
Further breakdown of the Asia Pacific & Europe sensor bearing markets
Company information
- Detailed analysis and profiles of additional market players (up to 3)


Growth opportunities and latent adjacency in Sensor Bearing Market
Interested in knowing, out of that advanced shifting market, how much of it is electric motors supplied for 1) Shift by wire in the transmission itself and 2) Shifting simulators at the human interface.