
Automotive Bearing Market Size, Share & Analysis

Automotive Bearing Market by Bearing Type (Ball Bearing, Roller Bearing, and Other Bearings), Application (Wheel Hub, Transmission, Drivetrain, Engine, and Interior & Exterior), Vehicle Type (Passenger Cars, LCVs, and HCVs), EV Type, Aftermarket (Wheel Hub, Transmission, Drivetrain, Engine, and Interior & Exterior) and Region - Global Forecast to 2032


OVERVIEW
Source: Secondary Research, Interviews with Experts, MarketsandMarkets Analysis
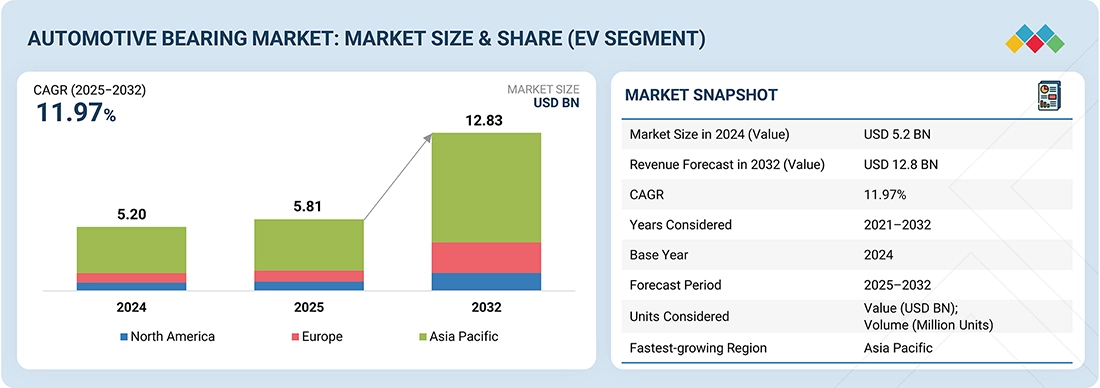
The global automotive bearing market for EVs is projected to grow from USD 5.81 billion in 2025 to reach USD 12.82 billion by 2032, at a CAGR of 11.97%, during the forecast period (2025–2032). The automotive bearing market for ICE vehicles is projected to reach USD 31.72 billion by 2032, growing at a CAGR of 0.32% from 2025. Electrification is reshaping usage with ceramic and deep-groove ball bearings for e-motors, cylindrical roller bearings for e-axles, and specialized bearings for dedicated transmissions. The rise of smart sensor-embedded bearings is enabling real-time monitoring and predictive maintenance, while the growing demand for luxury vehicle interior features is pushing manufacturers to deliver quieter, smoother, and more durable solutions.
Automotive Bearing Market Size and Forecast:
- Market Size Value in 2024: USD 5.20 Billion
- Market Size Value in 2025: USD 5.81 Billion
- Revenue Forecast in 2032: USD 12.82 Billion
- Growth Rate: CAGR of 11.97% from 2025 to 2032
- Data available from 2021 to 2032
- Base year: 2024
- Forecast period: 2025–2032
Key Market Trends and Insights
- Market Growth: Growth is driven by EV adoption, demand for high-performance bearings, and increasing use of smart sensor-enabled bearing technologies.
-
IoT Impact: IoT enables real-time bearing condition monitoring and predictive maintenance, improving vehicle reliability and performance.
- Growing Trends: The market is witnessing increased adoption of sensor-integrated, ceramic hybrid, and advanced bearing technologies for EVs and autonomous vehicles.
- Growth Opportunities: Opportunities are driven by the adoption of sensor-integrated bearings for predictive maintenance and real-time condition monitoring.
KEY TAKEAWAYS
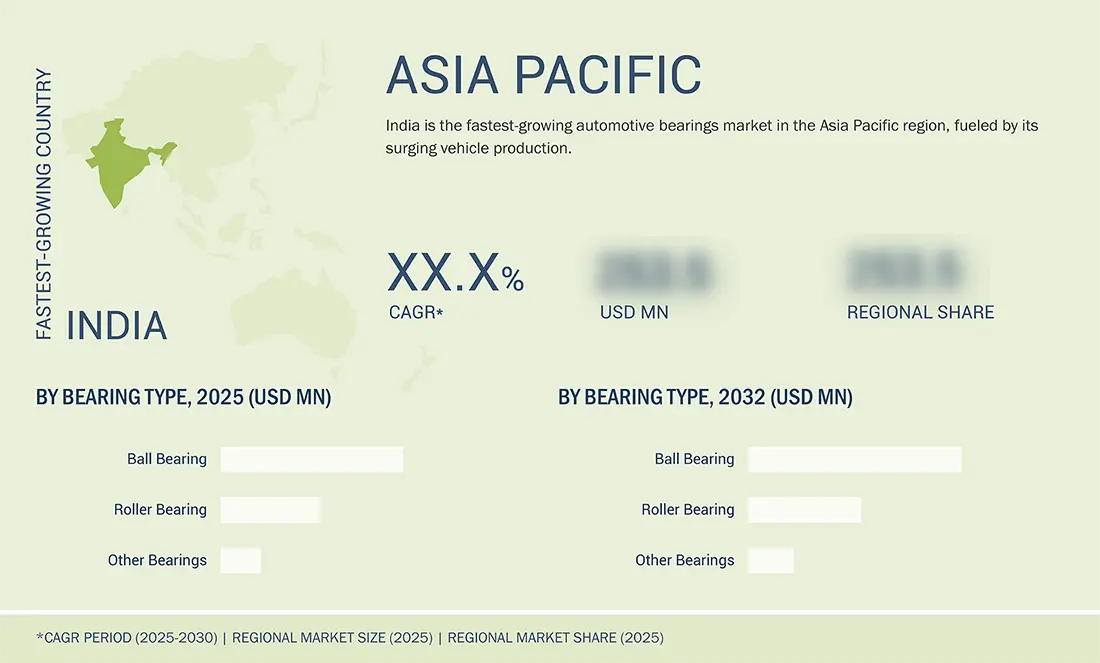
- The Asia Pacific accounted for a 53.8% share of the automotive bearing market in 2024.
- By vehicle type, the heavy commercial vehicles segment is expected to register the highest CAGR of 2.60%.
- By application, the drivetrain segment is projected to grow at the fastest rate from 2025 to 2032.
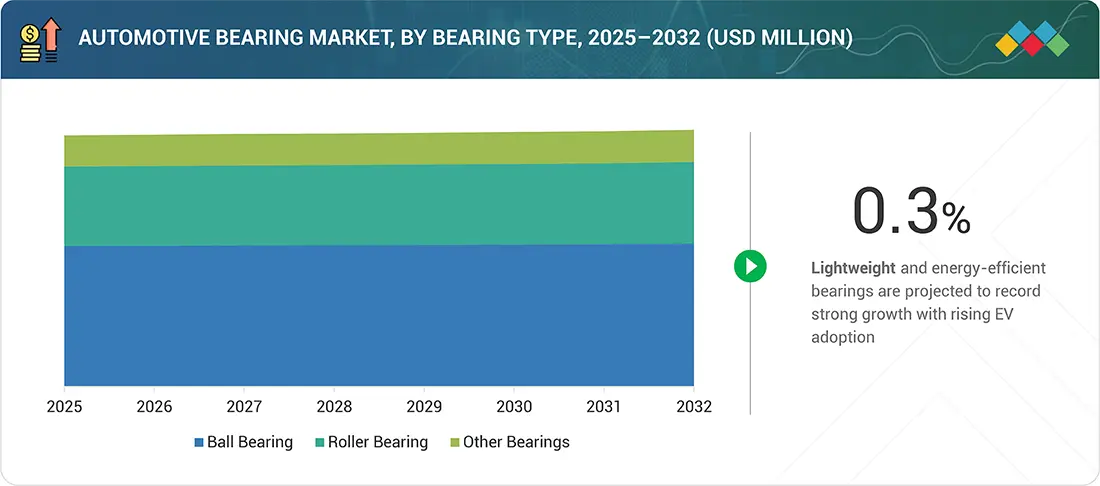
- By bearing type, the ball bearing segment is expected to dominate the market, growing at a CAGR of 0.24%.
- By EV type, the BEV segment is expected to account for the largest market share during the forecast period.
- By aftermarket application, the wheel hub segment will grow at the fastest rate during the forecast period.
- NSK Ltd., NTN Corporation, The Timken Company, JTEKT Corporation, and Nachi-Fujikoshi Corporation were identified as some of the star players in the automotive bearing market, given their strong market share and product footprint.
- Minebea Mitsumi Inc., ILJIN Bearing Co., Ltd., and NRB Industrial Bearing Limited, among others, have distinguished themselves among startups and SMEs by securing strong footholds in specialized niche areas, underscoring their potential as emerging market leaders.
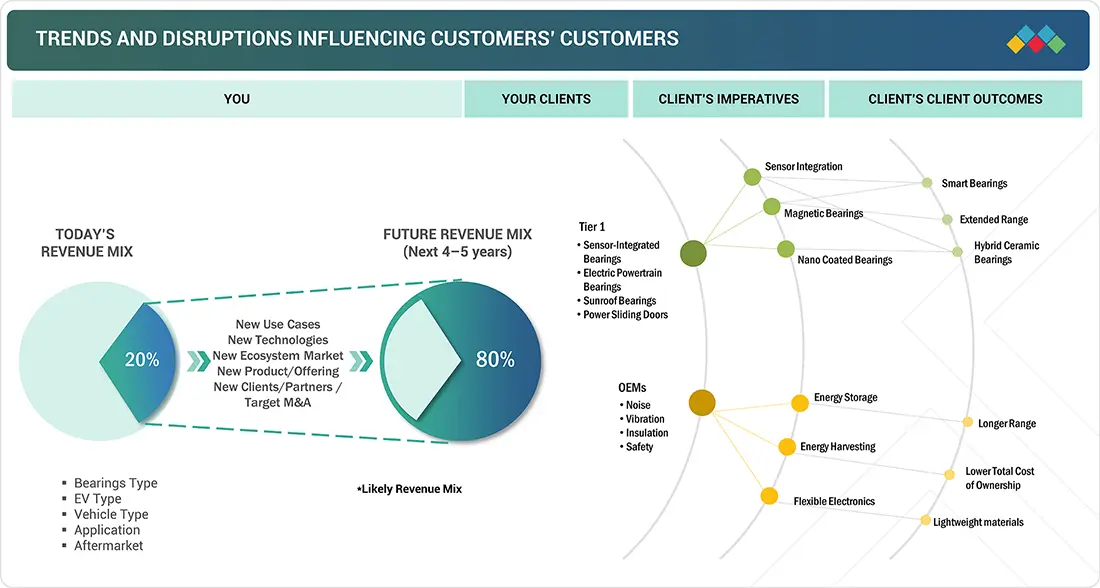
TRENDS & DISRUPTIONS IMPACTING CUSTOMERS' CUSTOMERS
The automotive bearings market is witnessing a transformation, driven by technological shifts and evolving client priorities across the mobility ecosystem. As electrification, autonomy, and advanced safety systems gain traction, traditional revenue sources like legacy steel bearings and conventional mechanical designs are beginning to plateau. In their place, next-generation solutions such as sensor-integrated bearings, magnetic systems, and ceramic hybrid bearings are emerging as the new growth engines.
Source: Secondary Research, Interviews with Experts, MarketsandMarkets Analysis
MARKET DYNAMICS
Level
-
High precision bearings for ADAS applications

-
Emergence of specialized bearing designs tailored for electric powertrains and high-speed e-motors

Level
-
Reduced bearing demand due to simplified EV powertrains

-
Raw material price volatility impacting costs and margins

Level
-
Adoption of sensor-integrated bearings for condition-based monitoring and predictive maintenance

-
Use of alternate materials like ceramics and polymers to boost efficiency and lifespan

Level
-
Persistent supply chain instability and extended lead times

-
Declining replacement cycles due to long-lasting, sealed bearing units

Source: Secondary Research, Interviews with Experts, MarketsandMarkets Analysis
Driver: High precision bearings for ADAS applications
Modern vehicles with advanced features like lane-keeping assist, automated emergency braking, adaptive cruise control, and hands-free steering rely on sensors and actuators that demand consistent, ultra-smooth mechanical motion. This shift has elevated the importance of high-precision, low-friction bearings that can operate with minimal noise, vibration, and harshness (NVH) while maintaining exacting dimensional tolerances over extended lifecycles.
Restraint: Reduced bearing demand due to simplified EV powertrains
The transition from internal combustion engine vehicles to electric powertrains has significantly altered the mechanical architecture of modern vehicles. Unlike ICE systems, which rely on complex multi-speed transmissions, crankshafts, camshafts, and auxiliary systems requiring multiple types of bearings, electric vehicles often utilize single-speed gearboxes and fewer moving parts.
Opportunity: Adoption of sensor-integrated bearings for condition-based monitoring and predictive maintenance
Sensor-integrated bearings are being used to monitor key parameters, such as temperature, vibration, load, and rotational speed, allowing real-time insights into the bearing’s health and operational environment. This functionality enables condition-based monitoring, which forms the foundation of predictive maintenance strategies across automotive, industrial, and mobility applications.
Challenge: Persistent supply chain instability and extended lead times
Global bearing manufacturers face disruptions caused by logistical bottlenecks, port congestion, and escalating trade tensions, further complicated by shifting tariff regimes and geopolitical uncertainty. Rising costs of essential inputs such as chrome steel, aluminum, ceramics, and rare earth elements, coupled with higher freight charges and customs delays, have created significant procurement and financial unpredictability.
Automotive Bearing Market: COMMERCIAL USE CASES ACROSS INDUSTRIES
| COMPANY | USE CASE DESCRIPTION | BENEFITS |
|---|---|---|
 |
Advanced automotive bearings with low-friction coatings for passenger and commercial vehicles | Reduced friction losses, improved fuel efficiency, extended service life |
 |
Electrified vehicle bearings designed for e-axles and electric motors | High-speed performance, reduced noise and vibration, longer durability under high torque |
 |
Bearings integrated with sensors for condition monitoring in vehicles | Real-time performance data, predictive maintenance, reduced downtime |
 |
Lightweight wheel hub bearings for electric and hybrid vehicles | Improved energy efficiency, reduced vehicle weight, longer wheel-end life |
 |
Sealed bearings with enhanced lubrication for harsh environments | Lower maintenance needs, better resistance to contamination, extended bearing reliability |
Logos and trademarks shown above are the property of their respective owners. Their use here is for informational and illustrative purposes only.
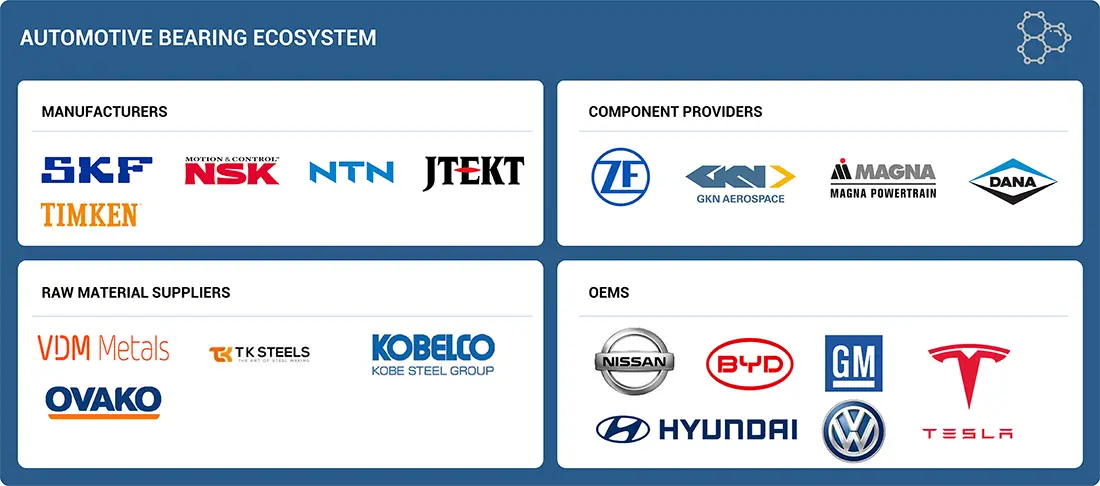
MARKET ECOSYSTEM
This section highlights various players in the automotive bearings market ecosystem, primarily represented by automotive bearing manufacturers, distributors, and automotive OEMs. The automotive bearing ecosystem includes raw material suppliers, such as Ovako, VDM Metals, Kobelco, and TK Steels, who provide high-quality steel and alloys required for durable bearing production. These raw materials are then used by bearing manufacturers like SKF, NSK, NTN, JTEKT, and Timken to design and produce precision bearings. The finished bearings are supplied to Tier 1 suppliers and component providers such as Dana, Magna, ZF, and GKN, who integrate them into critical automotive systems, including powertrains, drivetrains, and chassis components. Finally, OEMs like Tesla, BYD, Nissan, Hyundai, GM, and Volkswagen incorporate these systems into complete vehicles, delivering the final product to end consumers.
Logos and trademarks shown above are the property of their respective owners. Their use here is for informational and illustrative purposes only.
MARKET SEGMENTS
Source: Secondary Research, Interviews with Experts, MarketsandMarkets Analysis
Automotive Bearing Market, By Bearing Type
Ball bearings are widely used in the automotive industry because they can handle various loads while providing smooth, low-friction rotation. Their compact size, low cost, and maintenance make them essential for a range of critical applications across automotive drivetrains, engines, interiors, and other components.
Automotive Bearing Market, By EV Type
The electric vehicle market, encompassing battery electric vehicles and plug-in hybrid electric vehicles, is rapidly transforming the automotive sector. Stricter emission norms, advancing technology, and supportive policies are accelerating adoption, reshaping bearing design and demand across both vehicle types.
Automotive Bearing Market, By Vehicle Type
The passenger car segment leads the market, driven by EV growth and demand for efficient, durable bearings. Manufacturers are innovating EV-specific designs and advanced materials. Collaborations with OEMs accelerate this evolution. This segment is the largest and most dynamic in the bearings industry.
Automotive Bearing Market, By Application
Automotive bearings are used in interior systems like seats and HVAC, as well as exterior features such as sunroofs and power liftgates. The increasing demand for premium features and advanced systems is driving the need for durable, low-friction bearings. These components ensure smooth, quiet, and reliable operation throughout a vehicle's life.
Automotive Bearing Market, By Aftermarket
The automotive bearings aftermarket ensures vehicle reliability and safety by replacing worn components with precision solutions. The demand is driven by vehicle age, maintenance frequency, and regulatory standards. Advances in automotive technology, including ADAS and comfort features, boost demand for high-performance, specialized bearings. This creates growth opportunities for suppliers offering durable, premium replacement parts that meet evolving customer needs.
REGION
Asia Pacific to be the fastest-growing region in the global automotive bearing market during the forecast period
The Asia Pacific automotive bearings market is set for strong growth, driven by its manufacturing prowess and increasing vehicle ownership. Key countries like China, India, Japan, and South Korea are leading this expansion, each with unique market dynamics. The region's demand for advanced bearing technologies is further boosted by urbanization, infrastructure development, and government incentives for fuel efficiency.
Automotive Bearing Market: COMPANY EVALUATION MATRIX
The company evaluation matrix for the market positions players based on market share, rank, and product footprint. In the Stars quadrant, NSK leads the market with global scale, a broad product portfolio, and long-standing OEM relationships. Its focus on lightweight, low-friction, and sensor-enabled bearings strengthens its presence across passenger, commercial, and electric vehicles. In the Emerging Leaders quadrant, Schaeffler is building momentum with precision e-mobility bearings, hybrid assemblies, and strategic synergies following the Vitesco merger.
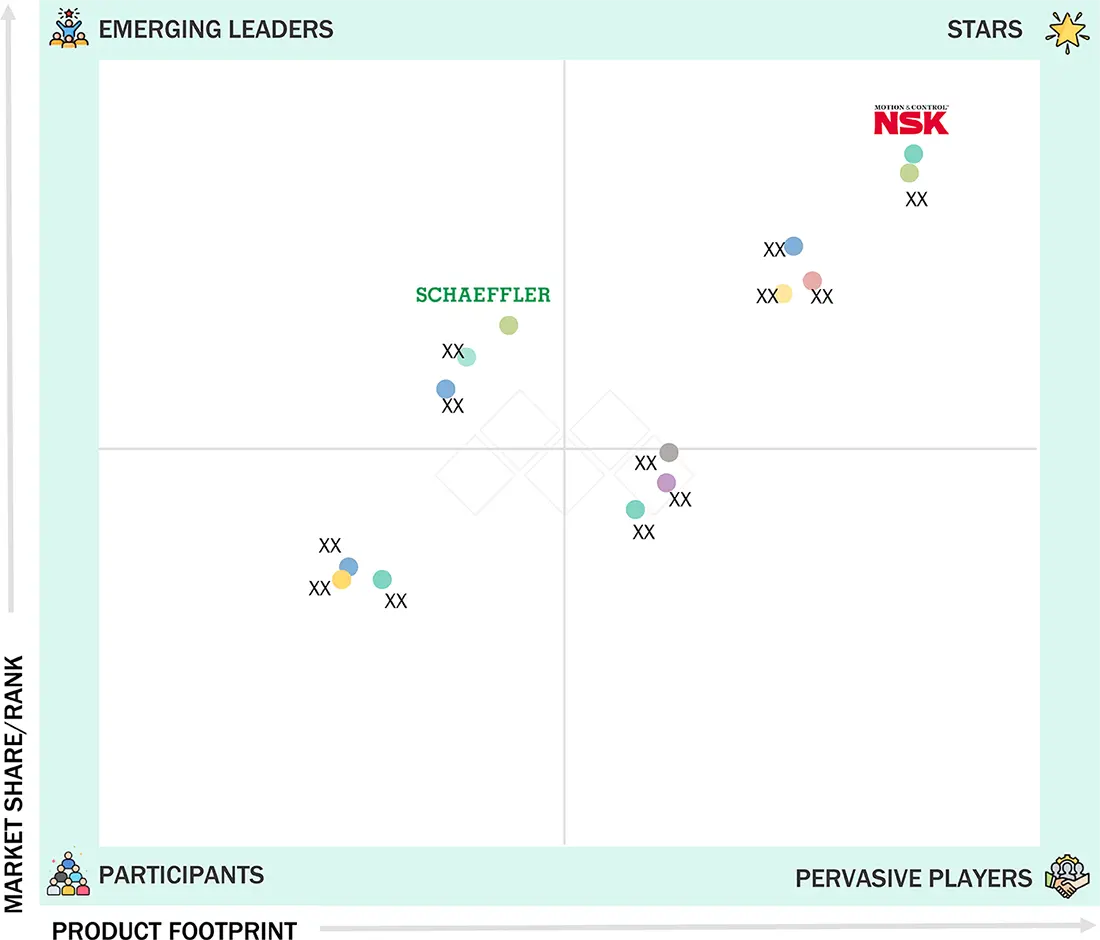
Source: Secondary Research, Interviews with Experts, MarketsandMarkets Analysis
KEY MARKET PLAYERS
MARKET SCOPE
| REPORT METRIC | DETAILS |
|---|---|
| Market Size in 2024 (Value) | USD 29.62 Billion (ICE Segment) |
| Revenue Forecast in 2032 (Value) | USD 31.72 Billion (ICE Segment) |
| Growth Rate | CAGR of 0.32% from 2025 to 2032 (ICE Segment) |
| Years Considered | 2021–2032 |
| Base Year | 2024 |
| Forecast Period | 2025–2032 |
| Units Considered | Value (USD Million/Billion); Volume (Thousand Units) |
| Report Coverage | Revenue forecast, company ranking, competitive landscape, growth factors, and trends |
| Segments Covered |
|
| Regional Scope | Asia Pacific, North America, Europe, Rest of the World |
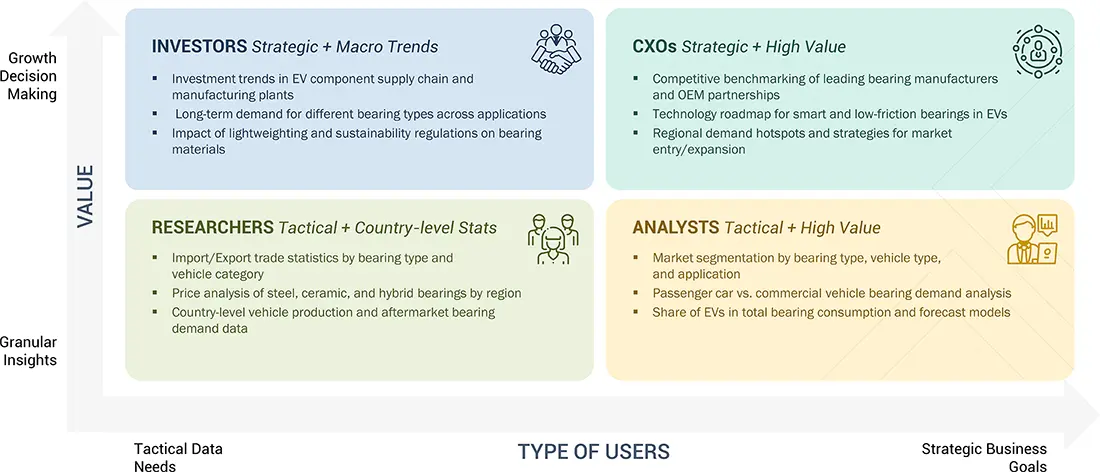
WHAT IS IN IT FOR YOU: Automotive Bearing Market REPORT CONTENT GUIDE
DELIVERED CUSTOMIZATIONS
We have successfully delivered the following deep-dive customizations:
| CLIENT REQUEST | CUSTOMIZATION DELIVERED | VALUE ADDS |
|---|---|---|
| Automotive OEMs | Requirement analysis of bearings for ICE, hybrid, and electric vehicles Benchmarking of supplier offerings across wheel hub, engine, and transmission applications Assessment of lightweight and high-performance materials such as ceramics and composites | Identify optimal bearing solutions for improved vehicle efficiency Support long-term sourcing strategy for diversified platforms Enable cost and weight reduction through advanced materials |
| Bearing Manufacturers | Competitive benchmarking against global peers on product portfolios and technology focus Evaluation of demand for EV-specific motor and e-axle bearings Assessment of integration of sensor-enabled smart bearings | Highlight opportunities in EV and hybrid markets Map technology convergence with predictive maintenance solutions Identify aftermarket opportunities for intelligent bearing systems |
| Automotive Component Suppliers | Analysis of demand for low-friction and high-durability bearings in drivetrains and chassis systems Mapping of technology adoption for noise and vibration reduction Market sizing of hub unit and gearbox bearings | Support diversification into EV-ready bearing solutions Provide input for product development aligned with OEM needs Strengthen positioning in high-growth applications |
| Investment Funds | Market consolidation and acquisition target assessment Revenue forecasts by vehicle type and propulsion technology Evaluation of disruption from ceramic and smart bearing technologies | Support due diligence for bearing manufacturer acquisitions Identify high-growth segments within electrification and autonomous driving Assess long-term demand outlook across global markets |
| Fleet Operators/Logistics Companies | Bearings designed for high-load and high-mileage performance in commercial vehicles Solutions with extended lubrication intervals and sealed units Aftermarket supply and service support | Reduced downtime and maintenance costs Longer bearing life under demanding duty cycles Better fleet efficiency and total cost of ownership |
| Aftermarket Customers | Wide range of replacement bearings compatible with multiple vehicle models Availability of remanufactured and cost-effective bearing solutions Support for regional distribution networks | Affordable and reliable replacement options Strengthened service and parts availability Increased trust through warranty and technical support |
RECENT DEVELOPMENTS
- 5/1/2025: NTN established volume production technology for bearings using its proprietary HA-C heat treatment, which increases steel hardness and enables size and weight reduction while extending lifespan. Prototypes for deep groove ball bearings have been released, targeting e-axles, transmissions, and compressors, with mass production expected in H2 FY 2026. NTN aims for approximately 10.01 million units in sales by FY 2030 and plans to extend adoption to industrial applications.
- 4/1/2025: NTN developed a technology to identify the mechanism of electrolytic corrosion in bearings, focusing on discharge phenomena linked to abnormal noise and vibration. This technology predicts bearing life and optimizes product recommendations based on user-specific operating conditions. Field testing with selected customers is underway, with commercialization targeted for spring 2027.
- 3/1/2025: NSK developed a compact, lightweight ball bearing for EV e-axles with 25% less friction and > 2.14 M dmn, enabling 2.2 kg weight reduction and 0.09% energy efficiency gain.
- 9/1/2024: NSK developed a new low-friction hub bearing that reduces frictional resistance by 40% while maintaining water resistance. Key innovations include a U-shaped slinger, fewer contact lips, low-viscosity grease, and the world’s first laser-processed seal surface. These improvements enhanced fuel and power efficiency. NSK targets JPY 20 billion in sales by 2026 through global OEM adoption.
- 5/1/2024: NTN developed the Low Friction Hub Bearing V, featuring newly formulated low-torque grease that reduces rotational friction by ~64% compared to conventional products. The grease enhances base oil retention and reduces thickener volume using fine particulates. NTN aims for JPY 4.5 billion in sales by FY 2030 and plans to showcase the product at the Automotive Engineering Exposition 2024.
Table of Contents
 Exclusive indicates content/data unique to MarketsandMarkets and not available with any competitors.
Methodology
The research study involved extensive use of secondary sources, such as company annual reports/presentations, industry association publications, magazines, directories, technical handbooks, World Economic Outlook, trade websites, technical articles, and databases to identify and collect information on the automotive bearing market. In-depth interviews were conducted with various primary sources experts from related industries, automobile OEMs, and suppliers to obtain and verify critical information and assess the growth prospects and market estimations.
Secondary Research
In the secondary research process, various secondary sources were used to identify and collect information on the automotive bearing market for this study. Secondary sources included annual reports, press releases, and investor presentations of companies; whitepapers, certified publications, and articles from recognized authors; directories; databases; and articles from recognized associations and government publishing sources.
Primary Research
Extensive primary research was conducted after understanding the automotive bearing market scenario through secondary research. Several primary interviews were conducted with market experts from the demand and supply sides across North America, Europe, Asia Pacific, and Rest of the world. Approximately 45% and 55% of primary interviews were conducted from the demand and supply sides. Primary data was collected through questionnaires, emails, and telephonic interviews.
In the canvassing of primaries, various departments within organizations, such as sales, operations, and marketing, were covered to provide a holistic viewpoint in the report. After interacting with industry experts, brief sessions were conducted with experienced independent consultants to reinforce the findings from the primaries. This and the opinions of in-house subject matter experts led to the conclusions described in the remainder of this report.

Note: The tiers above are based on the value chain of the bearing market; companies’ revenues were
not considered. Tier I companies are auto component providers, and Tier 2 includes automotive bearing manufacturers.
To know about the assumptions considered for the study, download the pdf brochure
Market Size Estimation
The top-down and bottom-up approaches were used to estimate and validate the automotive bearing market size. The research methodology used to estimate the market size included the following details:
- The market size was derived using parameters, such as sales of bearings and the corresponding penetration of the applications considered under the scope.
- Key players in the market were identified through secondary research, and their global market rankings were determined through primary and secondary research.
- The research methodology included studying annual and quarterly financial reports, regulatory filings of major market players, and interviews with industry experts to gain detailed market insights.
- All major penetration rates, percentage shares, splits, and breakdowns for the market were determined through secondary sources and verified through primary sources.
- All key macro indicators affecting the revenue growth of the market segments and subsegments have been accounted for, viewed in extensive detail, verified through primary research, and analyzed to get the validated and verified quantitative & qualitative data.
Automotive Bearing Market : Top-Down and Bottom-Up Approach

Data Triangulation
After arriving at the overall market size of the global market through the above-mentioned methodology, this market was split into several segments and subsegments. The data triangulation and market breakdown procedures were employed, wherever applicable, to complete the overall market engineering process and arrive at the exact data for the market by value for the key segments and subsegments. The extrapolated market data was triangulated by studying various macro indicators and regional trends from the demand and supply-side participants.
Market Definition
The automotive bearing market involves developing, producing, and supplying precision-engineered components that minimize friction and support rotational or linear movement across various automotive systems. These include various bearing types, such as ball bearings, roller bearings, and plain bearings, each tailored to specific load and performance requirements. Automotive bearings are integral to critical functions in engines, transmissions, wheels, steering mechanisms, drivetrains, and electric powertrains, ensuring efficiency, durability, and safety in traditional internal combustion vehicles and modern electric or hybrid platforms.
Stakeholders
- Associations, Forums, and Alliances Related to Automotive Software
- Authorized and Independent Automobile Service Centers
- Automotive Component Manufacturers
- Aftermarket Bearing Suppliers
- Automotive Dealers and Distributors
- Automotive Electronic Control Unit Manufacturers
- Automotive OEMs
- Automotive Component Manufacturers
- Equipment Service Providers
- EV Component Manufacturers
- EV Manufacturers
- ICE Vehicle Manufacturers
- Legal and Regulatory Authorities
- Network Providers
- Raw Material Suppliers for Bearings
- Raw Material Suppliers for Components
- Vehicle Safety Regulatory Bodies
Report Objectives
- To segment and forecast the size of the automotive bearing Market in terms of volume (million units) and value (USD million) from 2021 to 2032
- To define, describe, and forecast the market in terms of volume (million units) and value (USD million)
-
To define, describe, and forecast the global market based on bearing type, application, vehicle type, EV type, end uses, and region
- To segment and forecast the market size by bearing type (Ball Bearings, Roller Bearings, and Other bearings)
- To segment and forecast the market size by application (Wheel Hub, Transmission System, Drivetrain, Engine, and Other Applications)
- To segment and forecast the market size by vehicle type (Passenger Car, Light Commercial Vehicle, and Heavy Commercial Vehicle)
- To segment and forecast the market size by EV type (BEV and PHEV)
- To segment and forecast the market size by aftermarket (Wheel Hub, Transmission System, Drivetrain, Engine, and Other Applications)
- To forecast the market size with respect to key regions, namely Asia Pacific, Europe, North America, and the Rest of the World
- To provide detailed information regarding the major factors influencing market growth (drivers, challenges, restraints, and opportunities)
- To strategically analyze markets with respect to individual growth trends, prospects, and contributions to the total market
-
To study the following dynamics of the automotive bearing market:
- Pricing Analysis
- Investment and Funding Scenario
- Value Chain Analysis
- Ecosystem Analysis
- Technology Analysis
- HS Code/Trade Analysis
- Case Study Analysis
- Patent Analysis
- Regulatory Landscape
- Key Stakeholders and Buying Criteria
- Key Conferences and Events
- Impact of AI
- To strategically profile key players and comprehensively analyze their market share and core competencies
- To analyze opportunities for stakeholders and the competitive landscape for market leaders
- To track and analyze competitive developments such as product developments, deals, and others undertaken by the key industry participants
Available Customizations
With the given market data, MarketsandMarkets offers customizations in accordance with a company’s specific needs.
- Automotive Bearing Market, By Material Type, at Country Level (For countries covered in the report)
- Automotive Bearing Market, By Vehicle Type, at Country Level (For countries covered in the report)
Company Information
- Profiling of Additional Market Players (Up to Five)
Key Questions Addressed by the Report
What is the current size of the automotive bearing market for EVs by value?
Automotive bearing market for EVs is projected to grow from USD 5.81 billion in 2025 to reach USD 12.82 billion by 2032, at a CAGR of 11.97%.
Who are the winners in the automotive bearing market?
NSK Ltd. (Japan), NTN Corporation (Germany), The Timken Company (USA), JTEKT Corporation (Japan), and Nachi Fujikoshi (Japan) are the winners in the automotive bearing market
Which region is projected to account for the largest share of the automotive bearing market during the forecast period?
Asia Pacific is projected to be the largest market for automotive bearings during the forecast period. The growth is driven by the diverse and rapidly expanding automotive industry in the region. Expanding manufacturing capacity across key countries like China, India, Japan, and South Korea is also helping the region capitalize on this opportunity effectively. This expansion helps meet the increasing demand from original equipment manufacturers and the aftermarket, where vehicle maintenance and replacement parts form a significant market share.
What are the new market trends impacting the growth of the automotive bearing market?
The key trends impacting the growth of the automotive bearing market are smart sensor-embedded bearings and alternative hybrid material bearings.
What is driving the automotive bearing market in North America?
The North American automotive bearing market, covering the US, Canada, and Mexico, is driven by strong vehicle manufacturing, consumer demand for high-performance, and evolving regulatory standards.
Need a Tailored Report?
Customize this report to your needs
Get 10% FREE Customization
Customize This ReportPersonalize This Research
- Triangulate with your Own Data
- Get Data as per your Format and Definition
- Gain a Deeper Dive on a Specific Application, Geography, Customer or Competitor
- Any level of Personalization
Let Us Help You
- What are the Known and Unknown Adjacencies Impacting the Automotive Bearing Market
- What will your New Revenue Sources be?
- Who will be your Top Customer; what will make them switch?
- Defend your Market Share or Win Competitors
- Get a Scorecard for Target Partners

Custom Market Research Services
We Will Customise The Research For You, In Case The Report Listed Above Does Not Meet With Your Requirements
Get 10% Free CustomisationTESTIMONIALS

JIM NAAS
PRODUCT DIRECTOR, WEASLER
Weasler Engineering, a CentroMotion organization
Global Provider of Industrial Actuation & Control Solutionswww.weasler.com
Our organization was interested in learning more about the attractiveness of a particular market space. We contacted MarketsandMarkets to help us based on previous positive experiences we had with them. The results did not disappoint! We discussed our objectives with them, and the team at MarketsandMarkets developed and executed a proposal that met our needs precisely. We were very impressed by their level of expertise, the quality of the analysis and their insightful recommendations. We would not hesitate in working with them again in the future.

Matt Kardel,
Vice President
Aptiv,
A global technology company that develops safer, greener and more connected solutions.www.aptiv.com
We contracted with
MarketsandMarkets to evaluate the value chain and potential go-to-market partners related to our
interest in the Fleet Management space. The team successfully completed the work on time and at the
pricing agreed. MarketsandMarkets listened and understood our objectives and collaborated well with
us to help us get the visibility we needed to make an investment.
We have subsequently used
MarketsandMarkets again related to Smart Cities to good results.
Growth opportunities and latent adjacency in Automotive Bearing Market


Amey
Nov, 2019
This report could be good reference. However we are interested to know assumptions and methodology , prior purchasing full copy of this report..