Sepsis Diagnostics Market by Technology (Microbiology, PCR, Sequencing, Biomarkers), Product (Reagents, Assay, Instruments, Software), Test Type (Lab, POC), Pathogen (Bacterial, Viral, Fungal), End User (Hospital, Pathology Lab) & Region - Global Forecast to 2026
The global sepsis diagnostics market in terms of revenue was estimated to be worth $503 million in 2021 and is poised to reach $771 million by 2026, growing at a CAGR of 8.9% from 2021 to 2026. The new research study consists of an industry trend analysis of the market. The new research study consists of industry trends, pricing analysis, patent analysis, conference and webinar materials, key stakeholders, and buying behaviour in the market. The demand for sepsis diagnostic products is expected to grow mainly due to factors such as the increasing public-private funding for sepsis diagnostic research activities, the growing burden of infectious diseases, the rising number of sepsis incidences, and growing government initiatives for creating sepsis awareness.
To know about the assumptions considered for the study, Request for Free Sample Report
Sepsis Diagnostics Market Dynamics
Driver: Rising incidence of hospital-acquired infections
Hospital-acquired infections (HAIs), also known as nosocomial infections, are a major cause of morbidity and mortality worldwide. The most common hospital-acquired infections (HAIs) are urinary tract infections, pneumonia, and sepsis. HAIs can lead to sepsis in immunocompromised patients, geriatric patients, and patients suffering from chronic illnesses. In the US, the incidence of sepsis among hospitalized patients is rising by 8.7% per year. It is estimated that more than 1,000,000 cases of sepsis among hospitalised patients occur each year in the United States (Source: CDC, 2018). With the rapid increase in HAIs worldwide, the demand for sepsis diagnostic products is also expected to rise in the coming years.
Opportunity: Development of rapid diagnostic/POC techniques for early sepsis diagnosis
Sepsis is a very difficult condition to diagnose and the risk of mortality increases by 7.6% with a delay of even 1 minute in antibiotic administration in septic shock patients with hypertension. Thus, increasing the need for the rapid diagnosis of sepsis to reduce the delay of antibiotic therapy among patients with sepsis. Many sepsis diagnostic manufacturers are expanding their product offering in point of care technology rapidly detecting the sepsis, reducing the overall turnaround time of diagnosis. . The BACTEC Plus, BacT/Alert, and BACTEC FX blood culturing instruments manufactured by BD Company (US) is an automated microbial detection system offering a rapid diagnosis of sepsis in the turnaround time of three hours.
Restraint: High cost of automated diagnostic devices
The cost of molecular diagnostic tests is between USD 300 and USD 3,000, which is very high compared to the cost of blood culture tests, priced as low as ~USD 28–35. Companies focus on developing automated diagnostic devices based on advanced technologies, such as molecular diagnostics, on detecting sepsis but due to limited budgets, government hospitals (especially in emerging nations) and academic research laboratories cannot afford such systems. Further, becoming the major factor for the hindrance of the growth of market.
Challenge: Shortage of skilled healthcare professionals
Sepsis is a life-threatening condition that needs to be diagnosed and treated at the earliest with the help of skilled healthcare professionals. The shortage of skilled professionals is a major concern worldwide; only 50% of patients with severe sepsis transported by the EMS system have a paramedic. The lack of trained paramedics affects each phase of patient care—sepsis awareness, screening patients for the presence of sepsis, and making an appropriate
The blood culture segment accounted for the largest share of the sepsis diagnostics industry, by technology
By technology, the sepsis diagnostics market is segmented into blood culture, immunoassays, molecular diagnostics, flow cytometry, microfluidics, and biomarkers. The blood culture segment accounted for the largest share of market during the forecast period. This share can be attributed to the low cost of microbiology techniques and the extensive use of blood culture methods for the diagnosis of sepsis.
The blood culture media segment accounted for the largest share of the sepsis diagnostics industry, by product
By product, the sepsis diagnostics market is segmented into blood culture media, assays and reagent kits, instruments, and software. During the forecast period, the blood culture media segment held the largest market share. This share can be attributed to the growing utilization of blood culture media by hospitals and pathology laboratories for the diagnosis of sepsis, coupled with an increase in the availability of blood culture media in the market.
The bacterial sepsis segment accounted for the largest share of the sepsis diagnostics industry, by pathogen type
By technology, the sepsis diagnostics market is segmented into bacterial sepsis, viral sepsis, fungal sepsis, and other pathogens. The bacterial sepsis segment accounted for the largest share of the market during the forecast period. This share can be attributed to the rise in the bacterial sepsis cases, the increasing number of surgical procedures, and the rising prevalence of HAIs.
The hospitals & specialty Clinics segment accounted for the largest share of the sepsis diagnostics industry by end users
Based on end-user, the sepsis diagnostics market is segmented into hospitals and specialty clinics, pathology and reference laboratories, and research laboratories and academic institutes. The hospitals and specialty clinics accounted for the largest share of the sepsis diagnostics industry. The larger share of this segment can be attributed to the high prevalence of sepsis coupled with a large number of fatalities caused by the illness, the increasing number of patients hospitalized with sepsis, and in-house hospital laboratories performing a large number of blood culture tests to identify the blood stream infections (BSIs caused by bacteria, fungi/yeast, or viruses).
To know about the assumptions considered for the study, download the pdf brochure
North America is the largest region in sepsis diagnostics industry
North America is a well-established market for medical devices. The presence of a highly developed healthcare system, high adoption of innovative sepsis diagnostic technologies among medical professionals, reigning number of surgical procedures, increasing incidence of healthcare-associated infections (HAIs) and technological advancements in the field of sepsis diagnostics are the major factors driving the growth of the sepsis diagnostics market in North America.
The prominent players operating in the global sepsis diagnostics market include bioMérieux (France), Becton, Dickinson and Company (US), Danaher Corporation (US), T2 Biosystems (US), Luminex (US), Roche Diagnostics (Switzerland), Thermo Fisher Scientific (US), Bruker Corporation (US), Abbott Laboratories (US), Immunexpress (Australia), Axis-Shield Diagnostics (UK), Quidel Corporation (US), Siemens Healthineers (Germany), EKF Diagnostics (UK), Seegene Inc., (South Korea), Boditech Med (South Korea), Alifax S.r.l. (Italy), AdvanDx (US), (US), Immunexpress (Australia), and Axis-Shield Diagnostics (UK)
BioMerieux is the top player of the market. The company has been focusing on new product development and product approvals in the field of sepsis diagnostics. In addition, the company has a strong global presence with strong distribution channels to serve markets in North America, Europe, Oceania, Africa, and Asia Pacific. The company also tries to evaluate new, emerging, and complementary technologies to identify new product opportunities.
Scope of the Sepsis Diagnostics Industry
Report Metric |
Details |
Market Revenue in 2021 |
$503 million |
Projected Revenue by 2026 |
$771 million |
Revenue Rate |
Poised to grow at a CAGR of 8.9% |
Market Driver |
Rising incidence of hospital-acquired infections |
Market Opportunity |
Development of rapid diagnostic/POC techniques for early sepsis diagnosis |
This study categorizes the global sepsis diagnostics market to forecast revenue and analyze trends in each of the following submarkets:
By Technology
- Blood Culture
- Immunoassays
-
Molecular Diagnostics
- PCR
- Peptide Nucleic Acid-Fluorescent In Situ Hybridization
- Microarrays
- DNA sequencing
- Syndromic Panel-Based Testing
- Flow Cytometry
- Microfluidics
- Biomarkers
By Product
- Blood Culture Media
- Assays & Reagents
- Instruments
- Software
By Method
- Automated Diagnostics
- Conventional Diagnostics
By Pathogen
-
Bacterial Sepsis
- Gram-Negative Bacterial Sepsis
- Gram-Positive Bacterial Sepsis
- Fungal Sepsis
- Viral Sepsis
- Other Pathogen
By Test Type
- Laboratory Tests
- Point-of-Care Tests
By End User
- Hospitals and specialty clinics
- Pathology & Reference Laboratories
- Research Laboratories & Academic Institutes
By Region
-
North America
- US
- Canada
-
Europe
- Germany
- France
- UK
- Spain
- Italy
- RoE
-
Asia Pacific
- China
- Japan
- Australia
- South Korea
- India
- RoAPAC
-
Latin America
- Brazil
- Mexico
- RoLATAM
- Middle East & Africa
Recent Developments of the Sepsis Diagnostics Industry
- In June 2021, bioMérieux bioMérieux signed an agreement with Specific Diagnostics to distribute a specific reveal rapid AST system in Europe.
- In September 2020, Roche Diagnostics collaborated with Inotrem to develop the sTREM-1 test, a diagnostic solution for sepsis.
- In January 2020, Danaher corporation launched the DxH 690T hematology analyzer in the US for the early detection of sepsis.
- In October 2019, BD received FDA clearance for its BD MAX Check-Points CPO assay molecular screening test to detect antibiotic-resistant bacteria.
Frequently Asked Questions (FAQ):
What is the projected market revenue value of the global sepsis diagnostics market?
The global sepsis diagnostics market boasts a total revenue value of $771 million by 2026.
What is the estimated growth rate (CAGR) of the global sepsis diagnostics market?
The global sepsis diagnostics market has an estimated compound annual growth rate (CAGR) of 8.9% and a revenue size in the region of $503 million in 2021.
To speak to our analyst for a discussion on the above findings, click Speak to Analyst
TABLE OF CONTENTS
1 INTRODUCTION (Page No. - 30)
1.1 OBJECTIVES OF THE STUDY
1.2 SEPSIS DIAGNOSTICS MARKET - MARKET DEFINITION
1.2.1 INCLUSIONS & EXCLUSIONS OF THE STUDY
1.3 MARKET SCOPE
1.3.1 MARKETS COVERED
1.3.2 YEARS CONSIDERED FOR THE STUDY
1.4 CURRENCY USED FOR THE STUDY
1.5 MAJOR MARKET STAKEHOLDERS
1.6 SUMMARY OF CHANGES
2 RESEARCH METHODOLOGY (Page No. - 35)
2.1 RESEARCH DATA
FIGURE 1 RESEARCH DESIGN
2.1.1 SECONDARY DATA SOURCES
2.1.1.1 Indicative list of secondary sources
2.1.2 PRIMARY DATA SOURCES
FIGURE 2 BREAKDOWN OF PRIMARIES: SEPSIS DIAGNOSTICS MARKET
2.2 MARKET ESTIMATION METHODOLOGY
FIGURE 3 RESEARCH METHODOLOGY: HYPOTHESIS BUILDING
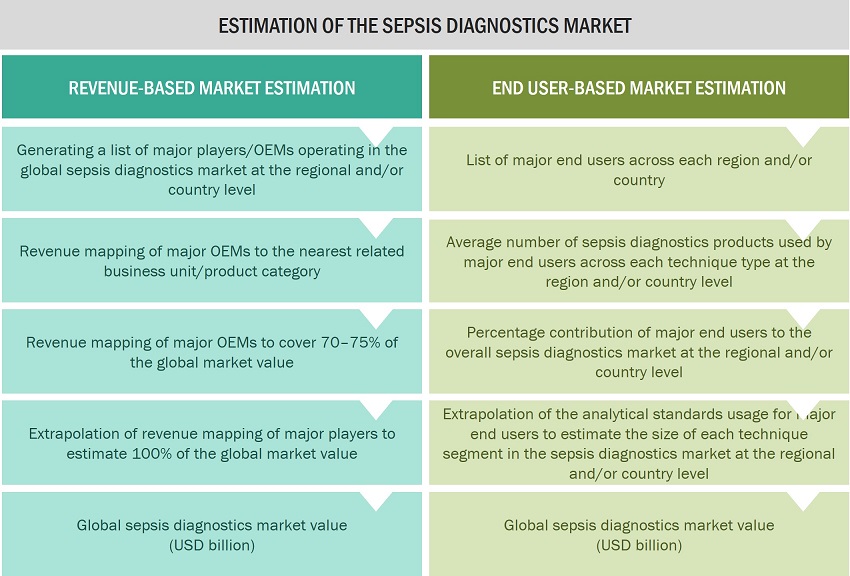
2.2.1 REVENUE MAPPING-BASED MARKET ESTIMATION
2.2.1.1 Procedure-based market estimation
FIGURE 4 MARKET SIZE ESTIMATION: BASED ON PROCEDURE METHODOLOGY
FIGURE 5 MARKET SIZE ESTIMATION: BASED ON REVENUE MAPPING METHODOLOGY
2.2.2 PRIMARY RESEARCH VALIDATION
2.3 DATA TRIANGULATION
FIGURE 6 DATA TRIANGULATION METHODOLOGY
2.4 RESEARCH ASSUMPTIONS
2.5 RESEARCH LIMITATIONS
3 EXECUTIVE SUMMARY (Page No. - 44)
FIGURE 7 SEPSIS DIAGNOSTICS MARKET, BY PRODUCT, 2021 VS. 2026 (USD MILLION)
FIGURE 8 MARKET, BY TECHNOLOGY, 2021 VS. 2026 (USD MILLION)
FIGURE 9 MARKET, BY METHOD, 2021 VS. 2026 (USD MILLION)
FIGURE 10 MARKET, BY TEST TYPE, 2021 VS. 2026 (USD MILLION)
FIGURE 11 MARKET, BY PATHOGEN, 2021 VS. 2026 (USD MILLION)
FIGURE 12 MARKET, BY END USER, 2021 VS. 2026 (USD MILLION)
FIGURE 13 GEOGRAPHICAL SNAPSHOT OF THE SEPSIS DIAGNOSTICS INDUSTRY
4 PREMIUM INSIGHTS (Page No. - 49)
4.1 SEPSIS DIAGNOSTICS MARKET OVERVIEW
FIGURE 14 THE RISING INCIDENCE OF SEPSIS AND THE RISING NUMBER OF HOSPITAL-ACQUIRED INFECTIONS ARE KEY FACTORS DRIVING THE MARKET GROWTH
4.2 GLOBAL MARKET, BY TECHNOLOGY, 2021 VS. 2026 (USD MILLION)
FIGURE 15 MOLECULAR DIAGNOSTICS TO REGISTER THE HIGHEST GROWTH IN THE MARKET DURING THE FORECAST PERIOD
4.3 GLOBAL MARKET, BY METHOD, 2021 VS. 2026 (USD MILLION)
FIGURE 16 CONVENTIONAL DIAGNOSTICS IS EXPECTED TO COMMAND THE LARGEST SHARE OF THE MARKET, BY METHOD, DURING THE FORECAST PERIOD
4.4 ASIA PACIFIC: GLOBAL SEPSIS DIAGNOSTICS MARKET, BY PRODUCT AND COUNTRY (2021)
FIGURE 17 BLOOD CULTURE MEDIA SEGMENT TO ACCOUNT FOR THE LARGEST SHARE OF THE MARKET FOR APAC
4.5 GEOGRAPHIC SNAPSHOT OF THE GLOBAL MARKET
FIGURE 18 APAC MARKET TO WITNESS THE HIGHEST GROWTH DURING THE FORECAST PERIOD (2021–2026)
5 MARKET OVERVIEW (Page No. - 54)
5.1 INTRODUCTION
5.2 MARKET DYNAMICS
FIGURE 19 SEPSIS DIAGNOSTICS MARKET: DRIVERS, RESTRAINTS, OPPORTUNITIES, AND CHALLENGES
5.2.1 DRIVERS
5.2.1.1 High incidence of sepsis
5.2.1.2 Rising incidence of hospital-acquired infections
5.2.1.3 Growing funding for sepsis-related research
5.2.2 RESTRAINTS
5.2.2.1 High cost of automated diagnostic devices
5.2.3 OPPORTUNITIES
5.2.3.1 Development of rapid diagnostic/POC techniques for early sepsis diagnosis
5.2.3.2 Evolution of novel biomarkers for sepsis diagnosis
5.2.3.3 Growth opportunities in emerging economies
5.2.4 CHALLENGES
5.2.4.1 Lack of awareness and limited protocols for sepsis diagnosis
5.2.4.2 Shortage of skilled healthcare professionals
5.3 REGULATORY LANDSCAPE
5.3.1 NORTH AMERICA
5.3.1.1 US
5.3.1.2 Canada
5.3.2 EUROPE
5.3.3 ASIA PACIFIC
5.3.3.1 China
5.3.3.2 Japan
5.3.3.3 India
5.3.4 LATIN AMERICA
5.4 PATENT ANALYSIS
FIGURE 20 TOP 10 PATENT APPLICANTS FOR SEPSIS DIAGNOSTICS (JANUARY 2011 TO DECEMBER 2021)
FIGURE 21 NUMBER OF GRANTED PATENT AND PATENT APPLICATIONS FILED BY APPLICATIONS (JANUARY 2011 TO DECEMBER 2021)
FIGURE 22 PATENT DOCUMENTS FOR SEPSIS DIAGNOSTICS, BY LEGAL STATUS (JANUARY 2011 TO DECEMBER 2021)
FIGURE 23 REGIONAL ANALYSIS OF PATENTS GRANTED FOR SEPSIS DIAGNOSTICS (JANUARY 2011 TO DECEMBER 2021)
5.5 COVID-19 IMPACT ON THE GLOBAL MARKET
5.6 VALUE CHAIN ANALYSIS
FIGURE 24 VALUE CHAIN OF THE GLOBAL MARKET
5.7 PRICING TREND ANALYSIS
TABLE 1 AVERAGE PRICE OF SEPSIS DIAGNOSTICS BLOOD CULTURE MEDIA, ASSAYS & REAGENT KITS AND EQUIPMENT, BY COUNTRY, 2020 (USD)
5.8 REIMBURSEMENT SCENARIO
TABLE 2 MS DRG PAYMENT CALCULATED FOR NATIONAL PROVIDERS
5.9 PORTER’S FIVE FORCES ANALYSIS
TABLE 3 MARKET: PORTER’S FIVE FORCES ANALYSIS
5.9.1 THREAT OF NEW ENTRANTS
FIGURE 25 THREAT OF NEW ENTRANTS
5.9.2 THREAT OF SUBSTITUTES
FIGURE 26 THREAT OF SUBSTITUTES
5.9.3 BARGAINING POWER OF SUPPLIERS
FIGURE 27 BARGAINING POWER OF SUPPLIERS
5.9.4 BARGAINING POWER OF BUYERS
FIGURE 28 BARGAINING POWER OF BUYERS
5.9.5 INTENSITY OF COMPETITIVE RIVALRY
FIGURE 29 INTENSITY OF COMPETITIVE RIVALRY
5.10 ECOSYSTEM COVERAGE
6 SEPSIS DIAGNOSTICS MARKET, BY TECHNOLOGY (Page No. - 71)
6.1 INTRODUCTION
TABLE 4 GLOBAL SEPSIS DIAGNOSTICS INDUSTRY, BY TECHNOLOGY, 2019–2026 (USD MILLION)
6.2 BLOOD CULTURE (MICROBIOLOGY TESTING)
6.2.1 BLOOD CULTURE IS THE MOST COMMONLY ADOPTED TECHNOLOGY FOR SEPSIS DIAGNOSTICS
TABLE 5 BLOOD CULTURE MARKET, BY REGION, 2019–2026 (USD MILLION)
TABLE 6 BLOOD CULTURE MARKET, BY PRODUCT, 2019–2026 (USD MILLION)
TABLE 7 BLOOD CULTURE MARKET, BY METHOD, 2019–2026 (USD MILLION)
TABLE 8 BLOOD CULTURE MARKET, BY PATHOGEN TYPE, 2019–2026 (USD MILLION)
TABLE 9 BLOOD CULTURE MARKET, BY TEST TYPE, 2019–2026 (USD MILLION)
TABLE 10 BLOOD CULTURE MARKET, BY END USER, 2019–2026(USD MILLION)
6.3 IMMUNOASSAYS
6.3.1 PRODUCT DEVELOPMENT BY MAJOR PLAYERS HAS ENSURED THE DEMAND FOR IMMUNOASSAYS
TABLE 11 IMMUNOASSAYS MARKET, BY REGION, 2019–2026 (USD MILLION)
TABLE 12 IMMUNOASSAYS MARKET, BY PRODUCT, 2019–2026 (USD MILLION)
TABLE 13 IMMUNOASSAYS MARKET, BY METHOD, 2019–2026 (USD MILLION)
TABLE 14 IMMUNOASSAYS MARKET, BY PATHOGEN TYPE, 2019–2026 (USD MILLION)
TABLE 15 IMMUNOASSAYS MARKET, BY TEST TYPE, 2019–2026 (USD MILLION)
TABLE 16 IMMUNOASSAYS DIAGNOSTICS MARKET, BY END USER, 2019–2026(USD MILLION)
6.4 MOLECULAR DIAGNOSTICS
TABLE 17 MOLECULAR DIAGNOSTICS MARKET, BY TECHNOLOGY, 2019–2026(USD MILLION)
TABLE 18 MOLECULAR DIAGNOSTICS MARKET, BY REGION, 2019–2026 (USD MILLION)
TABLE 19 MOLECULAR DIAGNOSTICS MARKET, BY PRODUCT, 2019–2026 (USD MILLION)
TABLE 20 MOLECULAR DIAGNOSTICS MARKET, BY METHOD, 2019–2026 (USD MILLION)
TABLE 21 MOLECULAR DIAGNOSTICS MARKET, BY PATHOGEN TYPE, 2019–2026 (USD MILLION)
TABLE 22 MOLECULAR DIAGNOSTICS MARKET, BY TEST TYPE, 2019–2026 (USD MILLION)
TABLE 23 MOLECULAR DIAGNOSTICS MARKET, BY END USER, 2019–2026(USD MILLION)
6.4.1 POLYMERASE CHAIN REACTION (PCR)
6.4.1.1 Quick turnaround time, coupled with technological advancements to increase the adoption of PCR for sepsis diagnosis
TABLE 24 PCR MARKET, BY REGION, 2019–2026 (USD MILLION)
TABLE 25 PCR MARKET, BY PRODUCT, 2019–2026 (USD MILLION)
TABLE 26 PCR MARKET, BY METHOD, 2019–2026 (USD MILLION)
TABLE 27 PCR MARKET, BY PATHOGEN TYPE, 2019–2026 (USD MILLION)
TABLE 28 PCR MARKET, BY TEST TYPE, 2019–2026 (USD MILLION)
TABLE 29 PCR MARKET, BY END USER, 2019–2026(USD MILLION)
6.4.2 DNA MICROARRAYS
6.4.2.1 Simultaneous analysis capabilities & accuracy have driven the use of microarrays
TABLE 30 DNA MICROARRAYS MARKET, BY REGION, 2019–2026 (USD MILLION)
TABLE 31 DNA MICROARRAYS MARKET, BY PRODUCT, 2019–2026 (USD MILLION)
TABLE 32 DNA MICROARRAYS MARKET, BY METHOD, 2019–2026 (USD MILLION)
TABLE 33 DNA MICROARRAYS MARKET, BY PATHOGEN TYPE, 2019–2026 (USD MILLION)
TABLE 34 DNA MICROARRAYS MARKET, BY TEST TYPE, 2019–2026 (USD MILLION)
TABLE 35 DNA MICROARRAYS MARKET, BY END USER, 2019–2026(USD MILLION)
6.4.3 PEPTIDE NUCLEIC ACID-FLUORESCENT IN SITU HYBRIDIZATION (PNA-FISH)
6.4.3.1 PNA-FISH kits allow for the rapid diagnosis of bloodstream infections (BSIs)
TABLE 36 PNA-FISH MARKET, BY REGION, 2019–2026 (USD MILLION)
TABLE 37 PNA-FISH MARKET, BY PRODUCT, 2019–2026 (USD MILLION)
TABLE 38 PNA-FISH MARKET, BY METHOD, 2019–2026 (USD MILLION)
TABLE 39 PNA-FISH MARKET, BY PATHOGEN TYPE, 2019–2026 (USD MILLION)
TABLE 40 PNA-FISH MARKET, BY TEST TYPE, 2019–2026 (USD MILLION)
TABLE 41 PNA-FISH MARKET, BY END USER, 2019–2026(USD MILLION)
6.4.4 DNA SEQUENCING
6.4.4.1 DNA Sequencing shortens the time for sepsis diagnosis, and NGS has applications in COVID-19 diagnosis
TABLE 42 DNA SEQUENCING, BY REGION, 2019–2026 (USD MILLION)
TABLE 43 DNA SEQUENCING MARKET, BY PRODUCT, 2019–2026 (USD MILLION)
TABLE 44 DNA SEQUENCING MARKET, BY METHOD, 2019–2026 (USD MILLION)
TABLE 45 DNA SEQUENCING MARKET, BY PATHOGEN TYPE, 2019–2026 (USD MILLION)
TABLE 46 DNA SEQUENCING MARKET, BY TEST TYPE, 2019–2026 (USD MILLION)
TABLE 47 DNA SEQUENCING MARKET, BY END USER, 2019–2026(USD MILLION)
6.4.5 SYNDROMIC PANEL-BASED TESTING
6.4.5.1 High costs and accuracy errors limit the adoption of syndromic-panel-based tests
TABLE 48 SYNDROMIC PANEL-BASED TESTING MARKET, BY REGION, 2019–2026 (USD MILLION)
TABLE 49 SYNDROMIC PANEL-BASED TESTING MARKET, BY PRODUCT, 2019–2026 (USD MILLION)
TABLE 50 SYNDROMIC PANEL-BASED TESTING MARKET, BY METHOD, 2019–2026 (USD MILLION)
TABLE 51 SYNDROMIC PANEL-BASED TESTING MARKET, BY PATHOGEN TYPE, 2019–2026 (USD MILLION)
TABLE 52 SYNDROMIC PANEL-BASED TESTING MARKET, BY TEST TYPE, 2019–2026 (USD MILLION)
TABLE 53 SYNDROMIC PANEL-BASED TESTING MARKET, BY END USER, 2019–2026(USD MILLION)
6.5 FLOW CYTOMETRY
6.5.1 LACK OF STANDARDIZED PROTOCOLS IS A KEY RESTRAINT IN FLOW CYTOMETRY
TABLE 54 FLOW CYTOMETRY MARKET, BY REGION, 2019–2026 (USD MILLION)
TABLE 55 FLOW CYTOMETRY MARKET, BY PRODUCT, 2019–2026 (USD MILLION)
TABLE 56 FLOW CYTOMETRY MARKET, BY METHOD, 2019–2026 (USD MILLION)
TABLE 57 FLOW CYTOMETRY MARKET, BY PATHOGEN TYPE, 2019–2026 (USD MILLION)
TABLE 58 FLOW CYTOMETRY MARKET, BY TEST TYPE, 2019–2026 (USD MILLION)
TABLE 59 FLOW CYTOMETRY MARKET, BY END USER, 2019–2026(USD MILLION)
6.6 MICROFLUIDICS
6.6.1 RISING ADOPTION OF ADVANCED & RAPID TESTING TO DRIVE THE GROWTH OF THE MICROFLUIDICS SEGMENT
TABLE 60 MICROFLUIDICS MARKET, BY REGION, 2019–2026 (USD MILLION)
TABLE 61 MICROFLUIDICS MARKET, BY PRODUCT, 2019–2026 (USD MILLION)
TABLE 62 MICROFLUIDICS MARKET, BY METHOD, 2019–2026 (USD MILLION)
TABLE 63 MICROFLUIDICS MARKET, BY PATHOGEN TYPE, 2019–2026 (USD MILLION)
TABLE 64 MICROFLUIDICS MARKET, BY TEST TYPE, 2019–2026 (USD MILLION)
TABLE 65 MICROFLUIDICS MARKET, BY END USER, 2019–2026(USD MILLION)
6.7 BIOMARKERS
6.7.1 RESEARCH & DEVELOPMENT FOR THE DISCOVERY OF NOVEL BIOMARKERS TO DRIVE THE GROWTH OF THIS SEGMENT
TABLE 66 BIOMARKERS MARKET, BY REGION, 2019–2026 (USD MILLION)
TABLE 67 BIOMARKERS MARKET, BY PRODUCT, 2019–2026 (USD MILLION)
TABLE 68 BIOMARKERS MARKET, BY METHOD, 2019–2026 (USD MILLION)
TABLE 69 BIOMARKERS MARKET, BY PATHOGEN TYPE, 2019–2026 (USD MILLION)
TABLE 70 BIOMARKERS MARKET, BY TEST TYPE, 2019–2026 (USD MILLION)
TABLE 71 BIOMARKERS MARKET, BY END USER, 2019–2026(USD MILLION)
7 SEPSIS DIAGNOSTICS MARKET, BY PRODUCT (Page No. - 100)
7.1 INTRODUCTION
TABLE 72 GLOBAL SEPSIS DIAGNOSTICS INDUSTRY, BY PRODUCT, 2019–2026 (USD MILLION)
7.2 BLOOD CULTURE MEDIA
7.2.1 RISE IN BLOODSTREAM INFECTIONS TO DRIVE THE GROWTH OF BLOOD CULTURE MEDIA IN SEPSIS DIAGNOSIS
FIGURE 30 INCIDENCE OF BLOODSTREAM INFECTIONS BY AGE AND SEX, WESTERN INTERIOR OF BRITISH COLUMBIA AND CANADA, 2010–2019
TABLE 73 BLOOD CULTURE MEDIA MARKET, BY REGION, 2019–2026 (USD MILLION)
7.3 ASSAYS & REAGENT KITS
7.3.1 ASSAYS BETTER ENABLE THE ANALYSIS OF PATIENT SAMPLES FOR DISEASE DIAGNOSIS
TABLE 74 ASSAYS & REAGENT KITS MARKET, BY REGION, 2019–2026 (USD MILLION)
7.4 INSTRUMENTS
7.4.1 TRADITIONAL DIAGNOSTIC INSTRUMENTS ARE GRADUALLY BEING REPLACED BY AUTOMATED INSTRUMENTS
TABLE 75 INSTRUMENTS MARKET, BY REGION, 2019–2026 (USD MILLION)
7.5 SOFTWARE
7.5.1 RISING USE OF AUTOMATED INSTRUMENTS TO ENSURE THE GROWING DEMAND FOR SOFTWARE
TABLE 76 SOFTWARE MARKET, BY REGION, 2019–2026 (USD MILLION)
8 SEPSIS DIAGNOSTICS MARKET, BY METHOD (Page No. - 106)
8.1 INTRODUCTION
TABLE 77 GLOBAL SEPSIS DIAGNOSTICS INDUSTRY, BY METHOD, 2019–2026 (USD MILLION)
8.1.1 CONVENTIONAL DIAGNOSTICS
8.1.1.1 Higher adoption of conventional diagnostics owing to blood culture testing to drive the growth of this segment
TABLE 78 CONVENTIONAL DIAGNOSTICS MARKET, BY REGION, 2019–2026 (USD MILLION)
8.1.2 AUTOMATED DIAGNOSTICS
8.1.2.1 Accuracy & quick turnaround times to drive the adoption of automated diagnostics among medical professionals
TABLE 79 AUTOMATED DIAGNOSTICS MARKET, BY REGION, 2019–2026 (USD MILLION)
9 SEPSIS DIAGNOSTICS MARKET, BY PATHOGEN TYPE (Page No. - 110)
9.1 INTRODUCTION
TABLE 80 GLOBAL SEPSIS DIAGNOSTICS INDUSTRY, BY PATHOGEN TYPE, 2019–2026 (USD MILLION)
9.2 BACTERIAL SEPSIS
TABLE 81 BACTERIAL SEPSIS MARKET, BY TYPE, 2019–2026 (USD MILLION)
9.2.1 GRAM-NEGATIVE BACTERIAL SEPSIS
9.2.1.1 Increased proportion of sepsis infection caused by gram-negative bacteria
TABLE 82 GRAM-NEGATIVE BACTERIAL CAUSES IN ADULT SEPSIS
TABLE 83 GRAM-NEGATIVE BACTERIAL SEPSIS MARKET, BY REGION, 2019–2026 (USD MILLION)
9.2.2 GRAM-POSITIVE BACTERIAL SEPSIS
9.2.2.1 Cases of sepsis caused by gram-positive bacteria have risen in recent years
TABLE 84 GRAM-POSITIVE BACTERIAL CAUSES IN ADULT SEPSIS
TABLE 85 GRAM-POSITIVE BACTERIAL SEPSIS MARKET, BY REGION, 2019–2026 (USD MILLION)
9.3 FUNGAL SEPSIS
9.3.1 THE RISING INCIDENCE OF FUNGAL HAIS HAS INCREASED THE RISK OF SEPSIS DEVELOPMENT
TABLE 86 FUNGAL SEPSIS MARKET, BY REGION, 2019–2026 (USD MILLION)
9.4 VIRAL SEPSIS
9.4.1 VIRAL PATHOGEN A NEW CAUSATIVE AGENT OF SEPSIS
TABLE 87 VIRAL SEPSIS MARKET, BY REGION, 2019–2026 (USD MILLION)
9.5 OTHER PATHOGENS
TABLE 88 OTHER PATHOGENS MARKET, BY REGION, 2019–2026 (USD MILLION)
10 SEPSIS DIAGNOSTICS MARKET, BY TEST TYPE (Page No. - 117)
10.1 INTRODUCTION
TABLE 89 GLOBAL SEPSIS DIAGNOSTICS INDUSTRY, BY TEST TYPE, 2019–2026 (USD MILLION)
10.2 LABORATORY TESTS
10.2.1 LABORATORY TESTS ARE THE MOST COMMON AND PREFERRED MODE OF TESTING
TABLE 90 LABORATORY TEST MARKET FOR SEPSIS DIAGNOSTICS, BY REGION, 2019–2026(USD MILLION)
10.3 POINT-OF-CARE TESTS
10.3.1 RAPID POC TESTING DRIVES THE GROWTH OF THIS SEGMENT
TABLE 91 POC TESTS MARKET FOR SEPSIS DIAGNOSTICS, NY REGION, 2019–2026(USD MILLION)
11 SEPSIS DIAGNOSTICS MARKET, BY END USER (Page No. - 121)
11.1 INTRODUCTION
TABLE 92 SEPSIS DIAGNOSTICS INDUSTRY, BY END USER, 2019–2026(USD MILLION)
11.2 HOSPITALS AND SPECIALTY CLINICS
11.2.1 INCREASING ADOPTION OF SEPSIS DIAGNOSTIC PRODUCTS BY IN-HOUSE HOSPITAL LABS TO BOOST SEGMENT GROWTH
TABLE 93 MARKET FOR HOSPITALS AND SPECILAITY CLINICS, BY REGION, 2019–2026 (USD MILLION)
11.3 PATHOLOGY & REFERENCE LABORATORIES
11.3.1 INDEPENDENT LABORATORIES OFFER AFFORDABLE AND EFFICIENT DIAGNOSTIC SERVICES
TABLE 94 MARKET FOR PATHOLOGY & REFERENCE LABORATORIES, BY REGION, 2019–2026 (USD MILLION)
11.4 RESEARCH LABORATORIES AND ACADEMIC INSTITUTES
11.4.1 GOVERNMENT SUPPORT AND RISING AWARENESS FOR EARLY SEPSIS DETECTION DRIVES THE GROWTH OF THIS SEGMENT
TABLE 95 MARKET FOR RESEARCH LABORATORIES AND ACADEMIC INSTITUTES, BY REGION, 2019–2026 (USD MILLION)
12 SEPSIS DIAGNOSTICS MARKET, BY REGION (Page No. - 126)
12.1 INTRODUCTION
12.2 NORTH AMERICA
FIGURE 31 NORTH AMERICA: SEPSIS DIAGNOSTICS MARKET SNAPSHOT
TABLE 96 NORTH AMERICA: MARKET, BY TECHNOLOGY, 2019–2026 (USD MILLION)
TABLE 97 NORTH AMERICA: MARKET FOR MOLECULAR DIAGNOSTICS, BY TYPE, 2019–2026 (USD MILLION)
TABLE 98 NORTH AMERICA: MARKET, BY PRODUCT, 2019–2026 (USD MILLION)
TABLE 99 NORTH AMERICA: MARKET, BY METHOD, 2019–2026 (USD MILLION)
TABLE 100 NORTH AMERICA: MARKET, BY PATHOGEN TYPE, 2019–2026 (USD MILLION)
TABLE 101 NORTH AMERICA: MARKET, BY TEST TYPE, 2019–2026 (USD MILLION)
TABLE 102 NORTH AMERICA: MARKET, BY END USER, 2019–2026(USD MILLION)
12.2.1 US
12.2.1.1 Rising incidence of HIAS in us to accelerate the demand for sepsis diagnosis
TABLE 103 US: SEPSIS DIAGNOSTICS MARKET, BY TECHNOLOGY, 2019–2026 (USD MILLION)
TABLE 104 US: MARKET FOR MOLECULAR DIAGNOSTICS, BY TYPE, 2019–2026 (USD MILLION)
12.2.2 CANADA
12.2.2.1 The growing availability of sepsis diagnostic products is expected to drive market growth in Canada
TABLE 105 CANADA: SEPSIS DIAGNOSTICS MARKET, BY TECHNOLOGY, 2019–2026 (USD MILLION)
TABLE 106 CANADA: MARKET FOR MOLECULAR DIAGNOSTICS, BY TYPE, 2019–2026 (USD MILLION)
12.3 EUROPE
TABLE 107 EUROPE: MARKET, BY TECHNOLOGY, 2019–2026 (USD MILLION)
TABLE 108 EUROPE: MARKET FOR MOLECULAR DIAGNOSTICS, BY TYPE, 2019–2026 (USD MILLION)
TABLE 109 EUROPE: MARKET, BY PRODUCT, 2019–2026 (USD MILLION)
TABLE 110 EUROPE: MARKET, BY METHOD, 2019–2026 (USD MILLION)
TABLE 111 EUROPE: MARKET, BY PATHOGEN TYPE, 2019–2026 (USD MILLION)
TABLE 112 EUROPE: MARKET, BY TEST TYPE, 2019–2026 (USD MILLION)
TABLE 113 EUROPE: SEPSIS DIAGNOSTICS INDUSTRY, BY END USER, 2019–2026(USD MILLION)
12.3.1 GERMANY
12.3.1.1 Growing awareness and the adoption of technologically advanced diagnostics products in Germany to drive the market growth
TABLE 114 GERMANY: SEPSIS DIAGNOSTICS MARKET, BY TECHNOLOGY, 2019–2026 (USD MILLION)
TABLE 115 GERMANY: SEPSIS DAIGNOSTICS MARKET FOR MOLECULAR DIAGNOSTICS, BY TYPE, 2019–2026 (USD MILLION)
12.3.2 UK
12.3.2.1 Government support and rising awareness for the early diagnosis of sepsis are the key factors driving market growth in the UK
TABLE 116 UK: MARKET, BY TECHNOLOGY, 2019–2026 (USD MILLION)
TABLE 117 UK: MARKET FOR MOLECULAR DIAGNOSTICS, BY TYPE, 2019–2026 (USD MILLION)
12.3.3 FRANCE
12.3.3.1 The high incidence of sepsis in France has supported the demand for sepsis diagnostic products
TABLE 118 FRANCE: SEPSIS DIAGNOSTICS MARKET, BY TECHNOLOGY, 2019–2026 (USD MILLION)
TABLE 119 FRANCE: MARKET FOR MOLECULAR DIAGNOSTICS, BY TYPE, 2019–2026 (USD MILLION)
12.3.4 ITALY
12.3.4.1 Limited growth in the healthcare sector to restrain the market growth for sepsis diagnostics in Italy
TABLE 120 ITALY: SEPSIS DIAGNOSTICS MARKET, BY TECHNOLOGY, 2019–2026 (USD MILLION)
TABLE 121 ITALY: MARKET FOR MOLECULAR DIAGNOSTICS, BY TYPE, 2019–2026 (USD MILLION)
12.3.5 SPAIN
12.3.5.1 Rising awareness for the early diagnosis of sepsis to drive the market growth in Spain
TABLE 122 SPAIN: SEPSIS DIAGNOSTICS MARKET, BY TECHNOLOGY, 2019–2026 (USD MILLION)
TABLE 123 SPAIN: MARKET FOR MOLECULAR DIAGNOSTICS, BY TYPE, 2019–2026 (USD MILLION)
12.3.6 REST OF EUROPE
TABLE 124 REST OF EUROPE: SEPSIS DIAGNOSTICS INDUSTRY, BY TECHNOLOGY, 2019–2026 (USD MILLION)
TABLE 125 REST OF EUROPE: MARKET FOR MOLECULAR DIAGNOSTICS, BY TYPE, 2019–2026 (USD MILLION)
12.4 ASIA PACIFIC
TABLE 126 ASIA PACIFIC: SEPSIS DIAGNOSTICS MARKET, BY TECHNOLOGY, 2019–2026 (USD MILLION)
TABLE 127 ASIA PACIFIC: SEPSIS DAIGNOSTICS MARKET FOR MOLECULAR DIAGNOSTICS, BY TYPE, 2019–2026 (USD MILLION)
TABLE 128 ASIA PACIFIC: MARKET, BY PRODUCT, 2019–2026 (USD MILLION)
TABLE 129 ASIA PACIFIC: MARKET, BY METHOD, 2019–2026 (USD MILLION)
TABLE 130 ASIA PACIFIC: MARKET, BY PATHOGEN TYPE, 2019–2026 (USD MILLION)
TABLE 131 ASIA PACIFIC: MARKET, BY TEST TYPE, 2019–2026 (USD MILLION)
TABLE 132 ASIA PACIFIC: MARKET, BY END USER, 2019–2026(USD MILLION)
12.4.1 JAPAN
12.4.1.1 Rising incidence of pneumonia and infectious diseases to support the market growth in Japan
TABLE 133 JAPAN: SEPSIS DIAGNOSTICS MARKET, BY TECHNOLOGY, 2019–2026 (USD MILLION)
TABLE 134 JAPAN: MARKET FOR MOLECULAR DIAGNOSTICS, BY TYPE, 2019–2026 (USD MILLION)
12.4.2 CHINA
12.4.2.1 Healthcare infrastructure improvements to support the market growth for sepsis diagnostics in China
TABLE 135 CHINA: MARKET, BY TECHNOLOGY, 2019–2026 (USD MILLION)
TABLE 136 CHINA: MARKET FOR MOLECULAR DIAGNOSTICS, BY TYPE, 2019–2026 (USD MILLION)
12.4.3 INDIA
12.4.3.1 Increasing patient population and the rising number of surgical procedures to drive the market growth in India
TABLE 137 INDIA: SEPSIS DIAGNOSTICS MARKET, BY TECHNOLOGY, 2019–2026 (USD MILLION)
TABLE 138 INDIA: MARKET FOR MOLECULAR DIAGNOSTICS, BY TYPE, 2019–2026 (USD MILLION)
12.4.4 AUSTRALIA
12.4.4.1 The increasing number of sepsis treatment procedures indicates growth potential for the market in Australia
TABLE 139 AUSTRALIA: SEPSIS DIAGNOSTICS INDUSTRY, BY TECHNOLOGY, 2019–2026 (USD MILLION)
TABLE 140 AUSTRALIA: SEPSIS DAIGNOSTICS MARKET FOR MOLECULAR DIAGNOSTICS, BY TYPE, 2019–2026 (USD MILLION)
12.4.5 SOUTH KOREA
12.4.5.1 Rising healthcare spending to support the market growth in South Korea
TABLE 141 SOUTH KOREA: SEPSIS DIAGNOSTICS MARKET, BY TECHNOLOGY, 2019–2026 (USD MILLION)
TABLE 142 SOUTH KOREA: SEPSIS DAIGNOSTICS MARKET FOR MOLECULAR DIAGNOSTICS, BY TYPE, 2019–2026 (USD MILLION)
12.4.6 THE REST OF ASIA PACIFIC (ROAPAC)
TABLE 143 ROAPAC: SEPSIS DIAGNOSTICS MARKET, BY TECHNOLOGY, 2019–2026 (USD MILLION)
TABLE 144 ROAPAC: SEPSIS DAIGNOSTICS MARKET FOR MOLECULAR DIAGNOSTICS, BY TYPE, 2019–2026 (USD MILLION)
12.5 LATIN AMERICA
TABLE 145 LATIN AMERICA: MARKET, BY TECHNOLOGY, 2019–2026 (USD MILLION)
TABLE 146 LATIN AMERICA: MARKET FOR MOLECULAR DIAGNOSTICS, BY TYPE, 2019–2026 (USD MILLION)
TABLE 147 LATIN AMERICA: SEPSIS DIAGNOSTICS MARKET, BY PRODUCT, 2019–2026 (USD MILLION)
TABLE 148 LATIN AMERICA: MARKET, BY METHOD, 2019–2026 (USD MILLION)
TABLE 149 LATIN AMERICA: MARKET, BY PATHOGEN TYPE, 2019–2026 (USD MILLION)
TABLE 150 LATIN AMERICA: MARKET, BY TEST TYPE, 2019–2026 (USD MILLION)
TABLE 151 LATIN AMERICA: MARKET, BY END USER, 2019–2026(USD MILLION)
12.5.1 BRAZIL
12.5.1.1 Brazil accounted for the largest share of the LATAM market in 2020 owing to the ongoing investments by manufacturers in the country
TABLE 152 BRAZIL: SEPSIS DIAGNOSTICS MARKET, BY TECHNOLOGY, 2019–2026 (USD MILLION)
TABLE 153 BRAZIL: MARKET FOR MOLECULAR DIAGNOSTICS, BY TYPE, 2019–2026 (USD MILLION)
12.5.2 MEXICO
12.5.2.1 Rising medical tourism to support the market growth in Mexico
TABLE 154 MEXICO: MARKET, BY TECHNOLOGY, 2019–2026 (USD MILLION)
TABLE 155 MEXICO: SEPSIS DAIGNOSTICS MARKET FOR MOLECULAR DIAGNOSTICS, BY TYPE, 2019–2026 (USD MILLION)
12.5.3 THE REST OF LATIN AMERICA (ROLATAM)
TABLE 156 ROLATAM: SEPSIS DIAGNOSTICS MARKET, BY TECHNOLOGY, 2019–2026 (USD MILLION)
TABLE 157 ROLATAM: SEPSIS DAIGNOSTICS MARKET FOR MOLECULAR DIAGNOSTICS, BY TYPE, 2019–2026 (USD MILLION)
12.6 MIDDLE EAST & AFRICA
12.6.1 HIGH CONSUMPTION OF IMMUNE SYSTEM-SUPPRESSING MEDICATIONS DRIVES SEPSIS OCCURRENCE IN THE MEA REGION
TABLE 158 MIDDLE EAST & AFRICA: SEPSIS DIAGNOSTICS MARKET, BY TECHNOLOGY, 2019–2026 (USD MILLION)
TABLE 159 MIDDLE EAST & AFRICA: SEPSIS DAIGNOSTICS MARKET FOR MOLECULAR DIAGNOSTICS, BY TYPE, 2019–2026 (USD MILLION)
TABLE 160 MIDDLE EAST & AFRICA: MARKET, BY PRODUCT, 2019–2026 (USD MILLION)
TABLE 161 MIDDLE EAST & AFRICA: MARKET, BY METHOD, 2019–2026 (USD MILLION)
TABLE 162 MIDDLE EAST & AFRICA: MARKET, BY PATHOGEN TYPE, 2019–2026 (USD MILLION)
TABLE 163 MIDDLE EAST & AFRICA: MARKET, BY TEST TYPE, 2019–2026 (USD MILLION)
TABLE 164 MIDDLE EAST & AFRICA: SEPSIS DIAGNOSTICS INDUSTRY, BY END USER, 2019–2026(USD MILLION)
13 COMPETITIVE LANDSCAPE (Page No. - 168)
13.1 OVERVIEW
13.2 KEY PLAYER STRATEGIES
13.3 REVENUE SHARE ANALYSIS OF THE TOP MARKET PLAYERS
13.4 MARKET SHARE ANALYSIS (2020)
TABLE 165 SEPSIS DIAGNOSTICS MARKET: DEGREE OF COMPETITION
13.5 COMPETITIVE LEADERSHIP MAPPING
13.5.1 STARS
13.5.2 PERVASIVE PLAYERS
13.5.3 EMERGING LEADERS
13.5.4 PARTICIPANTS
FIGURE 33 GLOBAL MARKET: COMPETITIVE LEADERSHIP MAPPING, 2020
13.6 COMPETITIVE LEADERSHIP MAPPING FOR START-UPS/SMES (2020)
13.6.1 PROGRESSIVE COMPANIES
13.6.2 STARTING BLOCKS
13.6.3 RESPONSIVE COMPANIES
13.6.4 DYNAMIC COMPANIES
FIGURE 34 GLOBAL SEPSIS DIAGNOSTICS INDUSTRY: COMPETITIVE LEADERSHIP MAPPING FOR START-UPS/SMES, 2020
13.7 FOOTPRINT ANALYSIS OF THE TOP PLAYERS IN THE GLOBAL MARKET
TABLE 166 PRODUCT AND REGIONAL FOOTPRINT ANALYSIS OF THE TOP PLAYERS IN THE GLOBAL MARKET
TABLE 167 PRODUCT FOOTPRINT OF COMPANIES
TABLE 168 REGIONAL FOOTPRINT OF COMPANIES
13.8 COMPETITIVE SCENARIO
13.8.1 GLOBAL MARKET: PRODUCT LAUNCHES AND REGULATORY APPROVALS
TABLE 169 KEY PRODUCT LAUNCHES AND REGULATORY APPROVALS, JANUARY 2018–DECEMBER 2021
13.8.2 GLOBAL SEPSIS DIAGNOSTICS INDUSTRY: DEALS
TABLE 170 KEY DEALS, JANUARY 2018–DECEMBER 2021
13.8.3 SEPSIS DIAGNOSTICS INDUSTRY: OTHER DEVELOPMENTS
TABLE 171 OTHER KEY DEVELOPMENTS, JANUARY 2018–DECEMBER 2021
14 COMPANY PROFILES (Page No. - 181)
(Business Overview, Products Offered, Recent Developments, and MnM View (Key strengths/Right to Win, Strategic Choices Made, and Weaknesses and Competitive Threats))*
14.1 BIOMÉRIEUX
TABLE 172 BIOMÉRIEUX.: BUSINESS OVERVIEW
FIGURE 35 BIOMÉRIEUX: COMPANY SNAPSHOT (2020)
TABLE 173 BIOMÉRIEUX.: PRODUCT OFFERINGS
14.2 BECTON, DICKINSON, AND COMPANY
TABLE 174 BECTON, DICKINSON, AND COMPANY: BUSINESS OVERVIEW
FIGURE 36 BECTON, DICKINSON, AND COMPANY: COMPANY SNAPSHOT (2020)
TABLE 175 BECTON, DICKINSON AND COMPANY: PRODUCT OFFERINGS
14.3 DANAHER CORPORATION
TABLE 176 DANAHER CORPORATION: BUSINESS OVERVIEW
FIGURE 37 DANAHER CORPORATION: COMPANY SNAPSHOT (2020)
TABLE 177 DANAHER CORPORATION: PRODUCT OFFERINGS
14.4 T2 BIOSYSTEMS
TABLE 178 T2 BIOSYSTEMS: BUSINESS OVERVIEW
FIGURE 38 T2 BIOSYSTEMS: COMPANY SNAPSHOT (2020)
TABLE 179 T2 BIOSYSTEMS: PRODUCT OFFERINGS
14.5 LUMINEX
TABLE 180 LUMINEX: BUSINESS OVERVIEW
FIGURE 39 LUMINEX: COMPANY SNAPSHOT (2020)
TABLE 181 LUMINEX: PRODUCT OFFERINGS
14.6 F. HOFFMANN-LA ROCHE AG
TABLE 182 F. HOFFMANN-LA ROCHE AG: BUSINESS OVERVIEW
FIGURE 40 F. HOFFMANN-LA ROCHE AG: COMPANY SNAPSHOT (2020)
TABLE 183 F. HOFFMANN-LA ROCHE AG: PRODUCT OFFERINGS
14.7 THERMO FISHER SCIENTIFIC
TABLE 184 THERMO FISHER SCIENTIFIC: BUSINESS OVERVIEW
FIGURE 41 THERMO FISHER SCIENTIFIC: COMPANY SNAPSHOT (2020)
TABLE 185 THERMO FISHER SCIENTIFIC: PRODUCT OFFERINGS
14.8 BRUKER CORPORATION
TABLE 186 BRUKER CORPORATION: BUSINESS OVERVIEW
FIGURE 42 BRUKER CORPORATION: COMPANY SNAPSHOT (2020)
TABLE 187 BRUKER CORPORATION: PRODUCT OFFERINGS
14.9 ABBOTT LABORATORIES
TABLE 188 ABBOTT LABORATORIES: BUSINESS OVERVIEW
FIGURE 43 ABBOTT LABORATORIES: COMPANY SNAPSHOT (2020)
TABLE 189 ABBOTT LABORATORIES: PRODUCT OFFERINGS
14.10 QUIDEL CORPORATION
TABLE 190 QUIDEL CORPORATION: BUSINESS OVERVIEW
FIGURE 44 QUIDEL CORPORATION: COMPANY SNAPSHOT (2020)
TABLE 191 QUIDEL CORPORATION: PRODUCT OFFERINGS
14.11 SIEMENS HEALTHINEERS
TABLE 192 SIEMENS HEALTHINEERS: BUSINESS OVERVIEW
FIGURE 45 SIEMENS HEALTHINEERS: COMPANY SNAPSHOT (2020)
TABLE 193 SIEMENS HEALTHINEERS: PRODUCT OFFERINGS
14.12 EKF DIAGNOSTICS
TABLE 194 EKF DIAGNOSTICS: BUSINESS OVERVIEW
FIGURE 46 EKF DIAGNOSTICS: COMPANY SNAPSHOT (2020)
TABLE 195 EKF DIAGNOSTICS: PRODUCT OFFERINGS
14.13 SYSMEX CORPORATION
TABLE 196 SYSMEX CORPORATION: BUSINESS OVERVIEW
FIGURE 47 SYSMEX CORPORATION: COMPANY SNAPSHOT (2020)
TABLE 197 SYSMEX CORPORATION: PRODUCT OFFERINGS
14.14 SEEGENE, INC.
TABLE 198 SEEGENE, INC.: BUSINESS OVERVIEW
TABLE 199 SEEGENE, INC: PRODUCT OFFERINGS
14.15 RESPONSE BIOMEDICAL CORP.
TABLE 200 RESPONSE BIOMEDICAL CORP.: BUSINESS OVERVIEW
TABLE 201 RESPONSE BIOMEDICAL CORP.: PRODUCT OFFERINGS
14.16 OTHER COMPANIES
14.16.1 ALIFAX S.R.L.
14.16.2 BODITECH MED INC.
14.16.3 ADVANDX
14.16.4 IMMUNEXPRESS INC.
14.16.5 AXIS-SHIELD DIAGNOSTICS
*Details on Business Overview, Products Offered, Recent Developments, and MnM View (Key strengths/Right to Win, Strategic Choices Made, and Weaknesses and Competitive Threats) might not be captured in case of unlisted companies.
15 APPENDIX (Page No. - 228)
15.1 DISCUSSION GUIDE
15.2 KNOWLEDGE STORE: MARKETSANDMARKETS’ SUBSCRIPTION PORTAL
15.3 AVAILABLE CUSTOMIZATIONS
15.4 RELATED REPORTS
15.5 AUTHOR DETAILS
The study involved four major activities in estimating the current size of the sepsis diagnostics market. Exhaustive secondary research was conducted to collect information on the market and its different subsegments. The next step was to validate these findings, assumptions, and sizing with industry experts across the value chain through primary research. Both top-down and bottom-up approaches were employed to estimate the total market size. After that, market breakdown and data triangulation were used to estimate the market size of segments and subsegments.
Secondary Research
In the secondary research process, various secondary sources such as annual reports, press releases & investor presentations of companies, white papers, certified publications, Infectious Disease Society of America (IDSA), Society for Healthcare Epidemiology of America (SHEA), Society of Critical Care Medicine (SCCM), European Society of Emergency Medicine (EUSEM), articles by recognized authors, gold-standard & silver-standard websites, regulatory bodies, and databases (such as D&B Hoovers, Bloomberg Businessweek, and Factiva) were referred to identify and collect information for this study.
Primary Research
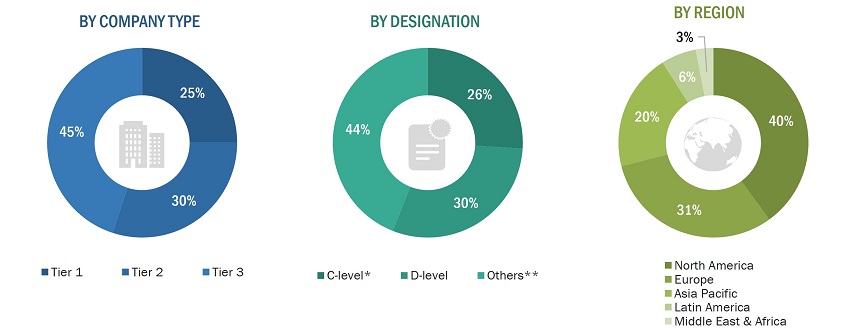
The sepsis diagnostics market comprises several stakeholders such as original equipment manufacturers (OEMs), product distributors and channel partners, hospitals, commercial laboratories, and surgical centers, diagnostic laboratories, contract manufacturers and third-party suppliers, research laboratories and academic institutes, government and non-governmental regulatory authorities, and market research and consulting firms. Various primary sources from both the supply and demand sides of the market were interviewed to obtain qualitative and quantitative information. The following is a breakdown of the primary respondents:
To know about the assumptions considered for the study, download the pdf brochure
Market Size Estimation
A detailed market estimation approach was followed to estimate and validate the value of the sepsis diagnostics market and other dependent submarkets, as mentioned below.
- Key players in the global market were identified through secondary research, and their global market shares were determined through primary and secondary research.
- The research methodology included the study of the annual and quarterly financial reports & regulatory filings of significant market players as well as interviews with industry experts for detailed market insights.
- All percentage shares, splits, and breakdowns for the global market were determined using secondary sources and verified through primary sources.
- All key macro indicators affecting the revenue growth of market segments and subsegments have been accounted for, viewed in extensive detail, verified through primary research, and analyzed to get the validated and verified quantitative & qualitative data.
- The gathered market data was consolidated and added to detailed inputs, analyzed, and presented in this report.
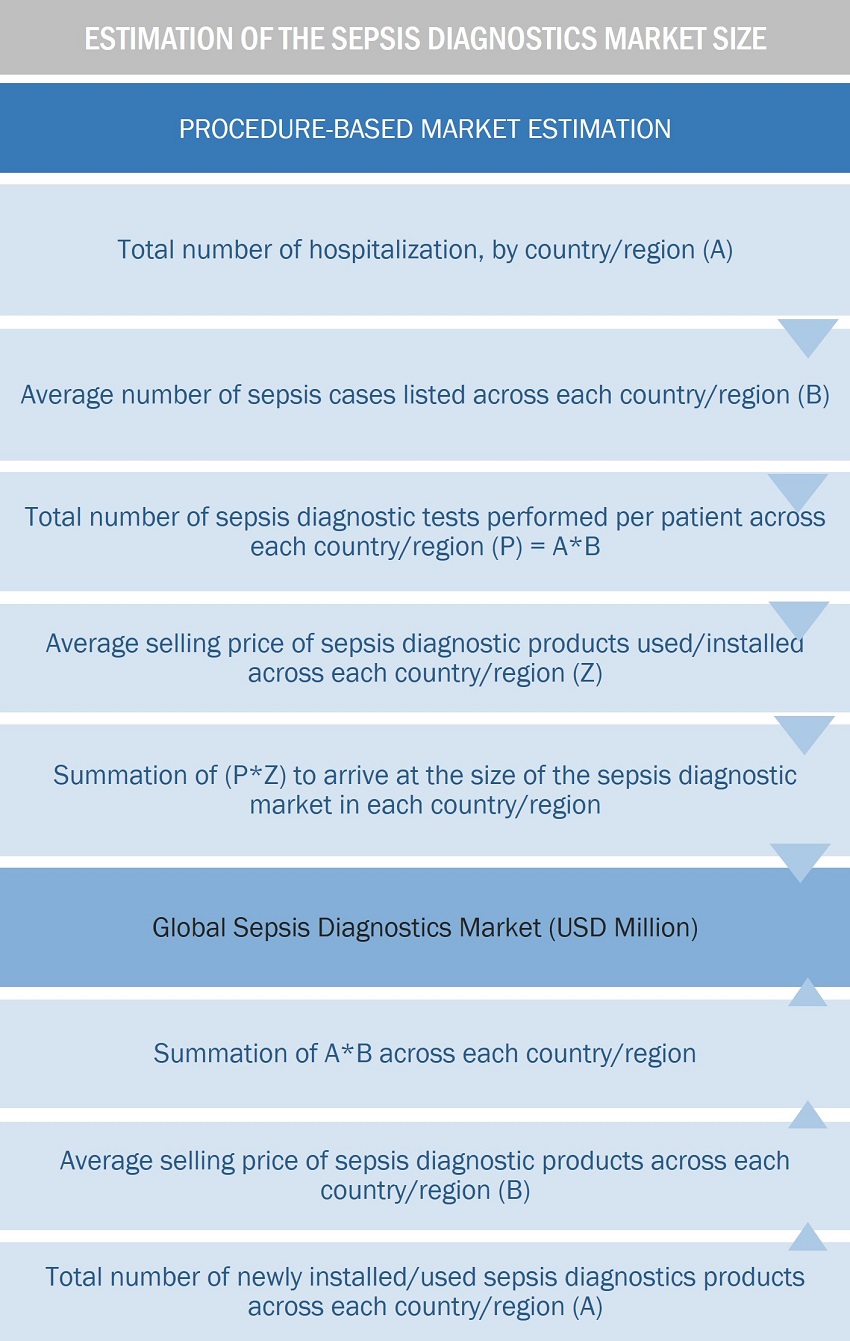
Market Size Estimation: Based On Procedure Methodology
To know about the assumptions considered for the study, Request for Free Sample Report
Market Size Estimation: Based on Procedure Methodology
Data Triangulation
After arriving at the overall market size of the global sepsis diagnostics market through the methodology mentioned above, this market was split into several segments and subsegments. The data triangulation and market breakdown procedures were employed, wherever applicable, to complete the overall market engineering process and arrive at the exact market value data for critical segments and subsegments. The extrapolated market data was triangulated by studying various macro indicators and regional trends from both the demand- and supply-side participants.
Report Objectives
- To define, describe, and forecast the sepsis diagnostics market based on technology, product, method, pathogen, test type, end user and region
- To provide detailed information on the major factors influencing the market growth (such as drivers, restraints, opportunities, and industry-specific challenges)
- To strategically analyze micro markets with respect to individual growth trends, prospects, and their contributions to the overall market
- To analyze market opportunities for stakeholders and provide details of the competitive landscape for key players
- To forecast the market value of various segments and subsegments for five regions—North America, Europe, the Asia Pacific, Latin America, and the Middle East & Africa
- To profile the key players in the sepsis diagnostics market and comprehensively analyze their global revenue shares and core competencies
- To track and analyze competitive market-specific developments such as product launches/approvals and enhancements; partnerships, collaborations, agreements; expansions; and acquisitions
Available Customizations
With the given market data, MarketsandMarkets offers customizations as per your company’s specific needs. The following customization options are available for the global sepsis diagnostics market report
Product Analysis
- Product Matrix, which gives a detailed comparison of the product portfolios of the top five global players.
Company Information
- Detailed analysis and profiling of additional market players (up to 5 OEMs)
Geographic Analysis
- Further breakdown of the Rest of Europe market into Belgium, Austria,
- Denmark, Greece,s Poland, and Russia, among other countries
- Further breakdown of the Rest of Asia Pacific market into New Zealand, Vietnam, Philippines, Singapore, Malaysia, Thailand, and Indonesia, among other countries
- Further breakdown of the Rest of Latin America market into Argentina, and Colombia, among other countries.
Growth opportunities and latent adjacency in Sepsis Diagnostics Market
Have you not heard of T2 Biosystems rapid diagnostics direct from blood? Much faster than blood cultures, which is vital considering how quickly sepsis kills. FDA and CMS labeled it "breakthrough technology" and CMS subsidizes the test at 65, $97.
What are the after-effects of the COVID19 on the Global Sepsis Diagnostics Industry?
What are the upcoming trends in the Global Sepsis Diagnostics Industry?