Microfluidics Market by Product (Chip, Sensor, Valve, Pump, Needle), Material (Silicon, Polymer), Application [Diagnostics (Clinical, PoC), Research (Proteomics, Genomics, Cell), Therapeutics (Drug Delivery Wearables)], End User – Global forecast to 2030

icon1
USD 37.2 BN
MARKET SIZE, 2030
icon2
CAGR 8.3%
(2025-2030)
icon3
260+
REPORT PAGES
icon4
254
MARKET TABLES

OVERVIEW

Microfluidics Market Overview

Source: Secondary Research, Interviews with Experts, MarketsandMarkets Analysis

The global Microfluidics market, valued at US$23.71 billion in 2024, stood at US$24.96 billion in 2025 and is projected to advance at a resilient CAGR of 8.3% from 2025 to 2030, culminating in a forecasted valuation of US$37.19 billion by the end of the period. Several significant factors are driving the growth of the microfluidics market, thereby enhancing its expansion and applications. There is a growing demand for point-of-care diagnostics, which require fast, accurate, and cost-effective instruments. Moreover, the trend toward personalized medicine raises the requirement for precise biomarker analysis and high-throughput screening. An increase in research & development expenditure supports the research and investigation of novel and innovative technologies, which in turn supports market growth.

KEY TAKEAWAYS

  • By Region
    North America accounted for the largest share of the global microfluidics market with a share of 40.6% in 2024.
  • By Product
    In 2024, the microfluidics-based devices segment accounted for the largest market share of 70.5%.
  • By Application
    By application, the in vitro diagnostics segment is expected to dominate the overall market.
  • By End User
    By end user, the hospitals and diagnostic centers segment is projected to register the highest growth during the forecast period.
  • COMPETITIVE LANDSCAPE- KEY PLAYERS
    Thermo Fisher Scientific, Illumina Inc., and Bio-Rad Laboratories Inc. are identified as key players in the microfluidics market, given their strong market share and extensive product footprint.
  • COMPETITIVE LANDSCAPE- OTHER PLAYERS
    QuidelOrtho Corporation, Hologic, Inc., and Aignep s.p.a. have distinguished themselves among startups and SMEs by securing strong footholds in specialized niche areas, underscoring their potential as emerging market leaders.

Several significant reasons are driving the growth of the microfluidics market. There is a rising demand for point-of-care diagnostics, which require fast, accurate, and cost-efficient instruments. Moreover, the trend toward personalized medicine raises the requirement for precise biomarker analysis and high-throughput screening. An increase in research & development expenditure supports the research and investigation of novel and innovative technologies, which in turn supports market growth.

TRENDS & DISRUPTIONS IMPACTING CUSTOMERS' CUSTOMERS

The microfluidics market is being reshaped by the convergence of miniaturization, automation, and digital integration across healthcare and research applications. Hospitals, academic institutions, and pharmaceutical companies are increasingly adopting microfluidic technologies for rapid diagnostics, precise drug discovery, and advanced cell-based studies. These systems enable faster results using minimal samples and reagents, thereby improving cost efficiency and laboratory sustainability. The shift toward portable and point-of-care testing is further disrupting traditional laboratory workflows, allowing quicker clinical decisions and broader access to diagnostics. Collectively, these advancements are enhancing research productivity, accelerating therapeutic innovation, and driving the evolution of a more connected, data-driven healthcare ecosystem.

Microfluidics Market Disruptions

Source: Secondary Research, Interviews with Experts, MarketsandMarkets Analysis

MARKET DYNAMICS

Drivers
Impact
Level
  • Growing requirement for point-of-care testing
  • Increasing focus on data precision and accuracy
RESTRAINTS
Impact
Level
  • Stringent regulatory approval process
  • Integration of microfluidics into the current workflow
OPPORTUNITIES
Impact
Level
  • Emergence of 3D cell culture systems
  • Growth potential of emerging economies
CHALLENGES
Impact
Level
  • Low adoption of microfluidic devices among end users

Source: Secondary Research, Interviews with Experts, MarketsandMarkets Analysis

Driver: Rising technological advancements

Technological advancements in microfluidic components aim to make healthcare industry operational processes more reliable. These technological advancements have increased the throughput of device production, improved rapid prototyping efforts, and enabled researchers to enhance the complexity and sophistication of experiments that can be performed on a microfluidic chip. With technological advancements, microfluidic components are rapidly becoming a key technology in an expanding range of fields, including medical sciences, pharmaceuticals, biosensing, bioactuation, and chemical synthesis. This indicates the transition of microfluidics from a promising R&D tool to being utilized in data collection with AI during clinical trials. Lab-on-a-chip technology is a powerful platform for constructing and implementing AI in a large-scale, cost-effective, high-throughput, automated, and multiplexed manner. 3D printing has significantly transformed the field of microfluidics, enabling the creation of innovative devices that are often unattainable with traditional methods. A research team led by Imperial College London (UK) pioneered a 3D-printed wearable microfluidic device, which integrates FDA-approved clinical microdialysis probes and needle-type biosensors to continuously monitor metabolite levels in human tissues. Organ-on-a-Chip systems are microfluidic devices designed to replicate an intricate physiological environment for culturing and controlling cells within a 2D or 3D structure that mimics a specific organ in the body. Paper-based microfluidics focuses on devices constructed from paper or other porous materials that transport fluids through capillary action. The continual evolution of new materials and fabrication methods is expanding the potential applications of microfluidics, driving ongoing growth and innovation in the market.

Restraint: Integration of microfluidics into the current workflow

End users face various technical issues while incorporating microfluidic devices into existing workflows. Owing to this, the adoption of microfluidics into regularized drug screening and drug discovery processes is limited. Currently, microfluidics technology presents significant opportunities for the further miniaturization and integration of instruments and exhibits the potential for greater automation and cost reduction in drug discovery and development processes. However, as per a few industry experts in the market, although microfluidics adds value to the process and instruments, it will likely take about 10 to 15 years before this technology completely replaces conventional macro-scale research instrumentation. Until such a scenario presents itself, the market will witness irregular installments of microfluidic devices, owing to which conventional technology providers will sideline manufacturers to some extent.

Opportunity: Emergence of 3D cell culture systems

The organ-on-a-chip (OoC) represents a fascinating advancement in science and technology, combining biological systems with microtechnology to replicate essential features of human physiology. This device is a microfluidic system equipped with intricate networks of ultra-fine microchannels designed to control and manipulate minimal volumes of fluids, ranging from picoliters to milliliters. Recent advances in microfluidics for 3D cell culture have enabled the development of microenvironments that support tissue differentiation and replicate the tissue-tissue interface, spatiotemporal chemical gradients, and mechanical microenvironments of living organs. Organs-on-chips (OoCs) feature engineered or natural miniature tissues cultivated within microfluidic chips. These chips are designed to replicate human physiology by controlling cellular microenvironments and preserving tissue-specific functions. By integrating advancements in tissue engineering and microfabrication, OoCs have emerged as a cutting-edge experimental platform for exploring human pathophysiology and assessing the impact of therapeutics within the body. Given its potential, several research studies are being conducted to evaluate the performance of microfluidic chips in pharmaceutical studies. There are different types of organ-on-a-chip systems, such as lung-on-a-chip, liver-on-a-chip, heart-on-a-chip, brain-on-a-chip, and gut-on-a-chip models. A group of researchers developed U-IMPACT, a 3D microfluidic cell culture platform, a 96-well microfluidic platform engineered for culturing cells and spheroids, facilitating research on tumor microenvironments and neural cell development. Another team developed a hydrogel-based microfluidic cell culture platform, which enables the assessment of drug diffusion and efficacy, including for drugs such as temozolomide and carmustine, by producing dose-response curves and replicating the glioblastoma microenvironment for in vitro experimentation. The increasing applications of microfluidics in 3D cell culture will offer an array of opportunities for the growth of the microfluidics market.

Challenge: Low adoption of microfluidic devices among end users

Customer acceptance and market adoption are the two key factors that affect the commercialization of any product or technology in the market. There are academic publications providing proof of concept for microfluidic technology-embedded medical devices and equipment. Still, the incorporation of this technology in end-use products has been limited due to inadequate standards of microfluidic devices. The high costs associated with developing and producing microfluidic devices create financial hurdles, making them less accessible to smaller labs or organizations. The intricate design and manufacturing processes demand specialized knowledge and expertise, which can deter users from using the necessary resources. Additionally, a lack of awareness and understanding of the advantages and functions of microfluidic technology contributes to its slow adoption. Finally, concerns about the reliability and performance of these devices may lead users to hesitate, especially if the technology appears untested or more complicated than traditional methods. The limited adoption of microfluidic devices is owing to the development costs, complex manufacturing, regulatory challenges, integration difficulties, insufficient awareness, performance concerns, and the high cost of adoption for many users.

MICROFLUIDICS MARKET SIZE, GROWTH, SHARE & TRENDS ANALYSIS: COMMERCIAL USE CASES ACROSS INDUSTRIES

COMPANY USE CASE DESCRIPTION BENEFITS
The QuantStudio Absolute Q Digital PCR System leverages Microfluidic Array Plate (MAP) technology to deliver precise partitioning and analysis in a single, integrated workflow. Streamlined digital PCR with higher accuracy, reproducibility, and ease of use | Reduced hands-on time and error rates through automated background correction and false-positive rejection
It introduced the JSY3000-L/P valve manifold series with up to 64 stations for centralized control of solenoid valves and electro-pneumatic regulators. Simplified control architecture with reduced wiring and assembly time, saving up to 28% space | Enhanced reliability through IP65/IP67 protection and remote diagnostics for higher uptime and easier maintenance
It launched the Illumina Complete Long Read technology, enabling both long- and short-read sequencing on a single NovaSeq X Series platform. Simplified sequencing workflow with high precision (F1 score 99.87%), reduced cost, and minimal sample requirements
It enabled rapid, decentralized diagnostics with high accuracy and minimal hands-on time. It improved antibiotic stewardship and patient management by providing targeted results at the point of care. Enabled rapid, decentralized diagnostics with high accuracy and minimal hands-on time

Logos and trademarks shown above are the property of their respective owners. Their use here is for informational and illustrative purposes only.

MARKET ECOSYSTEM

The microfluidics market brings together a wide network of innovators—from manufacturers and researchers to distributors and end users—all working to transform diagnostics and analytical testing. Manufacturers develop and refine instruments, chips, and consumables, often partnering with contract developers and production specialists to scale new technologies efficiently. Research and product development are powered by academic labs, CROs, and in-house R&D teams that explore new applications, optimize designs, and push performance boundaries. Distributors, including third-party suppliers and online platforms, play a key role in connecting these innovations to global customers quickly and effectively. On the demand side, hospitals, diagnostic labs, and pharmaceutical and biotech companies rely on microfluidic systems for rapid testing, precision analysis, and drug discovery. Supporting this ecosystem are investors, funding agencies, and regulatory bodies that ensure quality, guide innovation, and help shape market direction. Together, they form a dynamic environment that continues to drive the evolution of microfluidic technologies.

Microfluidics Market Ecosystem

Logos and trademarks shown above are the property of their respective owners. Their use here is for informational and illustrative purposes only.

MARKET SEGMENTS

Microfluidics Market Segments

Source: Secondary Research, Interviews with Experts, MarketsandMarkets Analysis

Microfluidics Market, By Product

Based on product, the microfluidics market is segmented into microfluidics-based devices and microfluidic components. Microfluidics-based devices are advanced instruments that can regulate and analyze small volumes of fluids. They accurately manage fluid flow by etching or molding micro-scale channels and chambers into substrates. These devices are also used in organ-on-a-chip (OOC) platforms, which replicate human organ functions to aid in drug testing and disease-related research, as well as lab-on-a-chip (LoC) systems that combine multiple laboratory procedures into a single chip. These devices also include assays and microfluidic sensors that offer precise detection of pathogens, biomolecules, and other chemical compounds.

Microfluidics Market, By Application

In vitro diagnostics (IVD) have the ability to accurately regulate and analyze minute fluid volumes due to their integration with microfluidic technology. This inclusion increases the speed of the test, while also making it cheaper, more accurate, and more automated in IVD systems. This technique can be helpful for diagnostic purposes, from standard blood and urine tests to sophisticated assays for infectious and cancerous disorders. Furthermore, the growing demand for point-of-care testing is enhancing the use of microfluidics in IVD.

Microfluidics Market, By End User

Due to their potential to generate requirements for advanced diagnostic and analytical techniques, hospitals and diagnostic centers are the key end users of microfluidics. Faster, precise, and efficient testing is carried out by microfluidic devices, which is crucial in healthcare settings where faster results can significantly impact patient care. These instruments offer precise, high-throughput results with less volume of sample for numerous uses, such as point-of-care testing and disease diagnostics. Improved patient outcomes result from the application of microfluidics in workflows, which enhances the potential to conduct intricate assays and screenings. Hospitals and diagnostic centers play a significant role in the expansion and advancement of the microfluidics market due to their increasing application of microfluidic technologies.

REGION

By region, Asia Pacific is projected to grow at a significant CAGR during the forecast period

The microfluidics market in the Asia Pacific region is expanding significantly. This is attributed to the rapid infrastructure development in this region and the growing demand for advanced diagnostic and analytical technologies. The countries in this region are heavily investing in the advancement of their healthcare systems and the application of innovative medical technologies, like microfluidic devices. The growing prevalence of chronic disorders and the need for efficient diagnostic instruments are further propelling the growth of this market. The region has strong manufacturing capacity and can provide microfluidic technology at an affordable rate. Moreover, significant research and development initiatives, when combined with supportive financial help and governmental policies, foster innovation and accelerate market growth.

Microfluidics Market Region

MICROFLUIDICS MARKET SIZE, GROWTH, SHARE & TRENDS ANALYSIS: COMPANY EVALUATION MATRIX

In the microfluidics market, leading companies are advancing miniaturized fluid-handling technologies that enable high-precision diagnostics, molecular analysis, and drug discovery applications. Thermo Fisher Scientific, Illumina Inc., and Bio-Rad Laboratories have established dominant positions through integrated microfluidic platforms for PCR, sequencing, and lab-on-chip diagnostics, supported by robust global distribution and R&D capabilities. Emerging players, such as QuidelOrtho Corporation, Hologic Inc., and Aignep S.p.A., are differentiating themselves through focused innovations in cartridge-based assays, portable testing modules, and fluid-control systems. Together, these players are shaping the evolution of microfluidic technologies—driving faster, more automated, and cost-efficient analytical solutions across research and clinical settings.

Microfluidics Market Evaluation Metrics

Source: Secondary Research, Interviews with Experts, MarketsandMarkets Analysis

KEY MARKET PLAYERS

MARKET SCOPE

REPORT METRIC DETAILS
Market Size in 2025 (Value) USD 24.96 BN
Market Forecast in 2030 (Value) USD 37.19 BN
Growth Rate CAGR of 8.3% from 2025-2030
Years Considered 2024-2030
Base Year 2024
Forecast Period 2025-2030
Units Considered Value (USD Million/Billion), Volume (Procedure)
Report Coverage Revenue forecast, company ranking, competitive landscape, growth factors, and trends
Segments Covered Products (Microfluidics-Based Devices, Microfluidics Components), Application (IVD, Pharma & Life Science Research, Therapeutics), and End-user (Hospitals and Diagnostic Centers, Academia & Research Institutes, and Pharmaceutical & Biotechnology Companies)
Regions Covered North America, Europe, Asia Pacific, Latin America, and Middle East & Africa

WHAT IS IN IT FOR YOU: MICROFLUIDICS MARKET SIZE, GROWTH, SHARE & TRENDS ANALYSIS REPORT CONTENT GUIDE

Microfluidics Market Content Guide

DELIVERED CUSTOMIZATIONS

We have successfully delivered the following deep-dive customizations:

CLIENT REQUEST CUSTOMIZATION DELIVERED VALUE ADDS
Evaluate commercialization pathways for lab-on-chip systems Delivered a breakdown of commercialization models across diagnostic, pharma, and industrial segments, mapping product maturity, IP transfer mechanisms, and scalability barriers Enabled the client to identify high-feasibility business models and partnership entry points for transitioning academic prototypes into market-ready solutions
Assess integration potential of AI and digital microfluidics
  • Mapped integration case studies of AI-driven liquid handling and real-time monitoring in microfluidic platforms
  • Identified players leveraging ML-based predictive analytics
Provided forward-looking intelligence on digital convergence, enabling the client to anticipate automation opportunities in next-generation device development

RECENT DEVELOPMENTS

  • 7/1/2024 12:00:00 AM : Illumina. Inc. (US) acquired Fluent BioSciences (US) to enhance its ability for single-cell analysis.
  • 12/1/2023 12:00:00 AM : Danaher Corporation (US) acquired Abcam plc (UK) to expand its reach in the proteomics area.
  • 6/1/2024 12:00:00 AM : bioMérieux (France) introduced the BIOFIRE SPOTFIRE R/ST Panel Mini, which is a specialized multiplex PCR test that identifies five of the most prevalent viral & bacterial pathogens responsible for respiratory or sore throat infections, delivering results in approximately 15 minutes.
  • 3/1/2023 12:00:00 AM : Danaher (US) partnered with UPenn to develop new technologies that are expected to improve the consistency of clinical outcomes for patients. This partnership is also expected to overcome manufacturing bottlenecks in the delivery of next-gen engineered cell products.
  • 6/1/2024 12:00:00 AM : The US FDA granted 510(k) clearance to Thermo Fisher Scientific's (US) SeCore CDx HLA A Sequencing System for use as a companion diagnostic with Adaptimmune's recently approved TCR therapy, TECELRA (afamitresgene autoleucel), targeting adults with unresectable or metastatic synovial sarcoma.


Table of Contents

Exclusive indicates content/data unique to MarketsandMarkets and not available with any competitors.

TITLE
PAGE NO
1
INTRODUCTION


30
2
EXECUTIVE SUMMARY


36
3
PREMIUM INSIGHTS


42
4
MARKET OVERVIEW
Microfluidics market poised for growth with 3D printing integration and rising precision medicine demand.


46
 
4.1
INTRODUCTION


4.2
MARKET DYNAMICS


4.2.1
DRIVERS


4.2.1.1
INTEGRATION OF MICROFLUIDICS WITH 3D PRINTING


4.2.2
E-HEALTH AND DIGITAL DIAGNOSTICS DRIVING MICROFLUIDICS ADOPTION


4.2.2.1
INCREASING PREVALENCE OF CHRONIC DISEASES FUELING POC TESTING


4.2.2.2
INCREASING FOCUS ON DATA PRECISION AND ACCURACY


4.2.3
RESTRAINTS


4.2.3.1
REGULATORY AND CLINICAL VALIDATION BARRIERS


4.2.3.2
MATERIAL SELECTION FOR MICROFLUIDIC DEVICES


4.2.4
OPPORTUNITIES


4.2.4.1
ADVANCING MICROFLUIDICS FOR REAL-TIME FOOD SAFETY MONITORING


4.2.4.2
RISING DEMAND FOR ORGAN-ON-A-CHIP PLATFORMS IN PRECISION MEDICINE


4.2.5
CHALLENGES


4.2.5.1
LIMITED ADOPTION OF MICROFLUIDIC DEVICES


4.2.5.2
TECHNICAL AND OPERATIONAL LIMITATIONS


4.3
UNMET NEEDS


4.4
INTERCONNECTED MARKETS AND CROSS-SECTOR OPPORTUNITIES


4.5
STRATEGIC MOVES BY TIER 1/2/3 PLAYERS


5
STRATEGIC DISRUPTION THROUGH TECHNOLOGY, PATENTS, AND AI ADOPTION
Harness AI-driven microfluidics innovations to unlock market potential and strategic patent advantages.


56
 
5.1
KEY TECHNOLOGIES


5.1.1
MICROFABRICATION


5.1.2
MATERIAL SCIENCE


5.1.3
OPTOFLUIDICS


5.2
COMPLEMENTARY TECHNOLOGIES


5.2.1
MICRO-ELECTRO-MECHANICAL SYSTEMS (MEMS)


5.2.2
WEARABLE & IMPLANTABLE MICROFLUIDICS


5.3
PATENT ANALYSIS


5.3.1
INNOVATIONS AND PATENT REGISTRATIONS


5.4
FUTURE APPLICATIONS


5.5
IMPACT OF AI/GENAI ON MICROFLUIDICS MARKET


5.5.1
TOP USE CASES AND MARKET POTENTIAL


5.5.2
BEST PRACTICES IN MICROFLUIDICS


5.5.3
CASE STUDIES OF AI IMPLEMENTATION IN MICROFLUIDICS MARKET


5.5.4
INTERCONNECTED ADJACENT ECOSYSTEM AND IMPACT ON MARKET PLAYERS


5.5.5
CLIENT'S READINESS TO ADOPT GENERATIVE AI IN MICROFLUIDICS MARKET


5.6
SUCCESS STORIES AND REAL-WORLD APPLICATIONS


5.7
REGULATORY LANDSCAPE


5.7.1
NORTH AMERICA


5.7.1.1
US


5.7.1.2
CANADA


5.7.2
EUROPE


5.7.3
ASIA PACIFIC


5.7.3.1
JAPAN


5.7.3.2
CHINA


5.7.3.3
INDIA


5.7.4
REGULATORY BODIES, GOVERNMENT AGENCIES, AND OTHER ORGANIZATIONS


6
CUSTOMER LANDSCAPE & BUYER BEHAVIOR
Understand stakeholder influence and unmet needs to optimize microfluidic component purchasing decisions.


73
 
6.1
BUYER STAKEHOLDERS & BUYING EVALUATION CRITERIA


6.1.1
KEY STAKEHOLDERS IN BUYING PROCESS


6.1.2
BUYING CRITERIA


6.2
DECISION-MAKING PROCESS


6.3
ADOPTION BARRIERS & INTERNAL CHALLENGES


6.4
UNMET NEEDS FROM END USERS


7
INDUSTRY TRENDS
Identify strategic opportunities in microfluidics through competitive forces and regional economic insights.


78
 
7.1
PORTER’S FIVE FORCES ANALYSIS


7.1.1
THREAT OF NEW ENTRANTS


7.1.2
THREAT OF SUBSTITUTES


7.1.3
BARGAINING POWER OF SUPPLIERS


7.1.4
BARGAINING POWER OF BUYERS


7.1.5
INTENSITY OF COMPETITIVE RIVALRY


7.2
MACROECONOMIC INDICATORS


7.2.1
INTRODUCTION


7.2.2
HEALTHCARE EXPENDITURE AND INFRASTRUCTURE OUTLOOK


7.2.3
MACROECONOMIC OUTLOOK FOR NORTH AMERICA


7.2.4
MACROECONOMIC OUTLOOK FOR EUROPE


7.2.5
MACROECONOMIC OUTLOOK FOR ASIA PACIFIC


7.2.6
MACROECONOMIC OUTLOOK FOR LATIN AMERICA


7.2.7
MACROECONOMIC OUTLOOK FOR MIDDLE EAST & AFRICA


7.2.8
TRENDS IN GLOBAL MICROFLUIDICS INDUSTRY


7.3
VALUE CHAIN ANALYSIS


7.3.1
RESEARCH & DEVELOPMENT


7.3.2
RAW MATERIAL PROCUREMENT & MANUFACTURING


7.3.3
MARKETING & SALES, DISTRIBUTION, AND POST-SALES SERVICES


7.4
ECOSYSTEM ANALYSIS


7.5
PRICING ANALYSIS


7.5.1
AVERAGE SELLING PRICE TREND, BY REGION


7.5.2
AVERAGE SELLING PRICE OF MICROFLUIDIC COMPONENTS, BY KEY PLAYERS


7.6
TRADE DATA ANALYSIS


7.6.1
IMPORT DATA (HS CODE 3822)


7.6.2
EXPORT DATA (HS CODE 3822)


7.7
KEY CONFERENCES & EVENTS, 2026-2027


7.8
TRENDS/DISRUPTIONS IMPACTING CUSTOMER BUSINESS


7.9
INVESTMENT & FUNDING SCENARIO


7.10
CASE STUDY ANALYSIS


7.10.1
CASE STUDY 1: MULTIPLEX MICROFLUIDIC CIRCUIT FOR BLOOD VESSEL-ON-A-CHIP PERFUSION USING FLOWEZ


7.10.2
CASE STUDY 2: MICROFLUIDIC SYSTEM FOR ROBOTIC HAND PLAYING NINTENDO


7.10.3
CASE STUDY 3: 3D-PRINTED MICROFLUIDIC DEVICES USING POLYJET TECHNOLOGY


7.11
IMPACT OF 2025 US TARIFFS ON MICROFLUIDICS MARKET


7.11.1
INTRODUCTION


7.11.2
KEY TARIFF RATES


7.11.3
PRICE IMPACT ANALYSIS


7.11.4
IMPACT ON COUNTRY/REGION


7.11.5
IMPACT ON END-USE INDUSTRIES


8
MICROFLUIDICS MARKET, BY PRODUCT
Market Size & Growth Rate Forecast Analysis to 2030 in USD Million | 28 Data Tables


99
 
8.1
INTRODUCTION


8.2
MICROFLUIDICS-BASED DEVICES


8.2.1
HIGH UPTAKE OF POC TESTING AND ORGAN-ON-A-CHIP SYSTEMS TO DRIVE MARKET


8.2.2
POLYMERASE CHAIN REACTION (PCR) SYSTEMS


8.2.3
MICROFLUIDIC CAPILLARY ELECTROPHORESIS


8.2.4
NEXT-GENERATION SEQUENCING (NGS) SYSTEMS


8.2.5
DROPLET & PARTICLE PRODUCTION SYSTEMS


8.3
OTHER DEVICES


8.4
MICROFLUIDIC COMPONENTS


8.4.1
CRUCIAL FOR CONTINUOUS HEALTH MONITORING


8.4.2
MICROFLUIDIC COMPONENTS, BY TYPE


8.4.2.1
MICROFLUIDIC CHIPS


8.4.2.2
FLOW & PRESSURE SENSORS


8.4.2.3
FLOW & PRESSURE CONTROLLERS


8.4.2.4
MICROFLUIDIC VALVES


8.4.2.5
MICROPUMPS


8.4.2.6
MICRONEEDLES


8.4.2.7
OTHER MICROFLUIDIC COMPONENTS


8.4.3
MICROFLUIDIC COMPONENTS, BY MATERIAL


8.4.3.1
SILICON


8.4.3.2
POLYMETHYL METHACRYLATE (PMMA)


8.4.3.3
POLYDIMETHYLSILOXANE (PDMS)


8.4.3.4
CYCLIC OLEFIN COPOLYMER (COC)


8.4.3.5
GLASS


8.4.3.6
OTHER MATERIALS


9
MICROFLUIDICS MARKET, BY APPLICATION
Market Size & Growth Rate Forecast Analysis to 2030 in USD Million | 24 Data Tables


119
 
9.1
INTRODUCTION


9.2
IN VITRO DIAGNOSTICS (IVD)


9.2.1
CLINICAL DIAGNOSTICS


9.2.1.1
GROWING FOCUS ON EARLY DISEASE DETECTION TO DRIVE MARKET


9.2.2
POINT-OF-CARE TESTING (POCT)


9.2.2.1
INCREASING DEMAND FOR DECENTRALIZED INFECTIOUS DISEASE TESTING TO DRIVE MARKET


9.2.3
VETERINARY DIAGNOSTICS


9.2.3.1
RISING DEMAND FOR RAPID, FIELD-DEPLOYABLE VETERINARY DIAGNOSTICS TO DRIVE MARKET


9.3
THERAPEUTICS


9.3.1
DRUG DELIVERY


9.3.1.1
ABILITY TO ENABLE SCALABLE PRODUCTION OF POLYMER-BASED DRUG PARTICLES TO DRIVE MARKET


9.3.2
WEARABLE


9.3.2.1
ABILITY TO ENABLE PROACTIVE MANAGEMENT OF HYDRATION, METABOLIC STATUS, AND DISEASE BIOMARKERS TO DRIVE MARKET


9.4
PHARMACEUTICAL & LIFE SCIENCE RESEARCH


9.4.1
LAB ANALYTICS


9.4.1.1
PROTEOMIC ANALYSIS


9.4.1.1.1
UTILIZATION OF PROTEOMES-ON-A-CHIP DEVICES FOR THERAPEUTIC DEVELOPMENT TO DRIVE MARKET


9.4.1.2
GENOMIC ANALYSIS


9.4.1.2.1
HIGH-THROUGHPUT, COST-EFFECTIVE GENOMIC ANALYSIS ENABLED BY MICROFLUIDICS


9.4.1.3
CELL-BASED ASSAYS


9.4.1.3.1
MICROFLUIDIC CO-CULTURES ENABLE PRECISE, HIGH-THROUGHPUT MODELING OF COMPLEX TISSUES FOR DRUG TESTING AND DISEASE RESEARCH


9.4.1.4
CAPILLARY ELECTROPHORESIS


9.4.1.4.1
ENABLES HIGH-THROUGHPUT, PRECISE, AND COST-EFFICIENT PROTEIN AND NUCLEIC ACID ANALYSIS


9.4.2
MICRODISPENSING


9.4.2.1
SUITABILITY FOR LOW-VISCOSITY APPLICATIONS TO SUPPORT MARKET GROWTH


9.4.3
MICROREACTORS


9.4.3.1
GROWING ADOPTION OF CONTINUOUS FLOW SYNTHESIS IN RESEARCH & DEVELOPMENT TO DRIVE MARKET


10
MICROFLUIDICS MARKET, BY END USER
Market Size & Growth Rate Forecast Analysis to 2030 in USD Million | 6 Data Tables


135
 
10.1
INTRODUCTION


10.2
HOSPITALS & DIAGNOSTIC CENTERS


10.2.1
RISING DEPENDENCE ON RAPID MICROFLUIDIC MOLECULAR DIAGNOSTICS TO DRIVE GROWTH


10.3
PHARMACEUTICAL & BIOTECHNOLOGY COMPANIES


10.3.1
STRONG ADOPTION OF MICROFLUIDIC TECHNOLOGIES FOR PRECISE FORMULATION, NANOPARTICLE PRODUCTION, AND TOXICITY TESTING TO DRIVE GROWTH


10.4
ACADEMIC & RESEARCH INSTITUTES


10.4.1
INVESTMENTS IN BIOMEDICAL & LIFE SCIENCE RESEARCH TO DRIVE GROWTH


11
MICROFLUIDICS MARKET, BY REGION
Comprehensive coverage of 8 Regions with country-level deep-dive of 14 Countries | 132 Data Tables.


141
 
11.1
INTRODUCTION


11.2
NORTH AMERICA


11.2.1
US


11.2.1.1
EXPANSION OF APPLICATIONS BEYOND TRADITIONAL DIAGNOSTICS TO DRIVE MARKET


11.2.2
CANADA


11.2.2.1
GOVERNMENT FUNDING AND COLLABORATIVE ECOSYSTEMS TO SUPPORT GROWTH


11.3
EUROPE


11.3.1
GERMANY


11.3.1.1
ONGOING INVESTMENTS IN SEMICONDUCTORS AND MICROELECTRONICS TO DRIVE MARKET


11.3.2
FRANCE


11.3.2.1
RISING DEMAND FOR ADVANCED LAB-ON-CHIP AND ORGAN-ON-CHIP SOLUTIONS TO DRIVE MARKET


11.3.3
UK


11.3.3.1
RISING CASES OF CHRONIC DISEASES AND INCREASING DEMAND FOR POC TESTING TO BOOST DEMAND


11.3.4
ITALY


11.3.4.1
SHIFT TOWARD COST-EFFICIENT MICROFLUIDIC PLATFORMS FOR DIAGNOSTICS, ENVIRONMENTAL TESTING, AND ADVANCED BIOMEDICAL RESEARCH TO DRIVE MARKET


11.3.5
SPAIN


11.3.5.1
INCREASING DEMAND FOR ACCESSIBLE POINT-OF-CARE AND LAB-ON-CHIP SOLUTIONS TO DRIVE MARKET


11.3.6
REST OF EUROPE


11.4
ASIA PACIFIC


11.4.1
CHINA


11.4.1.1
GOVERNMENT SUPPORT AND STRATEGIC PARTNERSHIPS TO DRIVE MARKET


11.4.2
JAPAN


11.4.2.1
GOVERNMENT SUPPORT, INNOVATION, AND INDUSTRY-ACADEMIA COLLABORATION TO DRIVE GROWTH


11.4.3
INDIA


11.4.3.1
GROWING BIOTECH STARTUP ECOSYSTEM AND RESEARCH FROM PREMIER INSTITUTIONS TO DRIVE MARKET


11.4.4
AUSTRALIA


11.4.4.1
INNOVATION ECOSYSTEM, R&D STRENGTH, AND PRECISION ENGINEERING TO SUPPORT GROWTH


11.4.5
SOUTH KOREA


11.4.5.1
ADVANCED RESEARCH, GLOBAL PARTNERSHIPS, AND NEXT-GEN TECHNOLOGIES TO DRIVE MARKET


11.4.6
REST OF ASIA PACIFIC


11.5
LATIN AMERICA


11.5.1
BRAZIL


11.5.1.1
RISING INVESTMENT IN HEALTHTECH AND EMPHASIS ON MOLECULAR DIAGNOSTICS TO DRIVE MARKET


11.5.2
MEXICO


11.5.2.1
GROWING DEMAND FOR ADVANCED DIAGNOSTICS AND BIOTECH INNOVATION TO DRIVE MARKET


11.5.3
REST OF LATIN AMERICA


11.6
MIDDLE EAST & AFRICA


11.6.1
GCC COUNTRIES


11.6.1.1
DISEASE BURDEN AND HEALTHCARE MODERNIZATION TO DRIVE MARKET


11.6.2
REST OF MIDDLE EAST & AFRICA


12
COMPETITIVE LANDSCAPE
Discover strategic insights and market positions of key players shaping the microfluidics industry.


203
 
12.1
INTRODUCTION


12.2
KEY PLAYER STRATEGIES/RIGHT TO WIN


12.3
OVERVIEW OF STRATEGIES ADOPTED BY KEY PLAYERS IN MICROFLUIDICS MARKET


12.4
REVENUE ANALYSIS, 2022–2024


12.5
MARKET SHARE ANALYSIS, 2024


12.6
RANKING OF KEY MARKET PLAYERS


12.7
COMPANY EVALUATION MATRIX: KEY PLAYERS, 2024


12.7.1
STARS


12.7.2
EMERGING LEADERS


12.7.3
PERVASIVE PLAYERS


12.7.4
PARTICIPANTS


12.7.5
COMPANY FOOTPRINT: KEY PLAYERS, 2024


12.7.5.1
COMPANY FOOTPRINT


12.7.5.2
REGION FOOTPRINT


12.7.5.3
PRODUCT FOOTPRINT


12.7.5.4
APPLICATION FOOTPRINT


12.7.5.5
END USER FOOTPRINT


12.8
COMPANY EVALUATION MATRIX: STARTUPS/SMES, 2024


12.8.1
PROGRESSIVE COMPANIES


12.8.2
RESPONSIVE COMPANIES


12.8.3
DYNAMIC COMPANIES


12.8.4
STARTING BLOCKS


12.8.5
COMPETITIVE BENCHMARKING: STARTUPS/SMES, 2024


12.8.5.1
LIST OF KEY STARTUP/SME PLAYERS


12.8.5.2
COMPETITIVE BENCHMARKING OF KEY STARTUPS/SMES


12.9
COMPANY VALUATION & FINANCIAL METRICS


12.9.1
FINANCIAL METRICS


12.9.2
COMPANY VALUATION


12.10
BRAND/PRODUCT COMPARATIVE ANALYSIS


12.11
COMPETITIVE SCENARIO


12.11.1
PRODUCT LAUNCHES & APPROVALS


12.11.2
DEALS


12.11.3
EXPANSIONS


12.11.4
OTHER DEVELOPMENTS


13
COMPANY PROFILES
In-depth Company Profiles of Leading Market Players with detailed Business Overview, Product and Service Portfolio, Recent Developments, and Unique Analyst Perspective (MnM View)


220
 
13.1
KEY PLAYERS


13.1.1
DANAHER CORPORATION


13.1.1.1
BUSINESS OVERVIEW


13.1.1.2
PRODUCTS OFFERED


13.1.1.3
RECENT DEVELOPMENTS


13.1.1.3.1
DEALS


13.1.1.3.2
EXPANSIONS


13.1.1.4
MNM VIEW


13.1.1.4.1
KEY STRENGTHS


13.1.1.4.2
STRATEGIC CHOICES


13.1.1.4.3
WEAKNESSES & COMPETITIVE THREATS


13.1.2
ILLUMINA, INC.


13.1.3
BIOMÉRIEUX


13.1.4
THERMO FISHER SCIENTIFIC INC.


13.1.5
ABBOTT LABORATORIES


13.1.6
PARKER HANNIFIN CORP


13.1.7
SMC CORPORATION


13.1.8
IDEX CORPORATION


13.1.9
FORTIVE


13.1.10
REVVITY, INC.


13.1.11
AGILENT TECHNOLOGIES, INC.


13.1.12
BIO-RAD LABORATORIES, INC.


13.1.13
BECTON, DICKINSON AND COMPANY


13.1.14
F. HOFFMANN-LA ROCHE LTD.


13.1.15
STANDARD BIOTOOLS


13.1.16
QUIDELORTHO CORPORATION


13.1.17
AIGNEP S.P.A.


13.1.18
DOLOMITE MICROFLUIDICS


13.1.19
ELVEFLOW


13.2
OTHER PLAYERS


13.2.1
NANOSTRING TECHNOLOGIES


13.2.2
INNOVATIVE BIOCHIPS, LLC


13.2.3
FLUIDIC ANALYTICS


13.2.4
HORIBA


13.2.5
MICRONIT B.V.


13.2.6
EMULATE, INC.


13.2.7
SPHERE BIO


13.2.8
ZEON CORPORATION


13.2.9
QIAGEN N.V.


14
RESEARCH METHODOLOGY


302
 
14.1
RESEARCH DATA


14.2
RESEARCH DESIGN


14.2.1
SECONDARY RESEARCH


14.2.1.1
OBJECTIVES OF SECONDARY RESEARCH


14.2.1.2
KEY DATA FROM SECONDARY SOURCES


14.2.2
PRIMARY RESEARCH


14.2.2.1
OBJECTIVES OF PRIMARY RESEARCH


14.2.2.2
KEY INDUSTRY INSIGHTS


14.3
MARKET SIZE ESTIMATION METHODOLOGY


14.3.1
BOTTOM-UP APPROACH


14.3.1.1
APPROACH 1: COMPANY REVENUE ESTIMATION APPROACH


14.3.1.2
APPROACH 2: CUSTOMER-BASED MARKET ESTIMATION


14.3.1.3
APPROACH 3: PRIMARY INTERVIEWS


14.3.2
TOP-DOWN APPROACH


14.4
MARKET BREAKDOWN AND DATA TRIANGULATION


14.5
MARKET SHARE ASSESSMENT


14.6
RESEARCH ASSUMPTIONS


14.7
RESEARCH LIMITATIONS


14.8
RISK ASSESSMENT


15
APPENDIX


316
 
15.1
DISCUSSION GUIDE


15.2
KNOWLEDGESTORE: MARKETSANDMARKETS’ SUBSCRIPTION PORTAL


15.3
CUSTOMIZATION OPTIONS


15.4
RELATED REPORTS


15.5
AUTHOR DETAILS


LIST OF TABLES


TABLE 1
MICROFLUIDICS MARKET: INCLUSIONS AND EXCLUSIONS


TABLE 2
MICROFLUIDICS MARKET: IMPACT ANALYSIS OF MARKET DYNAMICS


TABLE 3
DIFFERENT FABRICATION MATERIALS USED


TABLE 4
COMMERCIAL MICROFLUIDIC PCR ASSAYS FOR TB


TABLE 5
COMPARISON OF KEY MATERIALS USED IN MICROFLUIDIC DEVICES


TABLE 6
MICROFLUIDICS MARKET: UNMET NEEDS


TABLE 7
STRATEGIC MOVES BY TIER 1, TIER 2, AND TIER 3 PLAYERS IN MICROFLUIDICS MARKET


TABLE 8
MICROFLUIDICS MARKET: INNOVATIONS AND PATENT REGISTRATIONS, 2022–2024


TABLE 9
KEY COMPANIES IMPLEMENTING AI/GENAI IN MICROFLUIDICS MARKET


TABLE 10
US: CLASSIFICATION OF MICROFLUIDICS TECHNOLOGY-ASSOCIATED DIAGNOSTIC DEVICES


TABLE 11
CANADA: TIME, COST, AND COMPLEXITY OF REGISTRATION


TABLE 12
EUROPE: CLASSIFICATION OF MICROFLUIDICS ASSOCIATED WITH IVD DEVICES


TABLE 13
JAPAN: TIME, COST, AND COMPLEXITY OF REGISTRATION


TABLE 14
CHINA: TIME, COST, AND COMPLEXITY OF REGISTRATION


TABLE 15
NORTH AMERICA: REGULATORY BODIES, GOVERNMENT AGENCIES, AND OTHER ORGANIZATIONS


TABLE 16
EUROPE: REGULATORY BODIES, GOVERNMENT AGENCIES, AND OTHER ORGANIZATIONS


TABLE 17
ASIA PACIFIC: REGULATORY BODIES, GOVERNMENT AGENCIES, AND OTHER ORGANIZATIONS


TABLE 18
LATIN AMERICA: REGULATORY BODIES, GOVERNMENT AGENCIES, AND OTHER ORGANIZATIONS


TABLE 19
REST OF THE WORLD: REGULATORY BODIES, GOVERNMENT AGENCIES, AND OTHER ORGANIZATIONS


TABLE 20
INFLUENCE OF STAKEHOLDERS ON BUYING PROCESS FOR MICROFLUIDIC COMPONENTS, BY MATERIAL


TABLE 21
KEY BUYING CRITERIA FOR MICROFLUIDIC COMPONENTS, BY MATERIAL


TABLE 22
MICROFLUIDICS MARKET: UNMET NEED ANALYSIS


TABLE 23
MICROFLUIDICS MARKET: IMPACT OF PORTER’S FIVE FORCES


TABLE 24
NORTH AMERICA: MACROECONOMIC OUTLOOK


TABLE 25
EUROPE: MACROECONOMIC OUTLOOK


TABLE 26
ASIA PACIFIC: MACROECONOMIC INDICATORS


TABLE 27
LATIN AMERICA: MACROECONOMIC OUTLOOK


TABLE 28
MIDDLE EAST & AFRICA: MACROECONOMIC OUTLOOK


TABLE 29
MICROFLUIDICS MARKET: ROLE IN ECOSYSTEM


TABLE 30
AVERAGE SELLING PRICE RANGE OF MICROFLUIDICS COMPONENTS, BY REGION, 2023–2025 (USD THOUSAND)


TABLE 31
AVERAGE SELLING PRICE TREND OF MICROFLUIDIC COMPONENTS, BY KEY PLAYERS, 2024 (USD)


TABLE 32
IMPORT DATA FOR HS CODE 3822, BY COUNTRY, 2020–2024 (USD THOUSAND)


TABLE 33
EXPORT DATA FOR HS CODE 3822, BY COUNTRY, 2020–2024 (USD THOUSAND)


TABLE 34
MICROFLUIDICS MARKET: KEY CONFERENCES & EVENTS (2026-2027)


TABLE 35
CASE STUDY 1: MULTIPLEX MICROFLUIDIC CIRCUIT FOR BLOOD VESSEL-ON-A-CHIP PERFUSION USING FLOWEZ


TABLE 36
CASE STUDY 2: MICROFLUIDIC SYSTEM FOR ROBOTIC HAND PLAYING NINTENDO


TABLE 37
CASE STUDY 3: 3D-PRINTED MICROFLUIDIC DEVICES USING POLYJET TECHNOLOGY


TABLE 38
US ADJUSTED RECIPROCAL TARIFF RATES


TABLE 39
TARIFF-INDUCED PRICE INCREASES FOR HEALTHCARE PRODUCTS


TABLE 40
MICROFLUIDICS MARKET, BY PRODUCT, 2023–2030 (USD MILLION)


TABLE 41
MICROFLUIDICS MARKET, BY REGION, 2023–2030 (USD MILLION)


TABLE 42
MICROFLUIDICS-BASED DEVICES MARKET, BY REGION, 2023–2030 (USD MILLION)


TABLE 43
MICROFLUIDICS-BASED DEVICES MARKET, BY DEVICE, 2023–2030 (USD MILLION)


TABLE 44
PCR SYSTEMS MARKET, BY REGION, 2023–2030 (USD MILLION)


TABLE 45
MICROFLUIDIC CAPILLARY ELECTROPHORESIS MARKET, BY REGION, 2023–2030 (USD MILLION)


TABLE 46
NEXT-GENERATION SEQUENCING SYSTEMS MARKET, BY REGION, 2023–2030 (USD MILLION)


TABLE 47
DROPLET & PARTICLE PRODUCTION SYSTEMS MARKET, BY REGION, 2023–2030 (USD MILLION)


TABLE 48
OTHER DEVICES MARKET, BY REGION, 2023–2030 (USD MILLION)


TABLE 49
MICROFLUIDIC COMPONENTS MARKET, BY TYPE, 2023–2030 (USD MILLION)


TABLE 50
MICROFLUIDIC COMPONENTS MARKET, BY REGION, 2023–2030 (USD MILLION)


TABLE 51
MICROFLUIDIC CHIPS OFFERED BY KEY PLAYERS


TABLE 52
MICROFLUIDIC CHIPS MARKET, BY REGION, 2023–2030 (USD MILLION)


TABLE 53
FLOW & PRESSURE SENSORS MARKET, BY REGION, 2023–2030 (USD MILLION)


TABLE 54
FLOW & PRESSURE CONTROLLERS MARKET, BY REGION, 2023–2030 (USD MILLION)


TABLE 55
MICROFLUIDIC VALVES MARKET, BY REGION, 2023–2030 (USD MILLION)


TABLE 56
MICROPUMPS MARKET, BY REGION, 2023–2030 (USD MILLION)


TABLE 57
MICRONEEDLES OFFERED BY KEY PLAYERS


TABLE 58
MICRONEEDLES MARKET, BY REGION, 2023–2030 (USD MILLION)


TABLE 59
OTHER MICROFLUIDIC COMPONENTS MARKET, BY REGION, 2023–2030 (USD MILLION)


TABLE 60
MICROFLUIDIC COMPONENTS MARKET, BY MATERIAL, 2023–2030 (USD MILLION)


TABLE 61
MATERIAL-BASED MICROFLUIDIC COMPONENTS MARKET, BY REGION, 2023–2030 (USD MILLION)


TABLE 62
SILICON-BASED MICROFLUIDIC COMPONENTS MARKET, BY REGION, 2023–2030 (USD MILLION)


TABLE 63
PMMA-BASED MICROFLUIDIC COMPONENTS MARKET, BY REGION, 2023–2030 (USD MILLION)


TABLE 64
PDMS-BASED MICROFLUIDIC COMPONENTS MARKET, BY REGION, 2023–2030 (USD MILLION)


TABLE 65
COC-BASED MICROFLUIDIC COMPONENTS MARKET, BY REGION, 2023–2030 (USD MILLION)


TABLE 66
GLASS-BASED MICROFLUIDIC COMPONENTS MARKET, BY REGION, 2023–2030 (USD MILLION)


TABLE 67
OTHER MATERIALS MARKET, BY REGION, 2023–2030 (USD MILLION)


TABLE 68
MICROFLUIDICS MARKET, BY APPLICATION, 2023–2030 (USD MILLION)


TABLE 69
MICROFLUIDICS MARKET, BY REGION, 2023–2030 (USD MILLION)


TABLE 70
MICROFLUIDICS MARKET FOR IVD APPLICATION, BY TYPE, 2023–2030 (USD MILLION)


TABLE 71
MICROFLUIDICS MARKET FOR IVD APPLICATION, BY REGION, 2023–2030 (USD MILLION)


TABLE 72
MICROFLUIDICS MARKET FOR CLINICAL DIAGNOSTICS, BY REGION, 2023–2030 (USD MILLION)


TABLE 73
MICROFLUIDICS MARKET FOR POCT, BY REGION, 2023–2030 (USD MILLION)


TABLE 74
MICROFLUIDICS MARKET FOR VETERINARY DIAGNOSTICS, BY REGION, 2023–2030 (USD MILLION)


TABLE 75
MICROFLUIDICS MARKET FOR THERAPEUTICS, BY TYPE, 2023–2030 (USD MILLION)


TABLE 76
MICROFLUIDICS MARKET FOR THERAPEUTICS, BY REGION, 2023–2030 (USD MILLION)


TABLE 77
COMPARISON OF MICROFLUIDIC VS. TRADITIONAL API ENCAPSULATION


TABLE 78
MICROFLUIDICS MARKET FOR DRUG DELIVERY, BY REGION, 2023–2030 (USD MILLION)


TABLE 79
OVERVIEW OF WEARABLE MICROFLUIDIC PLATFORMS ACROSS BIOFLUIDS: TARGETS, APPLICATIONS, DETECTION STRATEGIES, AND TRANSLATIONAL STATUS


TABLE 80
MICROFLUIDICS MARKET FOR WEARABLE DEVICES, BY REGION, 2023–2030 (USD MILLION)


TABLE 81
MICROFLUIDICS MARKET FOR PHARMACEUTICAL & LIFE SCIENCE RESEARCH, BY TYPE, 2023–2030 (USD MILLION)


TABLE 82
MICROFLUIDICS MARKET FOR PHARMACEUTICAL & LIFE SCIENCE RESEARCH, BY REGION, 2023–2030 (USD MILLION)


TABLE 83
MICROFLUIDICS MARKET FOR LAB ANALYTICS, BY TYPE, 2023–2030 (USD MILLION)


TABLE 84
MICROFLUIDICS MARKET FOR LAB ANALYTICS, BY REGION, 2023–2030 (USD MILLION)


TABLE 85
MICROFLUIDICS MARKET FOR PROTEOMIC ANALYSIS, BY REGION, 2023–2030 (USD MILLION)


TABLE 86
MICROFLUIDICS MARKET FOR GENOMIC ANALYSIS, BY REGION, 2023–2030 (USD MILLION)


TABLE 87
KEY ORGAN-ON-CHIP APPLICATIONS


TABLE 88
MICROFLUIDICS MARKET FOR CELL-BASED ASSAYS, BY REGION, 2023–2030 (USD MILLION)


TABLE 89
MICROFLUIDICS MARKET FOR CAPILLARY ELECTROPHORESIS, BY REGION, 2023–2030 (USD MILLION)


TABLE 90
MICROFLUIDICS MARKET FOR MICRODISPENSING, BY REGION, 2023–2030 (USD MILLION)


TABLE 91
MICROFLUIDICS MARKET FOR MICROREACTORS, BY REGION, 2023–2030 (USD MILLION)


TABLE 92
MICROFLUIDICS MARKET, BY END USER, 2023–2030 (USD MILLION)


TABLE 93
MICROFLUIDICS MARKET, BY REGION, 2023–2030 (USD MILLION)


TABLE 94
MICROFLUIDICS MARKET FOR HOSPITALS & DIAGNOSTIC CENTERS, BY REGION, 2023–2030 (USD MILLION)


TABLE 95
MICROFLUIDICS MARKET FOR PHARMACEUTICAL & BIOTECHNOLOGY COMPANIES, BY REGION, 2023–2030 (USD MILLION)


TABLE 96
LEADING MICROFLUIDICS RESEARCH INSTITUTES, BY AREA OF INTEREST


TABLE 97
MICROFLUIDICS MARKET FOR ACADEMIC & RESEARCH INSTITUTES, BY REGION, 2023–2030 (USD MILLION)


TABLE 98
MICROFLUIDICS MARKET, BY REGION, 2023–2030 (USD MILLION)


TABLE 99
NORTH AMERICA: MICROFLUIDICS MARKET, BY COUNTRY, 2023–2030 (USD MILLION)


TABLE 100
NORTH AMERICA: MICROFLUIDICS MARKET, BY PRODUCT, 2023–2030 (USD MILLION)


TABLE 101
NORTH AMERICA: MICROFLUIDIC-BASED DEVICES MARKET, BY DEVICE, 2023–2030 (USD MILLION)


TABLE 102
NORTH AMERICA: MICROFLUIDIC COMPONENTS MARKET, BY TYPE, 2023–2030 (USD MILLION)


TABLE 103
NORTH AMERICA: MICROFLUIDIC COMPONENTS MARKET, BY MATERIAL, 2023–2030 (USD MILLION)


TABLE 104
NORTH AMERICA: MICROFLUIDICS MARKET, BY APPLICATION, 2023–2030 (USD MILLION)


TABLE 105
NORTH AMERICA: MICROFLUIDICS MARKET FOR IVD APPLICATIONS, BY TYPE, 2023–2030 (USD MILLION)


TABLE 106
NORTH AMERICA: MICROFLUIDICS MARKET FOR PHARMACEUTICAL & LIFE SCIENCE RESEARCH, BY TYPE, 2023–2030 (USD MILLION)


TABLE 107
NORTH AMERICA: MICROFLUIDICS MARKET FOR LAB ANALYTICS, BY TYPE, 2023–2030 (USD MILLION)


TABLE 108
NORTH AMERICA: MICROFLUIDICS MARKET FOR THERAPEUTICS, BY TYPE, 2023–2030 (USD MILLION)


TABLE 109
NORTH AMERICA: MICROFLUIDICS MARKET, BY END USER, 2023–2030 (USD MILLION)


TABLE 110
US: MICROFLUIDICS MARKET, BY PRODUCT, 2023–2030 (USD MILLION)


TABLE 111
US: MICROFLUIDIC-BASED DEVICES MARKET, BY DEVICE, 2023–2030 (USD MILLION)


TABLE 112
US: MICROFLUIDIC COMPONENTS MARKET, BY TYPE, 2023–2030 (USD MILLION)


TABLE 113
US: MICROFLUIDIC COMPONENTS MARKET, BY MATERIAL, 2023–2030 (USD MILLION)


TABLE 114
CANADA: MICROFLUIDICS MARKET, BY PRODUCT, 2023–2030 (USD MILLION)


TABLE 115
CANADA: MICROFLUIDIC-BASED DEVICES MARKET, BY DEVICE, 2023–2030 (USD MILLION)


TABLE 116
CANADA: MICROFLUIDIC COMPONENTS MARKET, BY TYPE, 2023–2030 (USD MILLION)


TABLE 117
CANADA: MICROFLUIDIC COMPONENTS MARKET, BY MATERIAL, 2023–2030 (USD MILLION)


TABLE 118
EUROPE: MICROFLUIDICS MARKET, BY COUNTRY, 2023–2030 (USD MILLION)


TABLE 119
EUROPE: MICROFLUIDICS MARKET, BY PRODUCT, 2023–2030 (USD MILLION)


TABLE 120
EUROPE: MICROFLUIDIC-BASED DEVICES MARKET, BY DEVICE, 2023–2030 (USD MILLION)


TABLE 121
EUROPE: MICROFLUIDIC COMPONENTS MARKET, BY TYPE, 2023–2030 (USD MILLION)


TABLE 122
EUROPE: MICROFLUIDIC COMPONENTS MARKET, BY MATERIAL, 2023–2030 (USD MILLION)


TABLE 123
EUROPE: MICROFLUIDICS MARKET, BY APPLICATION, 2023–2030 (USD MILLION)


TABLE 124
EUROPE: MICROFLUIDICS MARKET FOR IVD APPLICATIONS, BY TYPE, 2023–2030 (USD MILLION)


TABLE 125
EUROPE: MICROFLUIDICS MARKET FOR PHARMACEUTICAL & LIFE SCIENCE RESEARCH, BY TYPE, 2023–2030 (USD MILLION)


TABLE 126
EUROPE: MICROFLUIDICS MARKET FOR LAB ANALYTICS, BY TYPE, 2023–2030 (USD MILLION)


TABLE 127
EUROPE: MICROFLUIDICS MARKET FOR THERAPEUTICS, BY TYPE, 2023–2030 (USD MILLION)


TABLE 128
EUROPE: MICROFLUIDICS MARKET, BY END USER, 2023–2030 (USD MILLION)


TABLE 129
GERMANY: MICROFLUIDICS MARKET, BY PRODUCT, 2023–2030 (USD MILLION)


TABLE 130
GERMANY: MICROFLUIDIC-BASED DEVICES MARKET, BY DEVICE, 2023–2030 (USD MILLION)


TABLE 131
GERMANY: MICROFLUIDIC COMPONENTS MARKET, BY TYPE, 2023–2030 (USD MILLION)


TABLE 132
GERMANY: MICROFLUIDIC COMPONENTS MARKET, BY MATERIAL, 2023–2030 (USD MILLION)


TABLE 133
FRANCE: MICROFLUIDICS MARKET, BY PRODUCT, 2023–2030 (USD MILLION)


TABLE 134
FRANCE: MICROFLUIDIC-BASED DEVICES MARKET, BY DEVICE, 2023–2030 (USD MILLION)


TABLE 135
FRANCE: MICROFLUIDIC COMPONENTS MARKET, BY TYPE, 2023–2030 (USD MILLION)


TABLE 136
FRANCE: MICROFLUIDIC COMPONENTS MARKET, BY MATERIAL, 2023–2030 (USD MILLION)


TABLE 137
UK: MICROFLUIDICS MARKET, BY PRODUCT, 2023–2030 (USD MILLION)


TABLE 138
UK: MICROFLUIDIC-BASED DEVICES MARKET, BY DEVICE, 2023–2030 (USD MILLION)


TABLE 139
UK: MICROFLUIDIC COMPONENTS MARKET, BY TYPE, 2023–2030 (USD MILLION)


TABLE 140
UK: MICROFLUIDIC COMPONENTS MARKET, BY MATERIAL, 2023–2030 (USD MILLION)


TABLE 141
ITALY: MICROFLUIDICS MARKET, BY PRODUCT, 2023–2030 (USD MILLION)


TABLE 142
ITALY: MICROFLUIDIC-BASED DEVICES MARKET, BY DEVICE, 2023–2030 (USD MILLION)


TABLE 143
ITALY: MICROFLUIDIC COMPONENTS MARKET, BY TYPE, 2023–2030 (USD MILLION)


TABLE 144
ITALY: MICROFLUIDIC COMPONENTS MARKET, BY MATERIAL, 2023–2030 (USD MILLION)


TABLE 145
SPAIN: MICROFLUIDICS MARKET, BY PRODUCT, 2023–2030 (USD MILLION)


TABLE 146
SPAIN: MICROFLUIDIC-BASED DEVICES MARKET, BY DEVICE, 2023–2030 (USD MILLION)


TABLE 147
SPAIN: MICROFLUIDIC COMPONENTS MARKET, BY TYPE, 2023–2030 (USD MILLION)


TABLE 148
SPAIN: MICROFLUIDIC COMPONENTS MARKET, BY MATERIAL, 2023–2030 (USD MILLION)


TABLE 149
REST OF EUROPE: MICROFLUIDICS MARKET, BY PRODUCT, 2023–2030 (USD MILLION)


TABLE 150
REST OF EUROPE: MICROFLUIDIC-BASED DEVICES MARKET, BY DEVICE, 2023–2030 (USD MILLION)


TABLE 151
REST OF EUROPE: MICROFLUIDIC COMPONENTS MARKET, BY TYPE, 2023–2030 (USD MILLION)


TABLE 152
REST OF EUROPE: MICROFLUIDIC COMPONENTS MARKET, BY MATERIAL, 2023–2030 (USD MILLION)


TABLE 153
ASIA PACIFIC: MICROFLUIDICS MARKET, BY COUNTRY, 2023–2030 (USD MILLION)


TABLE 154
ASIA PACIFIC: MICROFLUIDICS MARKET, BY PRODUCT, 2023–2030 (USD MILLION)


TABLE 155
ASIA PACIFIC: MICROFLUIDIC-BASED DEVICES MARKET, BY DEVICE, 2023–2030 (USD MILLION)


TABLE 156
ASIA PACIFIC: MICROFLUIDIC COMPONENTS MARKET, BY TYPE, 2023–2030 (USD MILLION)


TABLE 157
ASIA PACIFIC: MICROFLUIDIC COMPONENTS MARKET, BY MATERIAL, 2023–2030 (USD MILLION)


TABLE 158
ASIA PACIFIC: MICROFLUIDICS MARKET, BY APPLICATION, 2023–2030 (USD MILLION)


TABLE 159
ASIA PACIFIC: MICROFLUIDICS MARKET FOR IVD APPLICATIONS, BY TYPE, 2023–2030 (USD MILLION)


TABLE 160
ASIA PACIFIC: MICROFLUIDICS MARKET FOR PHARMACEUTICAL & LIFE SCIENCE RESEARCH, BY TYPE, 2023–2030 (USD MILLION)


TABLE 161
ASIA PACIFIC: MICROFLUIDICS MARKET FOR LAB ANALYTICS, BY TYPE, 2023–2030 (USD MILLION)


TABLE 162
ASIA PACIFIC: MICROFLUIDICS MARKET FOR THERAPEUTICS, BY TYPE, 2023–2030 (USD MILLION)


TABLE 163
ASIA PACIFIC: MICROFLUIDICS MARKET, BY END USER, 2023–2030 (USD MILLION)


TABLE 164
CHINA: MICROFLUIDICS MARKET, BY PRODUCT, 2023–2030 (USD MILLION)


TABLE 165
CHINA: MICROFLUIDIC-BASED DEVICES MARKET, BY DEVICE, 2023–2030 (USD MILLION)


TABLE 166
CHINA: MICROFLUIDIC COMPONENTS MARKET, BY TYPE, 2023–2030 (USD MILLION)


TABLE 167
CHINA: MICROFLUIDIC COMPONENTS MARKET, BY MATERIAL, 2023–2030 (USD MILLION)


TABLE 168
JAPAN: MICROFLUIDICS MARKET, BY PRODUCT, 2023–2030 (USD MILLION)


TABLE 169
JAPAN: MICROFLUIDIC-BASED DEVICES MARKET, BY DEVICE, 2023–2030 (USD MILLION)


TABLE 170
JAPAN: MICROFLUIDIC COMPONENTS MARKET, BY TYPE, 2023–2030 (USD MILLION)


TABLE 171
JAPAN: MICROFLUIDIC COMPONENTS MARKET, BY MATERIAL, 2023–2030 (USD MILLION)


TABLE 172
INDIA: MICROFLUIDICS MARKET, BY PRODUCT, 2023–2030 (USD MILLION)


TABLE 173
INDIA: MICROFLUIDIC-BASED DEVICES MARKET, BY DEVICE, 2023–2030 (USD MILLION)


TABLE 174
INDIA: MICROFLUIDIC COMPONENTS MARKET, BY TYPE, 2023–2030 (USD MILLION)


TABLE 175
INDIA: MICROFLUIDIC COMPONENTS MARKET, BY MATERIAL, 2023–2030 (USD MILLION)


TABLE 176
AUSTRALIA: MICROFLUIDICS MARKET, BY PRODUCT, 2023–2030 (USD MILLION)


TABLE 177
AUSTRALIA: MICROFLUIDIC-BASED DEVICES MARKET, BY DEVICE, 2023–2030 (USD MILLION)


TABLE 178
AUSTRALIA: MICROFLUIDIC COMPONENTS MARKET, BY TYPE, 2023–2030 (USD MILLION)


TABLE 179
AUSTRALIA: MICROFLUIDIC COMPONENTS MARKET, BY MATERIAL, 2023–2030 (USD MILLION)


TABLE 180
SOUTH KOREA: MICROFLUIDICS MARKET, BY PRODUCT, 2023–2030 (USD MILLION)


TABLE 181
SOUTH KOREA: MICROFLUIDIC-BASED DEVICES MARKET, BY DEVICE, 2023–2030 (USD MILLION)


TABLE 182
SOUTH KOREA: MICROFLUIDIC COMPONENTS MARKET, BY TYPE, 2023–2030 (USD MILLION)


TABLE 183
SOUTH KOREA: MICROFLUIDIC COMPONENTS MARKET, BY MATERIAL, 2023–2030 (USD MILLION)


TABLE 184
REST OF ASIA PACIFIC: MICROFLUIDICS MARKET, BY PRODUCT, 2023–2030 (USD MILLION)


TABLE 185
REST OF ASIA PACIFIC: MICROFLUIDIC-BASED DEVICES MARKET, BY DEVICE, 2023–2030 (USD MILLION)


TABLE 186
REST OF ASIA PACIFIC: MICROFLUIDIC COMPONENTS MARKET, BY TYPE, 2023–2030 (USD MILLION)


TABLE 187
REST OF ASIA PACIFIC: MICROFLUIDIC COMPONENTS MARKET, BY MATERIAL, 2023–2030 (USD MILLION)


TABLE 188
LATIN AMERICA: MICROFLUIDICS MARKET, BY COUNTRY, 2023–2030 (USD MILLION)


TABLE 189
LATIN AMERICA: MICROFLUIDICS MARKET, BY PRODUCT, 2023–2030 (USD MILLION)


TABLE 190
LATIN AMERICA: MICROFLUIDIC-BASED DEVICES MARKET, BY DEVICE, 2023–2030 (USD MILLION)


TABLE 191
LATIN AMERICA: MICROFLUIDIC COMPONENTS MARKET, BY TYPE, 2023–2030 (USD MILLION)


TABLE 192
LATIN AMERICA: MICROFLUIDIC COMPONENTS MARKET, BY MATERIAL, 2023–2030 (USD MILLION)


TABLE 193
LATIN AMERICA: MICROFLUIDICS MARKET, BY APPLICATION, 2023–2030 (USD MILLION)


TABLE 194
LATIN AMERICA: MICROFLUIDICS MARKET FOR IVD APPLICATIONS, BY TYPE, 2023–2030 (USD MILLION)


TABLE 195
LATIN AMERICA: MICROFLUIDICS MARKET FOR PHARMACEUTICAL & LIFE SCIENCE RESEARCH, BY TYPE, 2023–2030 (USD MILLION)


TABLE 196
LATIN AMERICA: MICROFLUIDICS MARKET FOR LAB ANALYTICS, BY TYPE, 2023–2030 (USD MILLION)


TABLE 197
LATIN AMERICA: MICROFLUIDICS MARKET FOR THERAPEUTICS, BY TYPE, 2023–2030 (USD MILLION)


TABLE 198
LATIN AMERICA: MICROFLUIDICS MARKET, BY END USER, 2023–2030 (USD MILLION)


TABLE 199
BRAZIL: MICROFLUIDICS MARKET, BY PRODUCT, 2023–2030 (USD MILLION)


TABLE 200
BRAZIL: MICROFLUIDIC-BASED DEVICES MARKET, BY DEVICE, 2023–2030 (USD MILLION)


TABLE 201
BRAZIL: MICROFLUIDIC COMPONENTS MARKET, BY TYPE, 2023–2030 (USD MILLION)


TABLE 202
BRAZIL: MICROFLUIDIC COMPONENTS MARKET, BY MATERIAL, 2023–2030 (USD MILLION)


TABLE 203
MEXICO: MICROFLUIDICS MARKET, BY PRODUCT, 2023–2030 (USD MILLION)


TABLE 204
MEXICO: MICROFLUIDIC-BASED DEVICES MARKET, BY DEVICE, 2023–2030 (USD MILLION)


TABLE 205
MEXICO: MICROFLUIDIC COMPONENTS MARKET, BY TYPE, 2023–2030 (USD MILLION)


TABLE 206
MEXICO: MICROFLUIDIC COMPONENTS MARKET, BY MATERIAL, 2023–2030 (USD MILLION)


TABLE 207
REST OF LATIN AMERICA: MICROFLUIDICS MARKET, BY PRODUCT, 2023–2030 (USD MILLION)


TABLE 208
REST OF LATIN AMERICA: MICROFLUIDIC-BASED DEVICES MARKET, BY DEVICE, 2023–2030 (USD MILLION)


TABLE 209
REST OF LATIN AMERICA: MICROFLUIDIC COMPONENTS MARKET, BY TYPE, 2023–2030 (USD MILLION)


TABLE 210
REST OF LATIN AMERICA: MICROFLUIDIC COMPONENTS MARKET, BY MATERIAL, 2023–2030 (USD MILLION)


TABLE 211
MIDDLE EAST & AFRICA: MICROFLUIDICS MARKET, BY COUNTRY, 2023–2030 (USD MILLION)


TABLE 212
MIDDLE EAST & AFRICA: MICROFLUIDICS MARKET, BY PRODUCT, 2023–2030 (USD MILLION)


TABLE 213
MIDDLE EAST & AFRICA: MICROFLUIDIC-BASED DEVICES MARKET, BY DEVICE, 2023–2030 (USD MILLION)


TABLE 214
MIDDLE EAST & AFRICA: MICROFLUIDIC COMPONENTS MARKET, BY TYPE, 2023–2030 (USD MILLION)


TABLE 215
MIDDLE EAST & AFRICA: MICROFLUIDIC COMPONENTS MARKET, BY MATERIAL, 2023–2030 (USD MILLION)


TABLE 216
MIDDLE EAST & AFRICA: MICROFLUIDICS MARKET, BY APPLICATION, 2023–2030 (USD MILLION)


TABLE 217
MIDDLE EAST & AFRICA: MICROFLUIDICS MARKET FOR IVD APPLICATIONS, BY TYPE, 2023–2030 (USD MILLION)


TABLE 218
MIDDLE EAST & AFRICA: MICROFLUIDICS MARKET FOR PHARMACEUTICAL & LIFE SCIENCE RESEARCH, BY TYPE, 2023–2030 (USD MILLION)


TABLE 219
MIDDLE EAST & AFRICA: MICROFLUIDICS MARKET FOR LAB ANALYTICS, BY TYPE, 2023–2030 (USD MILLION)


TABLE 220
MIDDLE EAST & AFRICA: MICROFLUIDICS MARKET FOR THERAPEUTICS, BY TYPE, 2023–2030 (USD MILLION)


TABLE 221
MIDDLE EAST & AFRICA: MICROFLUIDICS MARKET, BY END USER, 2023–2030 (USD MILLION)


TABLE 222
GCC COUNTRIES: MICROFLUIDICS MARKET, BY PRODUCT, 2023–2030 (USD MILLION)


TABLE 223
GCC COUNTRIES: MICROFLUIDIC-BASED DEVICES MARKET, BY DEVICE, 2023–2030 (USD MILLION)


TABLE 224
GCC COUNTRIES: MICROFLUIDIC COMPONENTS MARKET, BY TYPE, 2023–2030 (USD MILLION)


TABLE 225
GCC COUNTRIES: MICROFLUIDIC COMPONENTS MARKET, BY MATERIAL, 2023–2030 (USD MILLION)


TABLE 226
REST OF MIDDLE EAST & AFRICA: MICROFLUIDICS MARKET, BY PRODUCT, 2023–2030 (USD MILLION)


TABLE 227
REST OF MIDDLE EAST & AFRICA: MICROFLUIDIC-BASED DEVICES MARKET, BY DEVICE, 2023–2030 (USD MILLION)


TABLE 228
REST OF MIDDLE EAST & AFRICA: MICROFLUIDIC COMPONENTS MARKET, BY TYPE, 2023–2030 (USD MILLION)


TABLE 229
REST OF MIDDLE EAST & AFRICA: MICROFLUIDIC COMPONENTS MARKET, BY MATERIAL, 2023–2030 (USD MILLION)


TABLE 230
OVERVIEW OF STRATEGIES DEPLOYED BY KEY MANUFACTURING COMPANIES


TABLE 231
MICROFLUIDICS MARKET: DEGREE OF COMPETITION


TABLE 232
MICROFLUIDICS MARKET: REGION FOOTPRINT


TABLE 233
MICROFLUIDICS MARKET: PRODUCT FOOTPRINT


TABLE 234
MICROFLUIDICS MARKET: APPLICATION FOOTPRINT


TABLE 235
MICROFLUIDICS MARKET: END USER FOOTPRINT


TABLE 236
MICROFLUIDICS MARKET: LIST OF KEY STARTUP/SME PLAYERS


TABLE 237
MICROFLUIDICS MARKET: COMPETITIVE BENCHMARKING OF KEY STARTUPS/SMES


TABLE 238
MICROFLUIDICS MARKET: PRODUCT LAUNCHES & APPROVALS, JANUARY 2022−NOVEMBER 2025


TABLE 239
MICROFLUIDICS MARKET: DEALS, JANUARY 2022–NOVEMBER 2025


TABLE 240
MICROFLUIDICS MARKET: EXPANSIONS, JANUARY 2022–NOVEMBER 2025


TABLE 241
MICROFLUIDICS MARKET: OTHER DEVELOPMENTS, JANUARY 2022−NOVEMBER 2025


TABLE 242
DANAHER CORPORATION: COMPANY OVERVIEW


TABLE 243
DANAHER CORPORATION: PRODUCTS OFFERED


TABLE 244
DANAHER CORPORATION: DEALS


TABLE 245
DANAHER CORPORATION: EXPANSIONS


TABLE 246
ILLUMINA, INC.: COMPANY OVERVIEW


TABLE 247
ILLUMINA, INC.: PRODUCTS OFFERED


TABLE 248
ILLUMINA, INC.: PRODUCT LAUNCHES


TABLE 249
ILLUMINA, INC.: DEALS


TABLE 250
BIOMÉRIEUX: COMPANY OVERVIEW


TABLE 251
BIOMÉRIEUX: PRODUCTS OFFERED


TABLE 252
BIOMÉRIEUX: PRODUCT LAUNCHES/APPROVALS


TABLE 253
BIOMÉRIEUX: DEALS


TABLE 254
THERMO FISHER SCIENTIFIC INC.: COMPANY OVERVIEW


TABLE 255
THERMO FISHER SCIENTIFIC INC.: PRODUCTS OFFERED


TABLE 256
THERMO FISHER SCIENTIFIC INC.: PRODUCT LAUNCHES/APPROVALS


TABLE 257
THERMO FISHER SCIENTIFIC INC.: DEALS


TABLE 258
ABBOTT LABORATORIES: COMPANY OVERVIEW


TABLE 259
ABBOTT LABORATORIES: PRODUCTS OFFERED


TABLE 260
PARKER HANNIFIN CORP: COMPANY OVERVIEW


TABLE 261
PARK HANNIFIN CORP: PRODUCTS OFFERED


TABLE 262
SMC CORPORATION: COMPANY OVERVIEW


TABLE 263
SMC CORPORATION: PRODUCTS OFFERED


TABLE 264
SMC CORPORATION: PRODUCT LAUNCHES


TABLE 265
IDEX CORPORATION: COMPANY OVERVIEW


TABLE 266
IDEX CORPORATION: PRODUCTS OFFERED


TABLE 267
IDEX CORPORATION: DEALS


TABLE 268
FORTIVE: COMPANY OVERVIEW


TABLE 269
FORTIVE: PRODUCTS OFFERED


TABLE 270
REVVITY, INC.: COMPANY OVERVIEW


TABLE 271
REVVITY, INC.: PRODUCTS OFFERED


TABLE 272
REVVITY, INC.: DEALS


TABLE 273
AGILENT TECHNOLOGIES, INC.: COMPANY OVERVIEW


TABLE 274
AGILENT TECHNOLOGIES, INC.: PRODUCTS OFFERED


TABLE 275
AGILENT TECHNOLOGIES, INC. : PRODUCT APPROVALS/LAUNCHES


TABLE 276
AGILENT TECHNOLOGIES, INC.: DEALS


TABLE 277
AGILENT TECHNOLOGIES, INC.: EXPANSIONS


TABLE 278
BIO-RAD LABORATORIES, INC.: COMPANY OVERVIEW


TABLE 279
BIO-RAD LABORATORIES, INC.: PRODUCTS OFFERED


TABLE 280
BIO-RAD LABORATORIES, INC.: PRODUCT LAUNCHES


TABLE 281
BIO-RAD LABORATORIES, INC.: DEALS


TABLE 282
BECTON, DICKINSON AND COMPANY: COMPANY OVERVIEW


TABLE 283
BECTON, DICKINSON AND COMPANY: PRODUCTS OFFERED


TABLE 284
BECTON, DICKINSON AND COMPANY: PRODUCT LAUNCHES/APPROVALS,


TABLE 285
BECTON, DICKINSON AND COMPANY: DEALS


TABLE 286
BECTON, DICKINSON AND COMPANY: EXPANSIONS


TABLE 287
F. HOFFMANN-LA ROCHE LTD.: COMPANY OVERVIEW


TABLE 288
F. HOFFMANN-LA ROCHE LTD.: PRODUCTS OFFERED


TABLE 289
F. HOFFMANN-LA ROCHE LTD.: PRODUCT LAUNCHES/APPROVALS,


TABLE 290
F. HOFFMANN-LA ROCHE LTD.: DEALS


TABLE 291
STANDARD BIOTOOLS: COMPANY OVERVIEW


TABLE 292
STANDARD BIOTOOLS: PRODUCTS OFFERED


TABLE 293
STANDARD BIOTOOLS: PRODUCT LAUNCHES/APPROVALS


TABLE 294
STANDARD BIOTOOLS: DEALS


TABLE 295
QUIDELORTHO CORPORATION: COMPANY OVERVIEW


TABLE 296
QUIDELORTHO CORPORATION: PRODUCTS OFFERED


TABLE 297
QUIDELORTHO CORPORATION: PRODUCT APPROVALS


TABLE 298
QUIDELORTHO CORPORATION: DEALS


TABLE 299
QUIDELORTHO CORPORATION: EXPANSIONS


TABLE 300
AIGNEP S.P.A.: COMPANY OVERVIEW


TABLE 301
AIGNEP S.P.A.: PRODUCTS OFFERED


TABLE 302
AIGNEP S.P.A.: DEALS


TABLE 303
DOLOMITE MICROFLUIDICS: COMPANY OVERVIEW


TABLE 304
DOLOMITE MICROFLUIDICS: PRODUCTS OFFERED


TABLE 305
DOLOMITE MICROFLUIDICS: PRODUCT LAUNCHES


TABLE 306
DOLOMITE MICROFLUIDICS: DEALS


TABLE 307
DOLOMITE MICROFLUIDICS: OTHER DEVELOPMENTS


TABLE 308
ELVEFLOW: COMPANY OVERVIEW


TABLE 309
ELVEFLOW: PRODUCTS OFFERED


TABLE 310
NANOSTRING TECHNOLOGIES: COMPANY OVERVIEW


TABLE 311
INNOVATIVE BIOCHIPS, LLC: COMPANY OVERVIEW


TABLE 312
FLUIDIC ANALYTICS: COMPANY OVERVIEW


TABLE 313
HORIBA: COMPANY OVERVIEW


TABLE 314
MICRONIT B.V.: COMPANY OVERVIEW


TABLE 315
EMULATE, INC.: COMPANY OVERVIEW


TABLE 316
SPHERE BIO: COMPANY OVERVIEW


TABLE 317
ZEON CORPORATION: COMPANY OVERVIEW


TABLE 318
QIAGEN N.V.: COMPANY OVERVIEW


LIST OF FIGURES


FIGURE 1
MICROFLUIDICS MARKET SEGMENTATION


FIGURE 2
MARKET SCENARIO


FIGURE 3
GLOBAL MICROFLUIDICS MARKET, 2022–2030


FIGURE 4
MAJOR STRATEGIES ADOPTED BY KEY PLAYERS IN MICROFLUIDICS MARKET, 2020–2025


FIGURE 5
DISRUPTIONS INFLUENCING GROWTH OF MICROFLUIDICS MARKET


FIGURE 6
HIGH-GROWTH SEGMENTS IN MICROFLUIDICS MARKET, 2025–2030


FIGURE 7
ASIA PACIFIC TO REGISTER HIGHEST CAGR IN MICROFLUIDICS MARKET, IN TERMS OF VALUE, DURING FORECAST PERIOD


FIGURE 8
RISING ADOPTION OF LAB-ON-A-CHIP TECHNOLOGIES TO DRIVE MARKET


FIGURE 9
NORTH AMERICA TO COMMAND LARGEST MARKET SHARE IN 2030


FIGURE 10
NORTH AMERICA AND HOSPITALS & DIAGNOSTIC CENTERS ACCOUNTED FOR LARGEST MARKET SHARES IN 2024


FIGURE 11
CHINA TO REGISTER FASTEST GROWTH FROM 2025 TO 2030


FIGURE 12
MICROFLUIDICS MARKET: DRIVERS, RESTRAINTS, OPPORTUNITIES, AND CHALLENGES


FIGURE 13
PATENT ANALYSIS FOR MICROFLUIDICS MARKET, JANUARY 2015–NOVEMBER 2025


FIGURE 14
KEY AI USE CASES IN MICROFLUIDICS MARKET


FIGURE 15
US: REGULATORY PROCESS FOR TESTING DEVICES ASSOCIATED WITH MICROFLUIDICS TECHNOLOGY


FIGURE 16
CANADA: REGULATORY PROCESS FOR MICROFLUIDICS-ASSOCIATED IVD DEVICES


FIGURE 17
EUROPE: REGULATORY PROCESS FOR IVD DEVICES


FIGURE 18
INDIA: REGULATORY PROCESS FOR IVD DEVICES


FIGURE 19
INFLUENCE OF KEY STAKEHOLDERS ON BUYING PROCESS FOR MICROFLUIDIC COMPONENTS, BY MATERIAL


FIGURE 20
KEY BUYING CRITERIA FOR MICROFLUIDIC COMPONENTS, BY MATERIAL


FIGURE 21
MICROFLUIDICS MARKET: UNMET NEED ANALYSIS


FIGURE 22
MICROFLUIDICS MARKET: PORTER’S FIVE FORCES ANALYSIS


FIGURE 23
MICROFLUIDICS MARKET: VALUE CHAIN ANALYSIS


FIGURE 24
MICROFLUIDICS MARKET: ECOSYSTEM ANALYSIS


FIGURE 25
AVERAGE SELLING PRICE TREND OF MICROFLUIDIC COMPONENTS, BY REGION, 2023–2025 (USD)


FIGURE 26
AVERAGE SELLING PRICE TREND OF MICROFLUIDIC COMPONENTS, BY KEY PLAYERS, 2024 (USD)


FIGURE 27
MICROFLUIDICS MARKET: TRENDS/DISRUPTIONS IMPACTING CUSTOMER BUSINESS


FIGURE 28
MICROFLUIDICS MARKET: FUNDING AND NUMBER OF DEALS, 2019–2023 (USD MILLION)


FIGURE 29
NUMBER OF DEALS IN MICROFLUIDICS MARKET, BY KEY PLAYERS, 2019–2023


FIGURE 30
VALUE OF DEALS IN MICROFLUIDICS MARKET, BY KEY PLAYERS, 2019–2023 (USD)


FIGURE 31
NORTH AMERICA: MICROFLUIDICS MARKET SNAPSHOT


FIGURE 32
ASIA PACIFIC: MICROFLUIDICS MARKET SNAPSHOT


FIGURE 33
REVENUE ANALYSIS OF KEY PLAYERS IN MICROFLUIDICS MARKET (2022−2024)


FIGURE 34
MARKET SHARE ANALYSIS OF KEY PLAYERS IN MICROFLUIDICS MARKET (2024)


FIGURE 35
RANKING OF KEY PLAYERS IN MICROFLUIDICS MARKET, 2024


FIGURE 36
MICROFLUIDICS MARKET: COMPANY EVALUATION MATRIX (KEY PLAYERS), 2024


FIGURE 37
MICROFLUIDICS MARKET: COMPANY FOOTPRINT


FIGURE 38
MICROFLUIDICS MARKET: COMPANY EVALUATION MATRIX (STARTUPS/SMES), 2024


FIGURE 39
EV/EBITDA OF KEY VENDORS, 2025


FIGURE 40
YEAR-TO-DATE (YTD) PRICE, TOTAL RETURN, AND 5-YEAR STOCK BETA OF KEY VENDORS, 2025


FIGURE 41
MICROFLUIDICS MARKET: BRAND/PRODUCT COMPARATIVE ANALYSIS


FIGURE 42
DANAHER CORPORATION: COMPANY SNAPSHOT


FIGURE 43
ILLUMINA, INC.: COMPANY SNAPSHOT


FIGURE 44
BIOMÉRIEUX: COMPANY SNAPSHOT


FIGURE 45
THERMO FISHER SCIENTIFIC INC.: COMPANY SNAPSHOT


FIGURE 46
ABBOTT LABORATORIES: COMPANY SNAPSHOT


FIGURE 47
PARKER HANNIFIN CORP: COMPANY SNAPSHOT


FIGURE 48
SMC CORPORATION: COMPANY SNAPSHOT (2024)


FIGURE 49
IDEX CORPORATION: COMPANY SNAPSHOT


FIGURE 50
FORTIVE: COMPANY SNAPSHOT


FIGURE 51
REVVITY, INC.: COMPANY SNAPSHOT


FIGURE 52
AGILENT TECHNOLOGIES, INC.: COMPANY SNAPSHOT


FIGURE 53
BIO-RAD LABORATORIES, INC.: COMPANY SNAPSHOT


FIGURE 54
BECTON, DICKINSON AND COMPANY: COMPANY SNAPSHOT


FIGURE 55
F. HOFFMANN-LA ROCHE LTD.: COMPANY SNAPSHOT


FIGURE 56
STANDARD BIOTOOLS: COMPANY SNAPSHOT


FIGURE 57
QUIDELORTHO CORPORATION: COMPANY SNAPSHOT


FIGURE 58
MICROFLUIDICS MARKET: RESEARCH DATA


FIGURE 59
MICROFLUIDICS MARKET: RESEARCH DESIGN


FIGURE 60
PRIMARY SOURCES


FIGURE 61
BREAKDOWN OF PRIMARY INTERVIEWS: BY COMPANY TYPE, DESIGNATION, AND REGION


FIGURE 62
BREAKDOWN OF PRIMARY INTERVIEWS: SUPPLY-SIDE AND DEMAND-SIDE PARTICIPANTS


FIGURE 63
RESEARCH METHODOLOGY: HYPOTHESIS BUILDING


FIGURE 64
MICROFLUIDICS MARKET SIZE ESTIMATION: APPROACH 1 (COMPANY REVENUE ESTIMATION)


FIGURE 65
MICROFLUIDICS MARKET SIZE ESTIMATION: BOTTOM-UP APPROACH


FIGURE 66
MARKET SIZE ESTIMATION: TOP-DOWN APPROACH


FIGURE 67
DATA TRIANGULATION


Methodology

Four main studies were done to estimate the market size of microfluidics. Secondary research was carried out to obtain data associated with the market, peer markets, and parent markets. After that, data was obtained from 3-5 secondary sources; the findings, assumptions, and sizing were confirmed through primary sources. Top-down and bottom-up approaches were utilized to gain insights on complete market size. After that, market breakdown and data triangulation were used to determine the market size of segments and subsegments.

Secondary Research

Directories, databases like D&B Hoovers, Factiva, white papers, Bloomberg Businessweek, annual reports, SEC filings, business filings and investor presentations are few of the important sources used in the secondary research. This helps in gaining fundamental details about prominent companies and market segmentation as per the industry trends at numerous levels and technological viewpoints related with the Microfluidics market.

Primary Research

The primary research compromised performing interviews from both the supply and demand sides to obtain quantitative and qualitative data. CEOs, area sales managers, territory sales managers, regional sales managers and other important officials from top businesses are the primary sources from the supply side. Physicians, researchers, department heads, and staff members from diagnostic centers, hospitals and research institutes were the primary sources from the demand side. The target of this study was to verify the conclusions and assumptions from secondary research by interacting with stakeholders directly.

A breakdown of the primary respondents is provided below:

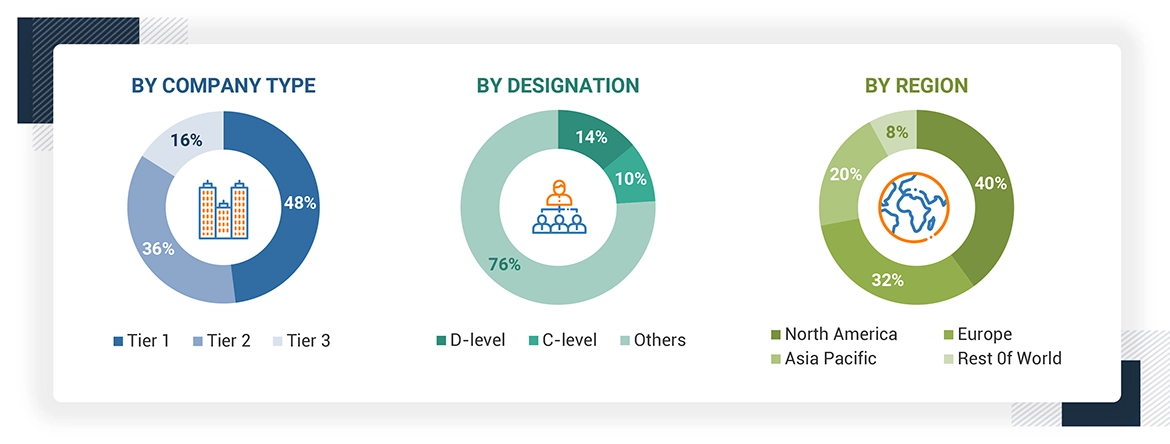
*Others include sales managers, marketing managers, business development managers, product managers, distributors, and suppliers.

Note: Companies are classified into tiers based on their total revenue. As of 2023, Tier 1 = >USD 1 billion, Tier 2 = < USD 500 million, and Tier 3 = < USD 100 million.

To know about the assumptions considered for the study, download the pdf brochure

Market Size Estimation

The revenue share analysis of the major key players for the size of the Microfluidics market is given in this study. Primary and secondary research are used to find prominent players in the Microfluidics and to gain insights of their financials and market share. The primary research approach comprises extremely in-depth interviews with CEOs, directors, and senior marketing executives, while the secondary research procedure mostly relied on the annual and financial reports of major players. Segment-based technique was used to determine the global market value. The revenue details of significant solution and service suppliers was then applied to source these segmented revenues.

The steps in the procedure  are

  • List the key global companies that are associated with the Microfluidics industry. Note the annual revenues of the players in the Microfluidics industry or the product category/business division.
  • As of 2024, it represents an important portion of the market based on revenue mapping of the key competitors. Extrapolation to the global value for the Microfluidics market.
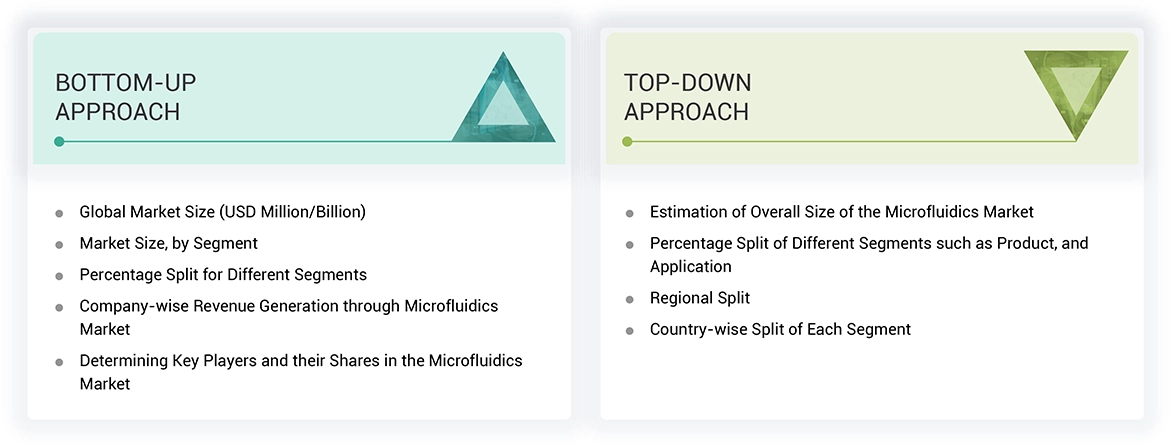
Data Triangulation

The Microfluidics market was categorized into various segments and subsegments with the help of the above procedure. Then, data triangulation and the market segmentation process are carried out to ensure the accuracy of the data for each segment. Factors and trends from demand and supply sides were studied . Top-down and bottom-up approaches provide the outcome from the analysis of the Microfluidics market.

Market Definition

The microfluidics market includes products and technologies that are developed to analyse and regulate fluid volume through microfluidic devices and components. The market covers both the microfluidics components that are important for the working of microfluidics-based devices, such as lab-on-a-chip systems and diagnostic assays, as well as the devices. Microneedles, micropumps, flow and pressure sensors, controllers, and microfluidic valves are some of the important components of microfluidics-based device.Polymers, silicon, and glass are most often used in the development of these components. The market provides innovative technologies for effective and precise fluid management and analysis, which have beneficial applications in research and diagnostics.

Stakeholders

  • Microfluidic product manufacturers
  • Microfluidic product distributors
  • Pharmaceutical companies
  • IVD manufacturers
  • In vitro diagnostic test (IVD) distributors
  • Research institutes
  • Contract manufacturing organizations (CMOs)
  • Contract research organizations (CROs)
  • Healthcare institutions (hospitals, medical schools, and outpatient clinics)
  • Government associations
  • Market research and consulting firms
  • Venture capitalists and investors

Report Objectives

  • To define, describe, and forecast the microfluidics market by product, application, end-user, and region
  • To provide detailed information about the key factors influencing the market growth, such as drivers, restraints, opportunities, challenges, and industry trends
  • To strategically analyze the regulatory scenario, Porter’s five force analysis, value chain analysis, supply chain analysis, ecosystem map, and patent analysis
  • To analyze micromarkets with respect to individual growth trends, prospects, and contributions to the microfluidics market
  • To analyze market opportunities for stakeholders and provide details of the competitive landscape for key players
  • To profile the prominent players in this market and comprehensively analyze their market shares and core competencies
  • To strategically analyze the microfluidics market in five regions: North America, Europe, the Asia Pacific, Latin America, and the Middle East & Africa
  • To track and analyze competitive developments such as acquisitions, product launches, product approvals, partnerships, and expansions in the microfluidics market


Personalize This Research

  • Triangulate with your Own Data
  • Get Data as per your Format and Definition
  • Gain a Deeper Dive on a Specific Application, Geography, Customer or Competitor
  • Any level of Personalization
Request A Free Customisation

Let Us Help You

  • What are the Known and Unknown Adjacencies Impacting the Microfluidics Market
  • What will your New Revenue Sources be?
  • Who will be your Top Customer; what will make them switch?
  • Defend your Market Share or Win Competitors
  • Get a Scorecard for Target Partners
Customized Workshop Request

Custom Market Research Services

We Will Customise The Research For You, In Case The Report Listed Above Does Not Meet With Your Requirements

Get 10% Free Customisation

Growth opportunities and latent adjacency in Microfluidics Market

Farrah

May, 2022

Which material segment led the global microfluidics market?.

Kahlill

May, 2022

Which application accounted for the largest microfluidics market share?.

Alex

Nov, 2022

Which technology accounted for the highest share in the microfluidics market?.

James

Nov, 2022

What is the global microfluidics market's expected compound annual growth rate during the forecast period of 2022-2030?.

Philip

Mar, 2022

Which are the key challenges faced by global players of the Microfluidics Market?.

DMCA.com Protection Status