Service Analytics Market by Business Application (Customer Service Analytics, Field Service Analytics, and IT Service Analytics), Component (Solution and Services), Deployment Model, Organization Size, Industry, and Region - Global Forecast to 2023


[149 Pages Report] The service analytics market is expected to grow from USD 437.0 million in 2017 to USD 1,056.1 million by 2023, at a Compound Annual Growth Rate (CAGR) of 14.1% during the forecast period. The base year considered for this report is 2017, and the market forecast period is 2018�2023. Factors, such as the increasing business need for better customer and client interaction, and the competitive pressure to become more data-driven drive the market growth.
Objectives of the Study
The major objective of the report is to define, describe, and forecast the global service analytics market by component, business application, deployment model, organization size, industry, and region. The report provides detailed information related to the key factors (drivers, restraints, opportunities, and challenges) influencing the growth of the market. The report aims to strategically analyze micromarkets with respect to the individual growth trends, prospects, and contributions to the total market. The report attempts to forecast the market size with respect to 5 major regions, namely, North America, Europe, Asia Pacific (APAC), Middle East and Africa (MEA), and Latin America. The report strategically profiles the key players and comprehensively analyzes their core competencies. Additionally, it tracks and analyzes competitive developments, such as partnerships, collaborations, and agreements; mergers and acquisitions; new product launches and developments; and Research and Development (R&D) activities in the service analytics market.
Research Methodology
The research methodology used to estimate and forecast the service analytics market begins with capturing the data on the key vendor revenues through secondary research, which includes directories and databases, such as D&B Hoovers, Bloomberg Businessweek, and Factiva. Vendor offerings have also been taken into consideration to determine the market segmentation. The bottom-up procedure was employed to arrive at the overall size of the global service analytics market that was derived from the revenue of the key players in the market. After arriving at the overall market size, the total market was split into several segments and subsegments, which were then verified through primary research by conducting extensive interviews with key people, such as Chief Executive Officers (CEOs), Vice Presidents (VPs), directors, and executives. The data triangulation and market breakdown procedures were employed to complete the overall market engineering process and arrive at the exact statistics for all segments and subsegments.
The breakdown of profiles of primary participants is depicted in the figure below:
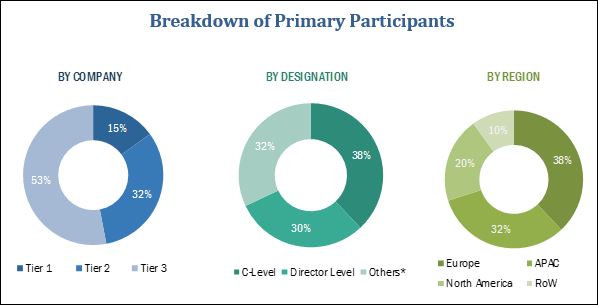
To know about the assumptions considered for the study, download the pdf brochure
The service analytics market includes an expansive number of vendors providing solution and services, such as Oracle (US), Salesforce (US), ServiceNow (US), SAP (Germany), SAS (US), Tableau (US), Microsoft (US), ClickSoftware (US), Centina Systems (US), Paskon (US), Numerify (US), Field Squared (US), Helpshift (US), Aureus Analytics (Singapore), NetEnrich (US), BlueFletch (US), mobi corp (US), DataHero (US), Agile CRM (US), Sisense (US), and MicroStrategy (US).
Key Target Audience:
- Application developers
- Services analytics providers
- Third-party vendors
- Independent Software Vendors (ISVs)
- Enterprises
- End-users
�The study answers several questions for the stakeholders, primarily which market segments to focus on in the next 2�5 years for prioritizing efforts and investments.�
Scope of the Report
The research report categorizes the service analytics market to forecast revenues and analyze trends in each of the following subsegments:
By Business Application
- Field service analytics
- Customer service analytics
- (IT) service analytics
By Component
- Solution
- Services
By Deployment Model
- On-premises
- Cloud
By Organization Size
- Small and Medium-sized Enterprises (SMEs)
- Large enterprises
By Industry
- BFSI
- Retail and eCommerce
- Healthcare
- Government and defense
- Telecommunications
- Manufacturing
- Energy and utilities
- Others (education, automotive, media and entertainment, and travel and hospitality)
By Region
- North America
- Europe
- APAC
- MEA
- Latin America
Available Customizations
With the given market data, MarketsandMarkets offers customizations as per the company�s specific needs. The following customization options are available for the report:
Product Analysis
- Product matrix gives a detailed comparison of the product portfolio of each company
Company Information
- Detailed analysis and profiling of additional market players up to 5
The service analytics market is expected to grow from USD 546.4 million in 2018 to USD 1,056.1 million by 2023, at a Compound Annual Growth Rate (CAGR) of 14.1% during the forecast period. Factors, such as the rise in the need for constant and effective interaction with customers to ensure prompt and proficient services and competitive pressure to become more data-driven are expected to drive the growth of the global market.
The report provides detailed insights into the global service analytics market, which is segmented by business application, component, deployment model, organization size, industry, and region. Among business applications, the customer service analytics segment is expected to continue to dominate the market during the forecast period. With the growing business competition, it has become mandatory to capture new and retain the old customers; customer satisfaction is at the top of every organization�s check-list. Crucial industries, such as retail and eCommerce, travel and hospitality, healthcare, and BFSI, are investing in augmenting their customer services. Furthermore, due to the wide adoption of the service analytics solution by large enterprises, as well as SMEs which is helping them to understand customer interests and preferences. With the advanced service analytics capabilities, organizations can identify the causes of customer service issues in real time. Customer service analytics is followed by the field service analytics in terms of market share, as field service companies can predict failures and take proactive maintenance, resulting in the reduced cost in the long run and increased customer experience by using advanced analytics.
In the component segment, the solution segment is expected to account for the larger market share during the forecast period. The demand for the service analytics solution is rising, as organizations need to capture and analyze the service system data for enhancing the customer experience and maintaining the business continuity.
Among deployment models, the cloud segment is expected to witness a higher CAGR during the forecast period, owing to its cost-effectiveness, scalability, and ease of deployment. The large enterprises segment is projected to dominate the market in terms of market share during the forecast period, as these enterprises are keenly focusing on efficient data management to drive the business growth. However, the Small and Medium-sized Enterprises (SMEs) segment is expected to exhibit a higher CAGR, due to the easy availability and scalability of cloud-based deployment models.
The retail and eCommerce industry is expected to account for the largest market size during the forecast period. This industry is exhibiting new growth opportunities coupled with the rapid digital initiatives. Moreover, companies operating in this industry greatly rely on the past data to analyze any customer behavior for delivering the required level of customer satisfaction. The service data generated is used to predict and avoid any future breakdowns, thereby enhancing the customer experience. Additionally, deploying service analytics over the cloud helps in cutting excessive costs while providing improved agility and scalability, and overcoming the operational challenges. Moreover, it is expected to witness the highest CAGR during the forecast period, due to the need for consolidation of customer data generated across various touchpoints during the customer�s lifecycle.
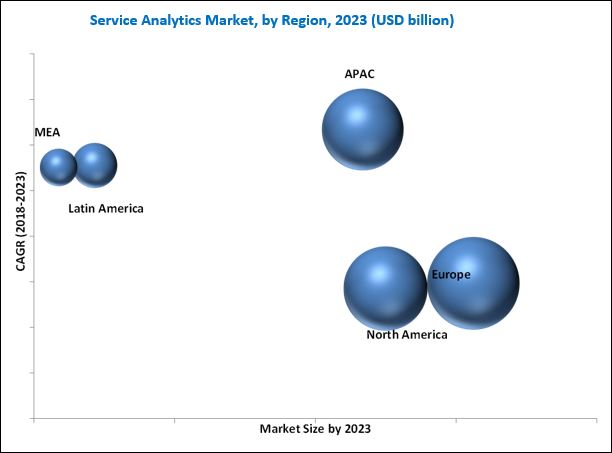
The report covers all the major aspects of the service analytics market and provides an in-depth analysis across regions of North America, Europe, Asia Pacific (APAC), Middle East and Africa (MEA), and Latin America. North America dominates the global market due to the direct presence of the majority of the service analytics vendors. APAC is expected to grow at the highest CAGR during the forecast period, due to the growing adoption of service analytics solution and services among SMEs with the rising digitalization and increasing adoption of Internet of Things (IoT)-based technologies. However, the outdated IT infrastructure and the lack of awareness about the benefits of the service analytics solution are the factors responsible for restraining the market growth. The growing inclination of SMEs toward the adoption of the service analytics solution and the emergence of Artificial Intelligence (AI) are expected to create lucrative market opportunities.
The global service analytics market is fragmented in nature, as no single vendor dominates the market. Vendors that offer service analytics solution and services include Oracle (US), Salesforce (US), ServiceNow (US), SAP (Germany), SAS (US), Tableau (US), Microsoft (US), ClickSoftware (US), Centina Systems (US), Paskon (US), Numerify (US), Field Squared (US), Helpshift (US), Aureus Analytics (Singapore), NetEnrich (US), BlueFletch (US), mobi corp (US), DataHero (US), AgileCRM (US), Sisense (US), and MicroStrategy (US). These vendors have adopted different types of organic and inorganic growth strategies, such as new product launches, partnerships and collaborations, expansions, and acquisitions, to expand their offerings in the service analytics market.
To speak to our analyst for a discussion on the above findings, click Speak to Analyst
 Exclusive indicates content/data unique to MarketsandMarkets and not available with any competitors.
Table of Contents
1 Introduction (Page No. - 17)
1.1 Objectives of the Study
1.2 Market Definition
1.3 Market Scope
1.4 Years Considered for the Study
1.5 Currency
1.6 Stakeholders
2 Research Methodology (Page No. - 20)
2.1 Research Data
2.1.1 Secondary Data
2.1.2 Primary Data
2.1.2.1 Breakdown of Primaries
2.1.2.2 Key Industry Insights
2.2 Market Size Estimation
2.3 Research Assumptions
2.4 Limitations
3 Executive Summary (Page No. - 27)
4 Premium Insights (Page No. - 31)
4.1 Attractive Market Opportunities in the Service Analytics Market
4.2 Market Share Across Regions
4.3 Market Top 4 Industries and Regions
5 Market Overview and Industry Trends (Page No. - 33)
5.1 Market Overview
5.2 Market Dynamics
5.2.1 Drivers
5.2.1.1 Need for Better Client and Customer Interaction
5.2.1.2 Competitive Pressure to Become More Data-Driven
5.2.2 Restraints
5.2.2.1 Outdated IT Infrastructure
5.2.2.2 Lack of Awareness of Service Analytics
5.2.3 Opportunities
5.2.3.1 Emergence of Ai-Powered Customer Services
5.2.3.2 High Adoption of Analytics Among SMEs
5.2.4 Challenges
5.2.4.1 Complex and Ineffective Data Management
5.3 Industry Trends
5.3.1 Service Analytics Market: Regulations
5.3.1.1 General Data Protection Regulation
5.3.1.2 Consumer Protection Act
5.3.2 Service Analytics Market: Use Cases
5.3.2.1 Use Case 1: Service Excellence Success Story for Johnson & Johnson Surgical Vision
5.3.2.2 Use Case 2: to Consistently Optimize Business Processes of Flyerline, By Coresystems
5.3.2.3 Use Case 3: Initiative to Focus on Five-Star Services Experience By A Global Appliance Manufacturer
6 Market By Business Application (Page No. - 38)
6.1 Introduction
6.2 Customer Service Analytics
6.3 Field Service Analytics
6.4 IT Service Analytics
7 Service Analytics Market, By Component (Page No. - 43)
7.1 Introduction
7.2 Solution
7.3 Services
7.3.1 Managed Services
7.3.2 Professional Services
7.3.2.1 Support and Maintenance
7.3.2.2 Consulting
8 Service Analytics Market, By Deployment Model (Page No. - 51)
8.1 Introduction
8.2 On-Premises
8.3 Cloud
9 Market By Organization Size (Page No. - 55)
9.1 Introduction
9.2 Large Enterprises
9.3 Small and Medium-Sized Enterprises
10 Service Analytics Market, By Industry (Page No. - 59)
10.1 Introduction
10.2 Banking, Financial Services, and Insurance
10.3 Retail and Ecommerce
10.4 Healthcare
10.5 Government and Defense
10.6 Telecommunications
10.7 Manufacturing
10.8 Energy and Utilities
10.9 Others
11 Service Analytics Market, By Region (Page No. - 69)
11.1 Introduction
11.2 North America
11.2.1 By Country
11.2.1.1 United States
11.2.1.2 Canada
11.2.2 By Component
11.2.3 By Service
11.2.4 By Professional Service
11.2.5 By Business Application
11.2.6 By Deployment Model
11.2.7 By Organization Size
11.2.8 By Industry
11.3 Europe
11.3.1 By Country
11.3.1.1 United Kingdom
11.3.1.2 Germany
11.3.1.3 France
11.3.1.4 Rest of Europe
11.3.2 By Component
11.3.3 By Service
11.3.4 By Professional Service
11.3.5 By Business Application
11.3.6 By Deployment Model
11.3.7 By Organization Size
11.3.8 By Industry
11.4 Asia Pacific
11.4.1 By Country
11.4.1.1 China
11.4.1.2 Singapore
11.4.1.3 South Korea
11.4.1.4 Rest of Asia Pacific
11.4.2 By Component
11.4.3 By Service
11.4.4 By Professional Service
11.4.5 By Business Application
11.4.6 By Deployment Model
11.4.7 By Organization Size
11.4.8 By Industry
11.5 Latin America
11.5.1 By Country
11.5.1.1 Mexico
11.5.1.2 Brazil
11.5.1.3 Rest of Latin America
11.5.2 By Component
11.5.3 By Service
11.5.4 By Professional Service
11.5.5 By Business Application
11.5.6 By Deployment Model
11.5.7 By Organization Size
11.5.8 By Industry
11.6 Middle East and Africa
11.6.1 By Sub-Region
11.6.1.1 Middle East
11.6.1.2 Africa
11.6.2 By Component
11.6.3 By Service
11.6.4 By Professional Service
11.6.5 By Business Application
11.6.6 By Deployment Model
11.6.7 By Organization Size
11.6.8 By Industry
12 Competitive Landscape (Page No. - 94)
12.1 Overview
12.2 Competitive Scenario
12.2.1 New Product Launches and Product Upgradations
12.2.2 Partnerships and Collaborations
12.2.3 Acquisitions
12.2.4 Business Expansions
12.3 Service Analytics Market: Prominent Players
13 Company Profiles (Page No. - 100)
(Business Overview, Solutions and Services Offered, Recent Developments, SWOT Analysis, and MnM View)*
13.1 Microsoft
13.2 Oracle
13.3 Salesforce
13.4 SAP
13.5 Servicenow
13.6 SAS Institute
13.7 Tableau Software
13.8 Microstrategy
13.9 Clicksoftware
13.10 Centina Systems
13.11 Paskon
13.12 Numerify
13.13 Field Squared
13.14 Helpshift
13.15 Icharts
13.16 Bluefletch
13.17 Mobi
13.18 Datahero
13.19 Agile Crm
13.20 Sisense
13.21 Aureus Analytics
*Details on Business Overview, Solutions and Services Offered, Recent Developments, SWOT Analysis, and MnM View Might Not Be Captured in Case of Unlisted Companies.
14 Appendix (Page No. - 141)
14.1 Key Insights of Industry Experts
14.2 Discussion Guide
14.3 Knowledge Store: Marketsandmarkets� Subscription Portal
14.4 Available Customization
14.5 Related Reports
14.6 Author Details
List of Tables (75 Tables)
Table 1 United States Dollar Exchange Rate, 2015�2017
Table 2 Service Analytics Market Size, By Business Application, 2016�2023 (USD Million)
Table 3 Customer Service Analytics: Market Size By Region, 2016�2023 (USD Million)
Table 4 Field Service Analytics: Market Size By Region, 2016�2023 (USD Million)
Table 5 IT Service Analytics: Market Size By Region, 2016�2023 (USD Million)
Table 6 Service Analytics Market Size, By Component, 2016�2023 (USD Million)
Table 7 Solution: Market Size By Region, 2016�2023 (USD Million)
Table 8 Services: Market Size By Type, 2016�2023 (USD Million)
Table 9 Services: Market Size By Region, 2016�2023 (USD Million)
Table 10 Managed Services: Market Size By Region, 2016�2023 (USD Million)
Table 11 Professional Services: Market Size By Type, 2016�2023 (USD Million)
Table 12 Professional Services: Market Size By Region, 2016�2023 (USD Million)
Table 13 Support and Maintenance Market Size, By Region, 2016�2023 (USD Million)
Table 14 Consulting Market Size, By Region, 2016�2023 (USD Million)
Table 15 Service Analytics Market Size, By Deployment Model, 2016�2023 (USD Million)
Table 16 On-Premises: Market Size By Region, 2016�2023 (USD Million)
Table 17 Cloud: Market Size By Region, 2016�2023 (USD Million)
Table 18 Market Size By Organization Size, 2016�2023 (USD Million)
Table 19 Large Enterprises: Market Size By Region, 2016�2023 (USD Million)
Table 20 Small and Medium-Sized Enterprises: Market Size By Region, 2016�2023 (USD Million)
Table 21 Service Analytics Market Size, By Industry, 2016�2023 (USD Million)
Table 22 Banking, Financial Services, and Insurance: Market Size By Region, 2016�2023 (USD Million)
Table 23 Retail and Ecommerce: Market Size By Region, 2016�2023 (USD Million)
Table 24 Healthcare: Market Size By Region, 2016�2023 (USD Million)
Table 25 Government and Defense: Market Size By Region, 2016�2023 (USD Million)
Table 26 Telecommunications: Market Size By Region, 2016�2023 (USD Million)
Table 27 Manufacturing: Market Size By Region, 2016�2023 (USD Million)
Table 28 Energy and Utilities: Market Size By Region, 2016�2023 (USD Million)
Table 29 Others: Market Size By Region, 2016�2023 (USD Million)
Table 30 Service Analytics Market, By Region, 2016�2023 (USD Million)
Table 31 North America: Market Size By Country, 2016�2023 (USD Million)
Table 32 North America: Market Size By Component, 2016�2023 (USD Million)
Table 33 North America: Market Size By Service, 2016�2023 (USD Million)
Table 34 North America: Market Size By Professional Service, 2016�2023 (USD Million)
Table 35 North America: Market Size By Business Application, 2016�2023 (USD Million)
Table 36 North America: Market Size By Deployment Model, 2016�2023 (USD Million)
Table 37 North America: Market Size By Organization Size, 2016�2023 (USD Million)
Table 38 North America: Market Size By Industry, 2016�2023 (USD Million)
Table 39 Europe: Service Analytics Market Size, By Country, 2016�2023 (USD Million)
Table 40 Europe: Market Size By Component, 2016�2023 (USD Million)
Table 41 Europe: Market Size By Service, 2016�2023 (USD Million)
Table 42 Europe: Market Size By Professional Service, 2016�2023 (USD Million)
Table 43 Europe: Market Size By Business Application, 2016�2023 (USD Million)
Table 44 Europe: Market Size By Deployment Model, 2016�2023 (USD Million)
Table 45 Europe: Market Size By Organization Size, 2016�2023 (USD Million)
Table 46 Europe: Market Size By Industry, 2016�2023 (USD Million)
Table 47 Asia Pacific: Service Analytics Market Size, By Country, 2016�2023 (USD Million)
Table 48 Asia Pacific: Market Size By Component, 2016�2023 (USD Million)
Table 49 Asia Pacific: Market Size By Service, 2016�2023 (USD Million)
Table 50 Asia Pacific: Market Size By Professional Service, 2016�2023 (USD Million)
Table 51 Asia Pacific: Market Size By Business Application, 2016�2023 (USD Million)
Table 52 Asia Pacific: Market Size By Deployment Model, 2016�2023 (USD Million)
Table 53 Asia Pacific: Market Size By Organization Size, 2016�2023 (USD Million)
Table 54 Asia Pacific: Market Size By Industry, 2016�2023 (USD Million)
Table 55 Latin America: Service Analytics Market Size, By Country, 2016�2023 (USD Million)
Table 56 Latin America: Market Size By Component, 2016�2023 (USD Million)
Table 57 Latin America: Market Size By Service, 2016�2023 (USD Million)
Table 58 Latin America: Market Size By Professional Service, 2016�2023 (USD Million)
Table 59 Latin America: Market Size By Business Application, 2016�2023 (USD Million)
Table 60 Latin America: Market Size By Deployment Model, 2016�2023 (USD Million)
Table 61 Latin America: Market Size By Organization Size, 2016�2023 (USD Million)
Table 62 Latin America: Market Size By Industry, 2016�2023 (USD Million)
Table 63 Middle East and Africa: Service Analytics Market Size, By Sub-Region, 2016�2023 (USD Million)
Table 64 Middle East and Africa: Market Size By Component, 2016�2023 (USD Million)
Table 65 Middle East and Africa: Market Size By Service, 2016�2023 (USD Million)
Table 66 Middle East and Africa: Market Size By Professional Service, 2016�2023 (USD Million)
Table 67 Middle East and Africa: Market Size By Business Application, 2016�2023 (USD Million)
Table 68 Middle East and Africa: Market Size By Deployment Model, 2016�2023 (USD Million)
Table 69 Middle East and Africa: Market Size By Organization Size, 2016�2023 (USD Million)
Table 70 Middle East and Africa: Market Size By Industry, 2016�2023 (USD Million)
Table 71 New Product Launches and Product Upgradations, 2017�2018
Table 72 Partnerships and Collaborations, 2017
Table 73 Acquisitions, 2015�2018
Table 74 Business Expansions, 2015�2018
Table 75 Key Players in the Service Analytics Market
List of Figures (41 Figures)
Figure 1 Service Analytics Market Segmentation
Figure 2 Market Research Design
Figure 3 Breakdown of Primary Interviews: By Company, Designation, and Region
Figure 4 Data Triangulation
Figure 5 Market Size Estimation Methodology: Bottom-Up Approach
Figure 6 Market Size Estimation Methodology: Top-Down Approach
Figure 7 Service Analytics Market: Assumptions
Figure 8 Market is Expected to Witness High Growth During the Forecast Period
Figure 9 Market By Component (2018 vs 2023)
Figure 10 Market By Business Application (2018�2023)
Figure 11 Market By Deployment Model (2018�2023)
Figure 12 Market By Organization Size (2018�2023)
Figure 13 Market By Industry (2018 vs 2023)
Figure 14 Increasing Need Among Organizations to Interact With Customers to Understand Their Demands is Expected to Be the Major Factor Contributing to the Growth of the Service Analytics Market
Figure 15 North America is Estimated to Have the Largest Market Share in 2018
Figure 16 Banking, Financial Services, and Insurance Industry and North America are Estimated to Have the Largest Market Shares in 2018
Figure 17 Service Analytics Market: Drivers, Restraints, Opportunities, and Challenges
Figure 18 Customer Service Analytics Segment is Expected to Account for the Largest Market Size During the Forecast Period
Figure 19 Solution Segment is Expected to Account for the Larger Market Size During the Forecast Period
Figure 20 Professional Services Segment is Expected to Account for the Larger Market Size During the Forecast Period
Figure 21 Consulting Segment is Expected to Account for the Larger Market Size By 2023
Figure 22 Cloud Segment is Expected to Account for the Larger Market Size During the Forecast Period
Figure 23 Large Enterprises Segment is Expected to Account for the Larger Market Size During the Forecast Period
Figure 24 Retail and Ecommerce Industry is Expected to Account for the Largest Market Size By 2023
Figure 25 Asia Pacific is Expected to Grow at the Highest CAGR During the Forecast Period
Figure 26 North America: Market Snapshot
Figure 27 Asia Pacific: Market Snapshot
Figure 28 Key Developments By the Leading Players in the Service Analytics Market, 2015�2018
Figure 29 Microsoft: Company Snapshot
Figure 30 Microsoft: SWOT Analysis
Figure 31 Oracle: Company Snapshot
Figure 32 Oracle: SWOT Analysis
Figure 33 Salesforce: Company Snapshot
Figure 34 Salesforce: SWOT Analysis
Figure 35 SAP: Company Snapshot
Figure 36 SAP: SWOT Analysis
Figure 37 Servicenow: Company Snapshot
Figure 38 Servicenow: SWOT Analysis
Figure 39 SAS Institute: Company Snapshot
Figure 40 Tableau Software: Company Snapshot
Figure 41 Microstrategy: Company Snapshot


Growth opportunities and latent adjacency in Service Analytics Market