Silicone Structural Glazing Market by Type (Four-Sided Structural, Two-Sided Structural, Total Vision Systems), Material (Aluminum Structural Framing, Glass Panel, Silicone Sealant), End Use (Commercial, Public), and Region - Global Forecast to 2022


[186 Pages Report] The silicone structural glazing market size is estimated to grow from USD 26.91 Billion in 2016 to USD 43.95 Billion by 2022, at a CAGR of 8.90%. The base year considered for the study is 2016, and the market size is projected from 2017 to 2022.
The report aims at estimating the market size and future growth potential of the silicone structural glazing market across different segments type, material, end use, and region. The other objectives include providing detailed information regarding the main factors influencing the growth of the market (drivers, restraints, opportunities, and industry-specific challenges). It also aims to study the individual growth trends, prospects, and contribution of various segments to the total market. The study also analyzes opportunities in the market for stakeholders and details of the competitive landscape for the market leaders. The study strategically profiles key players and comprehensively analyzes their core competencies.
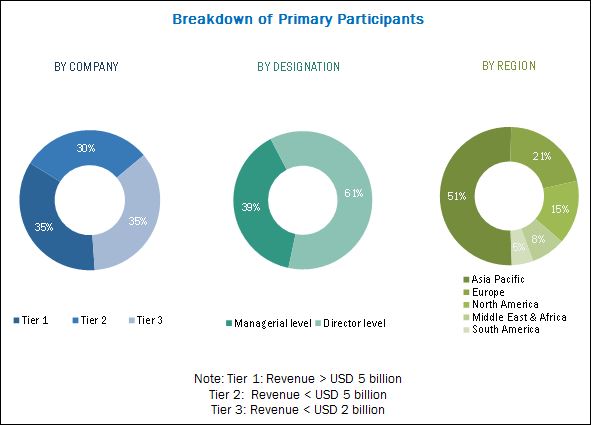
The research methodology used to estimate and forecast the silicone structural glazing market begins with capturing data on key vendor revenues through secondary research and associations such as Environmental Protection Agency (EPA), India Brand Equity Foundation (IBEF), CIB (International Council for Research and Innovation in Building and Construction). The vendor offerings are also taken into consideration to determine the market segmentation. The bottom-up procedure was employed to arrive at the overall size of the global silicone structural glazing market from the revenues of the key players. After arriving at the overall market size, the total market was split into several segments and subsegments, which were then verified through primary research by conducting extensive interviews with key people such as CEOs, VPs, directors, and executives. These data triangulation and market breakdown procedures were employed to complete the overall market engineering process and arrive at the exact statistics for all segments and subsegments. The breakdown of profiles of primary participants is depicted in the figure below:
To know about the assumptions considered for the study, download the pdf brochure
The market ecosystem includes various stakeholders involved in the supply chain of the silicone structural glazing industry starting from raw material suppliers, research & development, and manufacturing. Post this, the marketing and sales of the products take place which is only possible if an efficient distribution channel is developed. Finally, the end products are made available to the consumers. The global market for silicone structural glazing is dominated by players such as Nippon Sheet Glass Co. Ltd. (Japan), The Dow Chemical Company (US), Asahi Glass Co., Ltd (Japan), Arkema SA (France), Saint-Gobain SA (France), 3M Company (US), Schott AG (Germany), Kibing Glass (China), PPG Industries, Inc. (US), Sika AG (Switzerland), Central Glass Co., Ltd. (Japan) Guardian Glass (US), and YKK Corporation (Japan).
Target Audience:
- Silicone structural glazing manufacturers
- Raw material producers and suppliers
- Glass producers and suppliers
- Silicone structural glazing distributors and traders
- End-use sectors
- Governments and R&D institutions
- Market research and consulting firms
- Associations and industry bodies
Scope of the Report
The research report segments the silicone structural glazing market into the following submarkets:
By Type:
- Four-sided structural
- Two-sided structural
- Slope
- Stepped glass
- U-shaped
- Total vision systems
- Others (frameless [spider systems] and shock-resistant)
By Material:
- Aluminum structural framing
- Glass panel
- Silicone sealant
- EPDM
By End Use:
- Commercial
- Public
- Residential
By Region:
- North America
- Europe
- Asia Pacific
- Middle East & Africa
- South America
Available Customizations
With the given market data, MarketsandMarkets offers customizations according to client-specific needs. The following customization options are available for the report:
Product Analysis
- Product Matrix, which gives a detailed comparison of the product portfolio of each company
Geographic Analysis
- Further analysis of the silicone structural glazing market for additional countries
Company Information
- Detailed analysis and profiling of additional market players
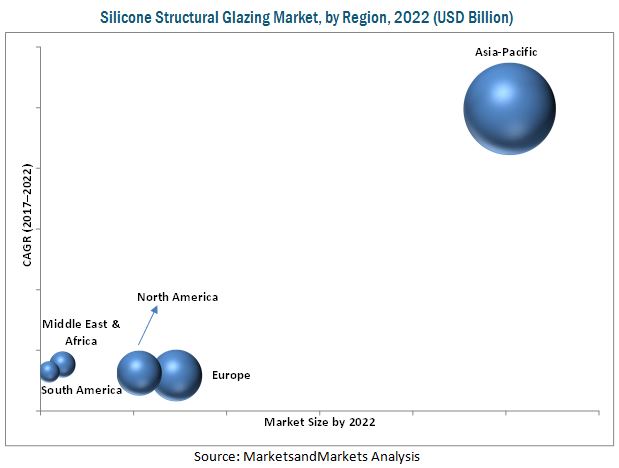
MarketsandMarkets projects that the silicone structural glazing market size will grow from USD 28.69 Billion in 2017 to USD 43.95 Billion by 2022, at a CAGR of 8.90%. This market is witnessing considerable growth due to the rising demand for energy-efficient buildings and advanced facade systems in developing and developed countries along with advancements in installation technology. The silicone structural glazing market has immense opportunities owing to the rise in demand for green buildings and growth in investments in infrastructural projects in developing economies.
On the basis of type, the silicone structural glazing market has been segmented into four-sided structural, two-sided structural, slope, stepped glass, U-shaped, total vision, and others which include frameless (spider systems) and shock-resistant. The four-sided structural segment is projected to grow at the highest CAGR from 2017 to 2022 in terms of value. The growth of this segment is attributed to the growing construction & glass facade industry, increasing demand for energy-efficient buildings, along with rising standardization in building facade systems.
The commercial sector dominated the market in 2016 and is projected to be the fastest-growing end-use sector over the next five years, as a result of the rising demand for glass facade system along with the growing need for green buildings. The newly developed advanced glass demand additional improvements in facade technologies and successfully installation, which will, in turn, drive the silicone structural glazing market growth through the sector. In addition, this dominant market position is attributed to the energy-efficiency, superior properties such as durability, water- and wind-resistance, easy maintenance, and weather-proof properties of silicone structural glazing.
In 2016, the Asia Pacific region accounted for the largest share of the global silicone structural glazing market. As the market for silicone structural glazing in developed countries is maturing, markets in developing countries such as China and India are projected to grow at the highest rates from 2017 to 2022. The Asia Pacific market is projected to grow at the highest CAGR compared to those of other region-level markets, owing to increase in usage of silicone structural glazing in end-use sectors such as commercial, public, and residential buildings. China is projected to be the fastest-growing country-level market in the region for the silicone structural glazing market. The growth of the building and construction industry, coupled with the rising need for green buildings has resulted in the rise in demand for silicone structural glazing in the region.
In contrast, factors such as government regulations for carbon emissions and high capital investments required restrain the growth of this market.
The global silicone structural glazing market is dominated by players such as Nippon Sheet Glass Co. Ltd. (Japan), The Dow Chemical Company (US), Asahi Glass Co., Ltd (Japan), Arkema SA (France), Saint-Gobain SA (France), 3M Company (US), Schott AG (Germany), Kibing Glass (China), PPG Industries, Inc. (US), Sika AG (Switzerland), Central Glass Co., Ltd. (Japan), Guardian Glass (US), and YKK Corporation (Japan). These players adopted various strategies such as new product and technology launches, expansions & investments, agreements & contracts, joint ventures, and mergers & acquisitions to expand their presence in the silicone structural glazing market.
To speak to our analyst for a discussion on the above findings, click Speak to Analyst
 Exclusive indicates content/data unique to MarketsandMarkets and not available with any competitors.
Table of Contents
1 Introduction (Page No. - 20)
1.1 Objectives of the Study
1.2 Market Definition
1.3 Market Scope
1.3.1 Periodization Considered for the Study 2017-2022
1.4 Currency
1.5 Unit Considered
1.6 Stakeholders
2 Research Methodology (Page No. - 24)
2.1 Research Data
2.1.1 Secondary Data
2.1.1.1 Key Data From Secondary Sources
2.1.2 Primary Data
2.1.2.1 Key Data From Primary Sources
2.1.2.2 Breakdown of Primaries
2.2 Market Size Estimation
2.3 Data Triangulation
2.4 Research Assumptions & Limitations
2.4.1 Research Assumptions
2.4.2 Limitations
3 Excutive Summary (Page No. - 32)
4 Premium Insights (Page No. - 37)
4.1 Developing Economies to Witness Higher Demand for Silicone Structural Glazing
4.2 Silicone Structural Glazing, By Type
4.3 Silicone Structural Glazing Market, By End-Use
4.4 Asia Pacific: Silicone Structural Glazing Market, By End Use and Key Country
4.5 Silicone Structural Glazing Market: Geographic Snapshot
5 Market Overview (Page No. - 41)
5.1 Introduction
5.2 Market Dynamics
5.2.1 Drivers
5.2.1.1 Growth in Industrial and Commercial Construction Activities
5.2.1.2 Technological Advancements in the Glass Industry
5.2.2 Restraints
5.2.2.1 Government Regulations for Carbon Emissions
5.2.2.2 High Capital Investment Requirement
5.2.3 Opportunities
5.2.3.1 Rise in Demand for Green Buildings
5.2.3.2 Growth in Investment on Infrastructural Projects in Developing Economies
5.2.4 Challenges
5.2.4.1 Production and Installation Requirements of A Complex Structural Glazing
5.2.4.2 Energy-Efficient Manufacturing of Raw Materials
5.2.4.3 Price Volatility of the Raw Materials
6 Macroeconomic Overview (Page No. - 46)
6.1 Introduction
6.2 GDP & Contribution to the Construction Industry, By Country
7 Silicone Structural Glazing Market, By Type (Page No. - 50)
7.1 Introduction
7.2 Four-Sided Structural Glazing
7.3 Two-Sided Structural Glazing
7.4 Slope Glazing
7.5 Stepped Glass Glazing
7.6 U-Shaped Glazing
7.7 Total Vision Systems Glazing
7.8 Others
8 Silicone Structural Glazing Market, By Material (Page No. - 55)
8.1 Introduction
8.2 Glass Panels
8.3 Aluminum Structural Framing
8.4 Silicone Sealants
8.5 EPDM
9 Silicone Structural Glazing Market, By End Use (Page No. - 58)
9.1 Introduction
9.2 Commercial
9.3 Public
9.4 Residential
10 Silicone Structural Glazing Market, By Region (Page No. - 62)
10.1 Introduction
10.2 North America
10.2.1 North America: Silicone Structural Glazing Market, By Type
10.2.2 North America: Market, By End Use
10.2.3 North America: Market, By Country
10.2.3.1 US
10.2.3.1.1 US: Silicone Structural Glazing Market, By Type
10.2.3.1.2 US: Market, By End Use
10.2.3.2 Canada
10.2.3.2.1 Canada: Silicone Structural Glazing Market, By Type
10.2.3.2.2 Canada: Market, By End Use
10.2.3.3 Mexico
10.2.3.3.1 Mexico: Silicone Structural Glazing Market By Type
10.2.3.3.2 Mexico: Market, By End Use
10.3 Europe
10.3.1 Europe: Silicone Structural Glazing Market, By Type
10.3.2 Europe: Market, By End Use
10.3.3 Europe: Market, By Country
10.3.3.1 UK
10.3.3.1.1 UK: Silicone Structural Glazing Market, By Type
10.3.3.1.2 UK: Market, By End Use
10.3.3.2 Russia
10.3.3.2.1 Russia: Silicone Structural Glazing, By Type
10.3.3.2.2 Russia: Silicone Structural Glazing, By End Use
10.3.3.3 Germany
10.3.3.3.1 Germany: Silicone Structural Glazing, By Type
10.3.3.3.2 Germany: Silicone Structural Glazing, By End Use
10.3.3.4 France
10.3.3.4.1 France: Silicone Structural Glazing, By Type
10.3.3.4.2 France: Silicone Structural Glazing, By End Use
10.3.3.5 Spain
10.3.3.5.1 Spain: Silicone Structural Glazing, By Type
10.3.3.5.2 Spain: Silicone Structural Glazing, By End Use
10.3.3.6 Rest of Europe
10.3.3.6.1 Rest of Europe: Silicone Structural Glazing, By Type
10.3.3.6.2 Rest of Europe: Silicone Structural Glazing, By End Use
10.4 Asia Pacific
10.4.1 Asia Pacific: Silicone Structural Glazing Market, By Type
10.4.2 Asia Pacific: Market, By End Use
10.4.3 Asia Pacific: Market, By Country
10.4.3.1 China
10.4.3.1.1 China: Silicone Structural Glazing , By Type
10.4.3.1.2 China: Market, By End Use
10.4.3.2 India
10.4.3.2.1 India: Silicone Structural Glazing , By Type
10.4.3.2.2 India: Market, By End Use
10.4.3.3 Japan
10.4.3.3.1 Japan: Silicone Structural Glazing , By Type
10.4.3.3.2 Japan: Market, By End Use
10.4.3.4 Australia
10.4.3.4.1 Australia: Silicone Structural Glazing , By Type
10.4.3.4.2 Australia: Market, By End Use
10.4.3.5 South Korea
10.4.3.5.1 South Korea: Silicone Structural Glazing , By Type
10.4.3.5.2 South Korea: Market, By End Use
10.4.3.6 Rest of Asia Pacific
10.4.3.6.1 Rest of Asia Pacific: Silicone Structural Glazing , By Type
10.4.3.6.2 Rest of Asia Pacific: Market, By End Use
10.5 Middle East & Africa (MEA)
10.5.1 Middle East & Africa: Silicone Structural Glazing Market, By Type
10.5.2 Middle East & Africa: Market, By End Use
10.5.3 Middle East & Africa: Market, By Country
10.5.3.1 UAE
10.5.3.1.1 UAE: Silicone Structural Glazing Market, By Type
10.5.3.1.2 UAE: Market, By End Use
10.5.3.2 Turkey
10.5.3.2.1 Turkey: Silicone Structural Glazing Market, By Type
10.5.3.2.2 Turkey: Market, By End Use
10.5.3.3 Saudi Arabia
10.5.3.3.1 Saudi Arabia: Silicone Structural Glazing Market, By End Use
10.5.3.4 South Africa
10.5.3.4.1 South Africa: Silicone Structural Glazing Market, By Type
10.5.3.4.2 South Africa: Market, By End Use
10.5.3.5 Rest of Middle East & Africa
10.5.3.5.1 Rest of Middle East & Africa: Silicone Structural Glazing Market, By Type
10.5.3.5.2 Rest of Middle East & Africa: Market, By End Use
10.6 South America
10.6.1 South America: Silicone Structural Glazing Market, By Type
10.6.2 South America: By Market, By End Use
10.6.3 South America: By Market, By Country
10.6.3.1 Brazil
10.6.3.1.1 Brazil: Silicone Structural Glazing Market, By Type
10.6.3.1.2 Brazil: By Market, By End Use
10.6.3.2 Argentina
10.6.3.2.1 Argentina: Silicone Structural Glazing Market, By Type
10.6.3.2.2 Argentina: By Market, By End Use
10.6.3.3 Rest of South America
10.6.3.3.1 Rest of South America: Silicone Structural Glazing Market, By Type
10.6.3.3.2 Rest of South America: By Market, By End Use
11 Competitive Landscape (Page No. - 132)
11.1 Market Share Analysis
11.1.1 Nippon Sheet Glass Co. Ltd.
11.1.2 Saint-Gobain SA
11.1.3 Asahi Glass Co., Ltd
11.1.4 Guardian Glass
11.1.5 Central Glass Co., Ltd.
12 Company Profiles (Page No. - 134)
(Business Overview, Products Offered, Scorecard of Product Offering, Scorecard of Business Strategy, and New Product Launch)
12.1 Nippon Sheet Glass Co. Ltd
12.2 Asahi Glass Co., Ltd
12.3 PPG Industries, Inc.
12.4 Arkema SA
12.5 Saint-Gobain S.A.
12.6 Sika AG
12.7 The DOW Chemical Company
12.8 3M Company
12.9 YKK Corporation
12.10 Permasteelisa S.P.A
12.11 Additional Companies
12.11.1 Central Glass Co., Ltd.
12.11.2 Sisecam Group
12.11.3 Schott AG
12.11.4 Xinyi Glass Holdings Limited
12.11.5 Shanghai Yaohua Pilkington Glass Group Co., Ltd.
12.11.6 Guardian Glass
12.11.7 Pecora Corporation
12.11.8 Cardinal Glass Industries, Inc
12.11.9 Deamor
12.11.10 Kawneer
12.11.11 Flachglas Wernberg GmbH
12.11.12 Kibing Glass
12.11.13 Oldcastle Building Envelope
12.11.14 K�mmerling
12.11.15 Tiwan Glass Ind.Corp
*Details Might Not Be Captured in Case of Unlisted Companies
13 Appendix (Page No. - 179)
13.1 Discussion Guide
13.2 Knowledge Store: Marketsandmarkets� Subscription Portal
13.3 Introducing RT: Real-Time Market Intelligence
13.4 Available Customizations
13.5 Related Reports
13.6 Author Details
List of Tables (139 Tables)
Table 1 North America: GDP, By Country, 2015�2022 (USD Billion)
Table 2 North America: Contribution to the Construction Industry, By Country, 2014�2021 (USD Billion)
Table 3 Europe: GDP, By Country, 2015�2022 (USD Billion)
Table 4 Europe: Contribution to the Construction Industry, By Country, 2014�2021 (USD Billion)
Table 5 Asia Pacific: GDP, By Country, 2015�2022 (USD Billion)
Table 6 Asia Pacific: Contribution to the Construction Industry, By Country, 2014�2021 (USD Billion)
Table 7 Middle East & Africa: GDP, By Country, 2015�2022 (USD Billion)
Table 8 Middle East & Africa: Contribution to the Construction Industry, By Country, 2014�2021 (USD Billion)
Table 9 South America: GDP, By Country, 2015�2022 (USD Billion)
Table 10 South America: Contribution to the Construction Industry, By Country, 2014�2021 (USD Billion)
Table 11 Silicone Structural Glazing Market Size, By Type, 2015�2022 (USD Million)
Table 12 By Market Size, By Type, 2015�2022 (Thousand Square Meters)
Table 13 By Market, By Material, 2015�2022 (USD Million)
Table 14 By Market, By End Use, 2015�2022 (USD Million)
Table 15 By Market, By End Use, 2015�2022 (Thousand Square Meters)
Table 16 By Market Size, By Region, 2015�2022 (USD Million)
Table 17 By Market Size, By Region, 2015�2022 (Thousand Square Meters)
Table 18 North America: Silicone Structural Glazing Market Size, By Type, 2015�2022 (USD Million)
Table 19 North America: By Market Size, By Type, 2015�2022 (Thousand Square Meters)
Table 20 North America: By Market Size, By End Use, 2015�2022 (USD Million)
Table 21 North America: By Market Size, By End Use, 2015�2022 (Thousand Square Meters)
Table 22 North America: By Market Size, By Country, 2015�2022 (USD Million)
Table 23 North America: By Market Size, By Country, 2015�2022 (Thousand Square Meters)
Table 24 US: Silicone Structural Glazing Market Size, By Type, 2015�2022 (USD Million)
Table 25 US: By Market Size, By Type, 2015�2022 (Thousand Square Meters)
Table 26 US: By Market Size, By End Use, 2015�2022 (USD Million)
Table 27 US: By Market Size, By End Use, 2015�2022 (Thousand Square Meters)
Table 28 Canada: Silicone Structural Glazing Market Size, By Type, 2015�2022 (USD Million)
Table 29 Canada: By Market Size, By Type, 2015�2022 (Thousand Square Meters)
Table 30 Canada: By Market Size, By End Use, 2015�2022 (USD Million)
Table 31 Canada: By Market Size, By End Use, 2015�2022 (Thousand Square Meters)
Table 32 Mexico: Silicone Structural Glazing Market Size, By Type, 2015�2022 (USD Million)
Table 33 Mexico: By Market Size, By Type, 2015�2022 (Thousand Square Meters)
Table 34 Mexico: By Market Size, By End Use, 2015�2022 (USD Million)
Table 35 Mexico: By Market Size, By End Use, 2015�2022 (Thousand Square Meters)
Table 36 Europe: Silicone Structural Glazing Market Size, By Type, 2015�2022 (USD Million)
Table 37 Europe: By Market Size, By Type, 2015�2022 (Thousand Square Meters)
Table 38 Europe: By Market Size, By End Use, 2015�2022 (USD Million)
Table 39 Europe: By Market Size, By End Use, 2015�2022 (Thousand Square Meters)
Table 40 Europe: By Market Size, By Country, 2015�2022 (USD Million)
Table 41 Europe: By Market Size, By Country, 2015�2022 (Thousand Square Meters)
Table 42 UK: Silicone Structural Glazing Market Size, By Type, 2015�2022 (USD Million)
Table 43 UK: By Market Size, By Type, 2015�2022 (Thousand Square Meters)
Table 44 UK: By Market, By End Use, 2015�2022 (USD Million)
Table 45 UK: By Market Size, By End Use, 2015�2022 (Thousand Square Meters)
Table 46 Russia: Silicone Structural Glazing Market Size, By Type, 2015�2022 (USD Million)
Table 47 Russia: By Market Size, By Type, 2015�2022 (Thousand Square Meters)
Table 48 Russia: By Market Size, By End Use, 2015�2022 (USD Million)
Table 49 Russia: By Market Size, By End Use, 2015�2022 (Thousand Square Meters)
Table 50 Germany: Silicone Structure Glazing Market Size, By Type, 2015�2022 (USD Million)
Table 51 Germany: By Market Size, By Type, 2015�2022 (Thousand Square Meters)
Table 52 Germany: By Market Size, By End Use, 2015�2022 (USD Million)
Table 53 Germany: By Market Size, By End Use, 2015�2022 (Thousand Square Meters)
Table 54 France: Silicone Structural Glazing Market Size, By Type, 2015�2022 (USD Million)
Table 55 France: By Market Size, By Type, 2015�2022 (Thousand Square Meters)
Table 56 France: By Market Size, By End Use, 2015�2022 (USD Million)
Table 57 France: By Market Size, By End Use, 2015�2022 (Thousand Square Meters)
Table 58 Spain: Silicone Structural Glazing Market Size, By Type, 2015�2022 (USD Million)
Table 59 Spain: By Market Size, By Type, 2015�2022 (Thousand Square Meters)
Table 60 Spain: By Market Size, By End Use, 2015�2022 (USD Million)
Table 61 Spain: By Market Size, By End Use, 2015�2022 (Thousand Square Meters)
Table 62 Rest of Europe: Silicone Structural Glazing Market Size, By Type, 2015�2022 (USD Million)
Table 63 Rest of Europe: By Market Size, By Type, 2015�2022 (Thousand Square Meters)
Table 64 Rest of Europe: By Market Size, By End Use, 2015�2022 (USD Million)
Table 65 Rest of Europe: By Market Size, By End Use, 2015�2022 (Thousand Square Meters)
Table 66 Asia Pacific: Silicone Structural Glazing Market Size, By Type, 2015�2022 (USD Million)
Table 67 Asia Pacific: By Market Size, By Type, 2015�2022 (Thousand Square Meters)
Table 68 Asia Pacific: By Market Size, By End Use, 2015�2022 (USD Million)
Table 69 Asia Pacific: By Market Size, By End Use, 2015�2022 (Thousand Square Meters)
Table 70 Asia Pacific: By Market Size, By Country, 2015�2022 (USD Million)
Table 71 Asia Pacific: By Market Size, By Country, 2015�2022 (Thousand Square Meters)
Table 72 China: Silicone Structural Glazing Market Size, By Type, 2015�2022 (USD Million)
Table 73 China: By Market Size, By Type, 2015�2022 (Thousand Square Meters)
Table 74 China: By Market Size, By End Use, 2015�2022 (USD Million)
Table 75 China: By Market Size, By End Use, 2015�2022 (Thousand Square Meters)
Table 76 India: Silicone Structural Glazing Market Size, By Type, 2015�2022 (USD Million)
Table 77 India: By Market Size, By Type, 2015�2022 (Thousand Square Meters)
Table 78 India: By Market Size, By End Use, 2015�2022 (USD Million)
Table 79 India: By Market Size, By End Use, 2015�2022 (Thousand Square Meters)
Table 80 Japan: Silicone Structural Glazing Market Size, By Type, 2015�2022 (USD Million)
Table 81 Japan: By Market Size, By Type, 2015�2022 (Thousand Square Meters)
Table 82 Japan: By Market Size, By End Use, 2015�2022 (USD Million)
Table 83 Japan: By Market Size, By End Use, 2015�2022 (Thousand Square Meters)
Table 84 Australia: Silicone Structural Glazing Market Size, By Type, 2015�2022 (USD Million)
Table 85 Australia: By Market Size, By Type, 2015�2022 (Thousand Square Meters)
Table 86 Australia: By Market Size, By End Use, 2015�2022 (USD Million)
Table 87 Australia: By Market Size, By End Use, 2015�2022 (Thousand Square Meters)
Table 88 South Korea: Silicone Structural Glazing Market Size, By Type, 2015�2022 (USD Million)
Table 89 South Korea: By Market Size, By Type, 2015�2022 (Thousand Square Meters)
Table 90 South Korea: By Market Size, By End Use, 2015�2022 (USD Million)
Table 91 South Korea: By Market Size, By End Use, 2015�2022 (Thousand Square Meters)
Table 92 Rest of Asia Pacific: Silicone Structural Glazing Market Size, By Type, 2015�2022 (USD Million)
Table 93 Rest of Asia Pacific: By Market Size, By Type, 2015�2022 (Thousand Square Meters)
Table 94 Rest of Asia Pacific: By Market Size, By End Use, 2015�2022 (USD Million)
Table 95 Rest of Asia Pacific: By Market Size, By End Use, 2015�2022 (Thousand Square Meters)
Table 96 Middle East & Africa: Silicone Structural Glazings Market Size, By Type, 2015�2022 (USD Million)
Table 97 Middle East & Africa: By Market Size, By Type, 2015�2022 (Thousand Square Meters)
Table 98 Middle East & Africa: By Market Size, By End Use, 2015�2022 (USD Million)
Table 99 Middle East & Africa: By Market Size, By End Use, 2015�2022 (Thousand Square Meters)
Table 100 Middle East & Africa: By Market Size, By Country, 2015�2022 (USD Million)
Table 101 Middle East & Africa: By Market Size, By Country, 2015�2022 (Thousand Square Meters)
Table 102 UAE: Silicone Structural Glazings Market Size, By Type, 2015�2022 (USD Million)
Table 103 UAE: By Market Size, By Type, 2015�2022 (Thousand Square Meters)
Table 104 UAE: By Market Size, By End Use, 2015�2022 (USD Million)
Table 105 UAE: By Market Size, By End Use, 2015�2022 (Thousand Square Meters)
Table 106 Turkey: Silicone Structural Glazings Market Size, By Type, 2015�2022 (USD Million)
Table 107 Turkey: By Market Size, By Type, 2015�2022 (Thousand Square Meters)
Table 108 Turkey: By Market Size, By End Use, 2015�2022 (USD Million)
Table 109 Turkey: By Market Size, By End Use, 2015�2022 (Thousand Square Meters)
Table 110 Saudi Arabia: Silicone Structural Glazings Market Size, By Type, 2015�2022 (USD Million)
Table 111 Saudi Arabia: By Market Size, By Type, 2015�2022 (Thousand Square Meters)
Table 112 Saudi Arabia: By Market Size, By End Use, 2015�2022 (USD Million)
Table 113 Saudi Arabia: By Market Size, By End Use, 2015�2022 (Thousand Square Meters)
Table 114 South Africa: By Market Size, By Type, 2015�2022 (USD Million)
Table 115 South Africa: By Market Size, By Type, 2015�2022 (Thousand Square Meters)
Table 116 South Africa: By Market Size, By End Use, 2015�2022 (USD Million)
Table 117 South Africa: By Market Size, By End Use, 2015�2022 (Thousand Square Meters)
Table 118 Rest of Middle East & Africa: Silicone Structural Glazings Market Size, By Type, 2015�2022 (USD Million)
Table 119 Rest of Middle East & Africa: By Market Size, By Type, 2015�2022 (Thousand Square Meters)
Table 120 Rest of Middle East & Africa: By Market Size, By End Use, 2015�2022 (USD Million)
Table 121 Rest of Middle East & Africa: By Market Size, By End Use, 2015�2022 (Thousand Square Meters)
Table 122 South America: By Market Size, By Type, 2015�2022 (USD Million)
Table 123 South America: By Market Size, By Type, 2015�2022 (Thousand Square Meters)
Table 124 South America: By Market Size, By End Use, 2015�2022 (USD Million)
Table 125 South America: By Market Size, By End Use, 2015�2022 (Thousand Square Meters)
Table 126 South America: By Market Size, By Country, 2015�2022 (USD Million)
Table 127 South America: By Market Size, By Country, 2015�2022 (Thousand Square Meters)
Table 128 Brazil: Silicone Structural Glazings Market Size, By Type, 2015�2022 (USD Million)
Table 129 Brazil: By Market Size, By Type, 2015�2022 (Thousand Square Meters)
Table 130 Brazil: By Market Size, By End Use, 2015�2022 (USD Million)
Table 131 Brazil: By Market Size, By End Use, 2015�2022 (Thousand Square Meters)
Table 132 Argentina: Silicone Structural Glazings Market Size, By Type, 2015�2022 (USD Million)
Table 133 Argentina: By Market Size, By Type, 2015�2022 (Thousand Square Meters)
Table 134 Argentina: By Market Size, By End Use, 2015�2022 (USD Million)
Table 135 Argentina: By Market Size, By End Use, 2015�2022 (Thousand Square Meters)
Table 136 Rest of South America: Silicone Structural Glazings Market Size, By Type, 2015�2022 (USD Million)
Table 137 Rest of South America: By Market Size, By Type, 2015�2022 (Thousand Square Meters)
Table 138 Rest of South America: By Market Size, By End Use, 2015�2022 (USD Million)
Table 139 Rest of South America: By Market Size, By End Use, 2015�2022 (Thousand Square Meters)
List of Figures (31 Figures)
Figure 1 Silicone Structural Glazing Market: Research Design
Figure 2 Market Size Estimation: Bottom-Up Approach
Figure 3 Market Size Estimation: Top-Down Approach
Figure 4 Silicone Structural Glazings Market: Data Triangulation
Figure 5 Four-Sided Structural Glazing to Grow at the Highest Rate During the Forecast Period
Figure 6 Commercial Buildings to Lead the Market for Silicone Structural Glazing Through 2022
Figure 7 Aluminum Structural Framing is Projected to Dominate the Silicone Structural Glazings Market Through 2022
Figure 8 Asia Pacific Dominated the Silicone Structural Glazings Market in 2016
Figure 9 Emerging Economies Offer Growth Opportunities to the Silicone Structural Glazings Market
Figure 10 Two-Sided Structural Glazing to Account for the Largest Share in the Forecast Period Through 2022
Figure 11 Commercial Buildings to Lead the Market Through 2022
Figure 12 Commercial Buildings Captured the Largest Share in Asia Pacific in 2016
Figure 13 Market in China Projected to Grow at the Highest Rate From 2017 to 2022
Figure 14 Drivers, Restraints, Opportunities, and Challenges in the Silicone Structural Glazings Market
Figure 15 Four-Sided Structural Glazing is Projected to Record the Largest Demand for Silicone Structural Glazing From 2017 to 2022
Figure 16 Aluminum Structural Framing is Projected to Register the Highest Growth Rate From 2017 to 2022
Figure 17 Commercial Buildings are Projected to Record the Highest Demand for Silicone Structural Glazing Through 2022
Figure 18 Geographic Snapshot (2017�2022): the Market in China is Projected to Grow at the Highest Rate in Terms of Value
Figure 19 European Silicone Structural Glazings Market Snapshot: Germany is Projected to Be the Fastest-Growing Market Between 2017 & 2022
Figure 20 Asia Pacific Silicone Structural Glazings Market Snapshot: China is Projected to Be the Fastest-Growing Market Between 2017 & 2022
Figure 21 Silicone Structural Glazings Market Share, By Key Player, 2016
Figure 22 Nippon Sheet Glass Co. Ltd.: Company Snapshot
Figure 23 Asahi Glass Co., Ltd: Company Snapshot
Figure 24 PPG Industries, Inc.: Company Snapshot
Figure 25 Arkema Sa: Company Snapshot
Figure 26 Saint-Gobain S.A.: Company Snapshot
Figure 27 Sika AG: Company Snapshot
Figure 28 DOW Chemical Company: Company Snapshot
Figure 29 3M: Company Snapshot
Figure 30 YKK Corporation: Company Snapshot
Figure 31 Permasteelisa S.P.A.: Company Snapshot


Growth opportunities and latent adjacency in Silicone Structural Glazing Market
I really like your information