Smart Transformers Market by Component (Converters, Switches, Transformers, Hardware for Transformer Monitoring), Type (Power, Distribution, Specialty, and Instrument), Application (Smart Grid, Traction Locomotive, Electric Vehicle Charging), and Region - Global Forecast to 2022


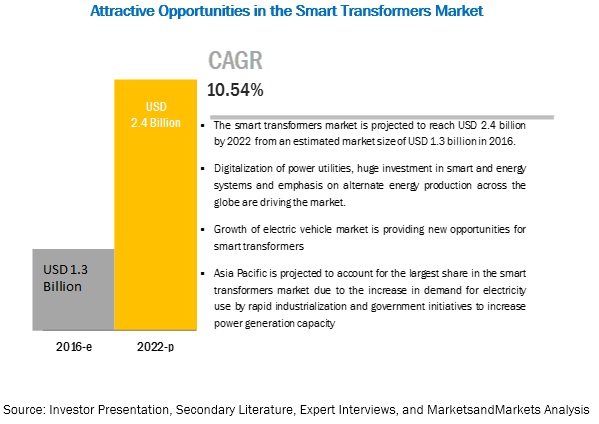
[144 Pages Report] MarketsandMarkets forecasts the global smart transformers market to grow from USD 1.3 billion in 2016 to USD 2.4 billion by 2022, at a Compound Annual Growth Rate (CAGR) of 10.54% during the forecast period. The major factors driving the Smart Transformers Market include Increasing Emphasis of Alternate Energy Production Across the Globe, Digitalization of Power Utilities and Huge Investments in Smart Grids and Energy Systems. The objective of the report is to define, describe, and forecast the global smart transformers market by component, application and region
By Application, Smart Grid segment is expected to dominate the Smart Transformers Market during the forecast period
With regards to the end use application segment, the smart grid segment is expected to constitute the largest market by 2022. One of the biggest uses of a smart transformer in smart grids is its role in integrating power from distributed generation into the main grid. Smart grids have two-way communication for real-time monitoring and controlling of network characteristics. For this, the basic step is the implementation of smart meters for end-user interactions, followed by employing smart transformers in the network to further strengthen communications and avoid power outages. Although smart grids prevent faults and power outages, they are also equipped with self-realization characteristic that allows the network to restore to normal, once the fault is cleared. Due to its application at various end-user points in the smart grid infrastructure, the segment is expected to dominate the market by 2022.
By Type, distributed transformer segment is expected to grow at the highest CAGR during the forecast period
With regards to the type segment, distribution transformers are expected to constitute the fastest growing market from 2017 to 2022. Smart distribution networks require smart transformers to communicate with consumers and for continuous load monitoring. Distribution transformers are less efficient than power transformers as they are subject to load fluctuations and the chances of failure are higher. Power distribution sometimes results in increased load above the peak limit of the equipment. Hence, the implementation of a distribution network is essential for proper load management, resulting in better power quality and lesser power outages.
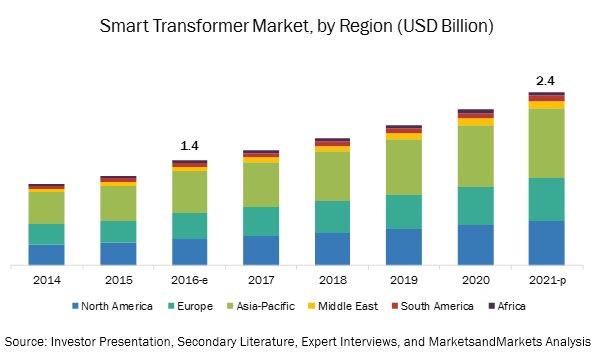
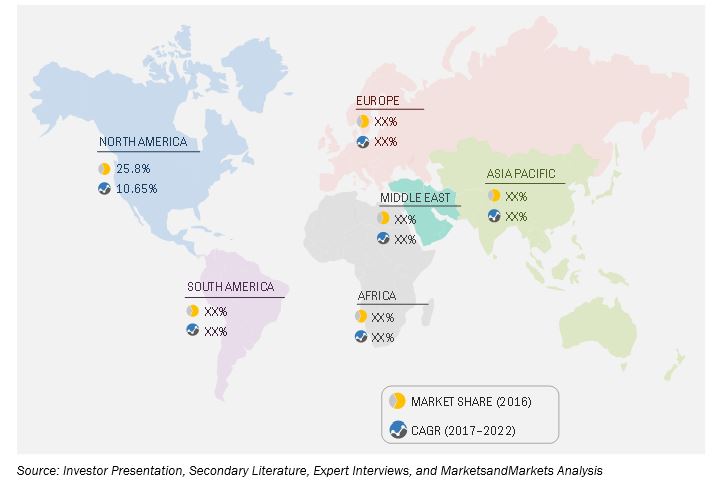
Asia Pacific to account for the largest market size during the forecast period.
The smart transformers market is projected to grow faster in the Asia-Pacific region, especially in China, Japan, and South Korea. The Asia Pacific region is moving towards clean energy on a large scale to meet its growing energy needs in an efficient way. India, China, and Singapore are some of the potential growing markets in the power and utilities sector. Also, Asia-Pacific offered the biggest potential gains for foreign direct investment, and attracted 45% of all capital investment, globally, in 2015. Increased investments in modernizing infrastructure and urbanizing populations, especially in developing economies such as China and India, is expected to drive the Asia-Pacific smart transformers market. The Chinese market was, by far, the largest in the world in terms of infrastructure development in 2015. A rise in investments in smart grid technologies and smart cities that include distribution grid automation, smart meters, and demand response systems in countries such as Japan, South Korea, and Australia would create opportunities for the smart transformers market.
Market Dynamics
Driver Increasing emphasis of alternative energy production across the globe
Increasing use of fossil fuel presents potential hazards to the regional and global environment. Due to their current industrial structures and consumption patterns, Qatar, the United Arab Emirates (UAE), Kuwait, and Bahrain have some of the highest per capita CO2 emission rates in the world. At the same time, many regions in the world are investing in alternative fuels and energy efficiency, and are developing previously untapped resources, especially shale gas. There is an increasing need for alternative energies to fulfill the global energy demand and efforts to reduce greenhouse gas emissions.
Alternative sources are often cleaner than fossil fuel combustion, and can improve public health and local environment by reducing regional air pollutants. Some alternative sources such as wind and solar power do not require water for their operation and therefore do not pollute or strain water resources.
Worldwide, a number of policies have been enacted to promote renewable energy. The U.S., Canada, and India have renewable portfolio standards or quotas for renewable power generation. Net metering policies are in place in 37 countries, including Canada (in 8 provinces) and the U.S. (in 43 states, Washington, D.C., and four territories).
Increasing non-linear equipment that support the renewable energy systems increases the risk of grid instability. There is the threat of electrical grid failure as well as the risk of damage to the electronic equipment that support these renewable energy systems. Smart transformers helps in maintaining the grid frequency by regulating the voltage of injected power as per the grid requirement.
Restraint: High initial cost incurred in the installation of smart transformers
The major restraint for the smart transformer market is the high equipment cost due to which, many enterprises are reluctant to implement this device. Although these transformers provide an assured Return on Investment (ROI) in terms of reliability, power factor improvement, and harmonics elimination which plays an important role in making overall energy system efficient, cost effective, and productive. However, the high initial cost of installing such transformers may be burdensome for potential customers who may choose to stay with traditional transformer. As of May 2017, for AC/AC applications, cost of conventional low frequency transformer is USD 11.4/kVA, while solid state transformer cost approximately USD 52.7/kVA. When considering AC/DC application, the cost for conventional low frequency transformers is USD 30/kVA in comparison to solid state transformers which cost at USD 34.1/kVA. The price of semiconductor materials has been exhibiting a downward trend across the world which is expected to bring down the price of a smart transformer.
Opportunity: Growth of the electric vehicle market and the allied infrastructure
The global electric vehicles� (EV) stock stood at 665,000 at the end of 2014, accounting for 0.08% of the total passengers cars sold across the world. It represents a small fraction compared to passenger car sales; however, electric vehicle sales have registered a multifold growth in the past few years. According to the International Energy Agency (IEA) and Electric Vehicle Initiative (EVI), around 20 million electric vehicles are expected to be on the road globally, by 2020. Japan, United States, and China are some of the key markets for electric vehicles among others. The growth of the EV market has also increased investments from various stakeholders to develop the allied infrastructure such as electric vehicle charging systems. IEA and EVI are aiming to deploy 2.4 million slow chargers and 6,000 fast chargers across 16 EVI counties.
The Japanese government is expected to deploy 2 million slow chargers and 5,000 fast chargers across the nation, by 2020. The Netherlands aims to have 20,000 slow chargers and 100 fast chargers by 2015. Furthermore, the U.S. deployed 22,000 slow chargers and 350 fast chargers in 2014. Fast charging is an advanced method of vehicle charging and consumes less time compared to slow chargers. It is also known as �DC quick charging� which provides DC to a vehicle�s battery from an external charger. On the other hand, slow charging offers an AC current from an external charger to a vehicle�s battery. Here, a solid state transformer can prove to be useful as it can offer output in either form of power. Hence, the growth of EV and allied services offered a huge opportunity to smart transformer market.
Challenge: Lack of data for effective planning
Planning and designing best suited equipment for a power supply network requires massive data. It can be available only through continuous monitoring and data acquisition at every level of the distribution chain of generated power. This data will help in the development of a suitable equipment to suffice the need of a network. The implementation of smart transformers depends on the load data and patterns obtained from the distribution load center
Scope of the Report
|
Report Metric |
Details |
|
Market size available for years |
2015�2022 |
|
Base year considered |
2016 |
|
Forecast period |
2017�2022 |
|
Forecast units |
Billion (USD) |
|
Segments covered |
By Type (Power Transformers, Distribution Transformers, Specialty Transformers, Instrument Transformers), By Component (Converters, Switches, Transformers, Hardware for Transformer Monitoring, and Others), By Application (Traction Locomotive, Smart Grid, Electric Vehicle Charging, Others) |
|
Geographies covered |
Asia Pacific, Europe, North America, South America, Middle East, and Africa |
|
|
ABB (Switzerland), GE (US), Siemens (Germany), Schneider Electric (France), Eaton(Ireland), Wilson Transformer (Australia), Mitsubishi Electric (Japan), BHEL (India), CG Power (India), Gridco (US), Howard Industries (US) and SPX Transformer (US) |
The research report categorizes the smart transformers market to forecast the revenues and analyze the trends in each of the following sub-segments:
By Component
- Converters
- Switches
- Transformers
- Hardware for Transformer Monitoring
- Others
By Type
- Power Transformers
- Distribution Transformers
- Specialty Transformers
- Instrument Transformers
By Application
- Traction Locomotive
- Smart Grid
- Electric Vehicle Charging
- Other Applications
By Region
- Asia Pacific
- North America
- Europe
- Middle East
- South America
- Africa
Key Market Players
ABB (Switzerland), GE (US), Siemens (Germany), Schneider Electric (France), Eaton(Ireland), Wilson Transformer (Australia), Mitsubishi Electric (Japan), BHEL (India), CG Power (India), Gridco (US), Howard Industries (US) and SPX Transformer (US).
ABB is a power and automation technology company that offers a wide range of products, services, and systems. The company has strong regional footprint through its presence in more than 100 countries. With an installed base of more than 70,000 control systems connecting 70 million devices ABB is one of the fastest growing company in the digitally connected and enabled industrial equipment�s. It adopts inorganic growth strategies as its key business strategy to expand its business in the untapped markets. ABB power grid business segment provides smart transformers,that caters to various end use industries such as utilities, industry, and transport & infrastructure globally. In March 2017, ABB launched its first digital transformer TXper. The transformer will provide the integrated sensing and monitoring technology in intelligence to maximize reliability, optimize operating and maintenance costs, and manage the asset more efficiently. This latest innovation uses cloud computing and connected devices to generate actionable data for a broad range of customers.
Recent Developments
- In September 2017, Siemens introduced its new railway transformer �Tractronic Thinity�, which will be installed on board 24 DB-Regio trains within Germany. The new transformers system will feed power to the trains and ensure interference-free rail traffic.
- In August 2017, Siemens received a contract from Mexico�s state-owned Comisi�n Federal de Electricidad (CFE). The contract states that Siemens has to deliver 12,820 pole-mounted distribution transformers (10 kVA-1ph, 15 kVA-1ph, and 15 kVA-3ph) to the CFE.
- In August 2017, Siemens received a contract to deliver two HVDC transformers, with a 1,050 kV AC grid connection for the Ximeng-Taizhou project, a 10 GW transmission plan for energy from renewable sources.
- In May 2017, ABB introduced a new traction transformer production facility adjacent to its South African headquarters in Longmeadow, Johannesburg. The scope of the investment is to help power trains and support South Africa�s growing railway network. Traction transformers are used to feed power at safe voltages, to essential train functions like traction, brakes, lighting, heating and ventilation, as well as passenger information, signaling, and communication.
- In March 2017, ABB launched its first digital transformer TXper. The transformer will provide the integrated sensing and monitoring technology in intelligence to maximize reliability, optimize operating and maintenance costs, and manage the asset more efficiently. This latest innovation uses cloud computing and connected devices to generate actionable data for a broad range of customers.
Critical questions the report answers:
- Where will all these developments take the industry in the long term?
- What are the upcoming trends for the Smart Transformers Market?
- Which segment provides the most opportunity for growth?
- Who are the leading manufacturers operating in this market?
- What are the opportunities for new market entrants?
To speak to our analyst for a discussion on the above findings, click Speak to Analyst
 Exclusive indicates content/data unique to MarketsandMarkets and not available with any competitors.
Table of Contents
1 Introduction (Page No. - 15)
1.1 Objectives of the Study
1.2 Market Definition
1.3 Market Scope
1.3.1 Markets Covered
1.3.2 Years Considered for the Study
1.4 Currency
1.5 Limitations
1.6 Stakeholders
2 Research Methodology (Page No. - 19)
2.1 Research Data
2.1.1 Secondary Data
2.1.1.1 Key Data From Secondary Sources
2.1.2 Primary Data
2.1.2.1 Key Data From Primary Sources
2.1.2.2 Key Industry Insights
2.1.2.3 Breakdown of Primaries
2.2 Market Size Estimation
2.2.1 Bottom-Up Approach
2.2.2 Top-Down Approach
2.3 Market Breakdown & Data Triangulation
2.4 Research Assumptions
3 Executive Summary (Page No. - 27)
4 Premium Insights (Page No. - 32)
4.1 Attractive Opportunities in the Smart Transformers Market, 2017�2022
4.2 Smart Transformers Market, By Region, 2016
4.3 Market, By Type, 2017 & 2022
4.4 Market, By Application, 2017 & 2022
4.5 Asia Pacific Smart Transformers Market Size, By Type & By Country
5 Market Overview (Page No. - 36)
5.1 Introduction
5.2 Evolution
5.3 Market Dynamics
5.3.1 Drivers
5.3.1.1 Increasing Emphasis of Alternate Energy Production Across the Globe
5.3.1.2 Digitalization of Power Utilities
5.3.1.3 Huge Investments in Smart Grids and Energy Systems
5.3.2 Restraints
5.3.2.1 High Initial Cost Incurred in the Installation of Smart Transformers
5.3.3 Opportunities
5.3.3.1 Growth of the Electric Vehicle Market and the Allied Infrastructure
5.3.4 Challenges
5.3.4.1 Lack of Data for Effective Planning
5.3.4.2 Cyber Security & Data Privacy
6 Smart Transformers Market, By Type (Page No. - 43)
6.1 Introduction
6.1.1 Smart Transformers Market Size, By Type, 2015�2022 (USD Million)
6.2 Power Transformers
6.2.1 Power Transformers: Market Size, By Region, 2015�2022 (USD Million)
6.3 Distribution Transformers
6.3.1 Distribution Transformers: Market Size, By Region, 2015�2022 (USD Million)
6.4 Specialty Transformers
6.4.1 Specialty Transformers: Market Size, By Region, 2015�2022 (USD Million)
6.5 Instrument Transformers
6.5.1 Instrument Transformers: Market Size, By Region, 2015�2022 (USD Million)
7 Smart Transformers Market, By Component (Page No. - 49)
7.1 Introduction
7.2 Converters
7.2.1 Ac to Dc Converters
7.2.2 Dc to Ac Converters
7.2.3 Dc to Dc Converters
7.2.4 Ac to Ac Converters
7.3 Switches
7.3.1 SIC Power Mosfets
7.3.2 Power Diodes
7.3.3 Insulated Gate Bipolar Transistors (IGBTS)
7.3.4 SIC Power Thyristors
7.4 Transformers
7.5 Hardware for Transformer Monitoring
7.6 Others
7.6.1 High Voltage Inductors
7.6.2 High Voltage Capacitors
7.6.3 High Voltage Resistors
8 Smart Transformers Market, By Application (Page No. - 55)
8.1 Introduction
8.2 Traction Locomotive
8.2.1 Traction Locomotive: Smart Transformers Market Size, By Region, 2015�2022 (USD Million)
8.3 Smart Grid
8.3.1 Smart Grid: Market Size, By Region, 2015�2022 (USD Million)
8.4 Electric Vehicle Charging
8.4.1 Electric Vehicle Charging: Market Size, By Region, 2015�2022 (USD Million)
8.5 Others
8.5.1 Others: Market Size, By Region, 2015�2022 (USD Million)
9 Smart Transformers Market, By Region (Page No. - 61)
9.1 Introduction
9.2 North American
9.2.1 North America: Smart Transformers Market Size, By Type, 2015�2022 (USD Million)
9.2.2 North America: Market Size, By Application, 2015�2022 (USD Million)
9.2.3 North America: Market Size, By Country, 2015�2022 (USD Million)
9.2.4 US
9.2.4.1 US: Smart Transformers Market Size, By Type, 2015�2022 (USD Million)
9.2.4.2 US: Market Size, By Application, 2015�2022 (USD Million)
9.2.5 Canada
9.2.5.1 Canada: Smart Transformers Market Size, By Type, 2015�2022 (USD Million)
9.2.5.2 Canada: Market Size, By Application, 2015�2022 (USD Million)
9.2.6 Mexico
9.2.6.1 Mexico: Smart Transformers Market Size, By Type, 2015�2022 (USD Million)
9.2.6.2 Mexico: Market Size, By Application, 2015�2022 (USD Thousand)
9.3 Europe
9.3.1 Europe: Smart Transformers Market Size, By Type, 2015�2022 (USD Million)
9.3.2 Europe: Market Size, By Application, 2015�2022 (USD Million)
9.3.3 Europe: Market Size, By Country, 2015�2022 (USD Million)
9.3.4 Germany
9.3.4.1 Germany: Smart Transformers Market Size, By Type, 2015�2022 (USD Million)
9.3.4.2 Germany: Market Size, By Application, 2015�2022 (USD Million)
9.3.5 UK
9.3.5.1 UK: Smart Transformers Market Size, By Type, 2015�2022 (USD Million)
9.3.5.2 UK: Market Size, By Application, 2015�2022 (USD Million)
9.3.6 France
9.3.6.1 France: Smart Transformers Market Size, By Type, 2015�2022 (USD Million)
9.3.6.2 France: Market Size, By Application, 2015�2022 (USD Million)
9.3.7 Rest of Europe
9.3.7.1 Rest of Europe: Smart Transformers Market Size, By Type, 2015�2022 (USD Million)
9.3.7.2 Rest of Europe: Market Size, By Application, 2015�2022 (USD Million)
9.4 Asia Pacific
9.4.1 Asia Pacific: Smart Transformers Market Size, By Type, 2015�2022 (USD Million)
9.4.2 Asia Pacific: Market Size, By Application, 2015�2022 (USD Million)
9.4.3 Asia Pacific: Market Size, By Country, 2015�2022 (USD Million)
9.4.4 China
9.4.4.1 China: Smart Transformers Market Size, By Type, 2015�2022 (USD Million)
9.4.4.2 China: Market Size, By Application, 2015�2022 (USD Million)
9.4.5 India
9.4.5.1 India: Smart Transformers Market Size, By Type, 2015�2022 (USD Million)
9.4.5.2 India: Market Size, By Application, 2015�2022 (USD Thousand)
9.4.6 Japan
9.4.6.1 Japan: Smart Transformers Market Size, By Type, 2015�2022 (USD Million)
9.4.6.2 Japan: Market Size, By Application, 2015�2022 (USD Million)
9.4.7 South Korea
9.4.7.1 South Korea: Smart Transformers Market Size, By Type, 2015�2022 (USD Million)
9.4.7.2 South Korea: Market Size, By Application, 2015�2022 (USD Million)
9.4.8 Australia
9.4.8.1 Australia: Smart Transformers Market Size, By Type, 2015�2022 (USD Million)
9.4.8.2 Australia: Market Size, By Application, 2015�2022 (USD Million)
9.4.9 Rest of Asia Pacific
9.4.9.1 Rest of Asia Pacific: Smart Transformers Market Size, By Type, 2015�2022 (USD Million)
9.4.9.2 Rest of Asia Pacific: Market Size, By Application, 2015�2022 (USD Million)
9.5 Middle East
9.5.1 Middle East: Smart Transformers Market Size, By Type, 2015�2022 (USD Million)
9.5.2 Middle East: Market Size, By Application, 2015�2022 (USD Million)
9.5.3 Middle East: Market Size, By Country, 2015�2022 (USD Million)
9.5.4 Rest of the Middle East: Smart Transformers Market Size, By Type, 2015�2022 (USD Million)
9.5.5 Rest of the Middle East: Market Size, By Application, 2015�2022 (USD Million)
9.6 South America
9.6.1 South America: Smart Transformers Market Size, By Type, 2015�2022 (USD Million)
9.6.2 South America: Market Size, By Application, 2015�2022 (USD Million)
9.6.3 South America: Market Size, By Country, 2015�2022 (USD Million)
9.7 Africa
9.7.1 Africa: Smart Transformers Market Size, By Type, 2015�2022 (USD Million)
9.7.2 Africa: Market Size, By Application, 2015�2022 (USD Million)
9.7.3 Africa: Market Size, By Country, 2015�2022 (USD Million)
10 Competitive Landscape (Page No. - 98)
10.1 Introduction
10.2 Market Ranking, Smart Transformers Market, 2016
10.3 Competitive Situation & Trends
11 Company Profiles (Page No. - 101)
11.1 ABB
11.1.1 Overview
11.1.2 Strength of Product Portfolio
11.1.3 Business Strategy Excellence
11.1.4 Recent Developments
11.2 Siemens
11.2.1 Overview
11.2.2 Strength of Product Portfolio
11.2.3 Business Strategy Excellence
11.2.4 Recent Developments
11.3 Schneider Electric
11.3.1 Overview
11.3.2 Strength of Product Portfolio
11.3.3 Business Strategy Excellence
11.3.4 Recent Developments
11.4 Eaton
11.4.1 Overview
11.4.2 Strength of Product Portfolio
11.4.3 Business Strategy Excellence
11.4.4 Recent Developments
11.5 GE
11.5.1 Overview
11.5.2 Strength of Product Portfolio
11.5.3 Business Strategy Excellence
11.5.4 Recent Developments
11.6 Wilson Transformer
11.6.1 Overview
11.6.2 Strength of Product Portfolio
11.6.3 Business Strategy Excellence
11.6.4 Recent Developments
11.7 Mitsubishi Electric
11.7.1 Overview
11.7.2 Strength of Product Portfolio
11.7.3 Business Strategy Excellence
11.7.4 Recent Developments
11.8 Bhel
11.8.1 Overview
11.8.2 Strength of Product Portfolio
11.8.3 Business Strategy Excellence
11.8.4 Recent Developments
11.9 CG Power
11.9.1 Overview
11.9.2 Strength of Product Portfolio
11.9.3 Business Strategy Excellence
11.9.4 Recent Developments
11.10 Gridco
11.10.1 Overview
11.10.2 Strength of Product Portfolio
11.10.3 Business Strategy Excellence
11.10.4 Recent Developments
11.11 Howard Industries
11.11.1 Overview
11.11.2 Strength of Product Portfolio
11.11.3 Business Strategy Excellence
11.12 SPX Transformer
11.12.1 Overview
11.12.2 Strength of Product Portfolio
11.12.3 Business Strategy Excellence
12 Appendix (Page No. - 138)
12.1 Insights of Industry Experts
12.2 Discussion Guide
12.3 Knowledge Store: Marketsandmarkets� Subscription Portal
12.4 Introducing RT: Real Time Market Intelligence
12.5 Available Customizations
12.6 Related Reports
12.7 Author Details
List of Tables (66 Tables)
Table 1 Smart Transformer vs. Traditional Transformer
Table 2 Smart Transformers Market Snapshot
Table 3 Comparison Between Conventional & Smart Grids
Table 4 Challenges for Transformer Owners/Operators
Table 5 Key Smart Grid Investment Initiatives
Table 6 Moving Toward Smart Power Distribution
Table 7 Smart Transformers Market Size, By Type, 2015�2022 (USD Million)
Table 8 Power Transformers: Smart Transformers Market Size, By Region, 2015�2022 (USD Million)
Table 9 Distribution Transformers: Market Size, By Region, 2015�2022 (USD Million)
Table 10 Specialty Transformers: Market Size, By Region, 2015�2022 (USD Million)
Table 11 Instrument Transformers: Market Size, By Region, 2015�2022 (USD Million)
Table 12 Smart Transformers Market Size, By Component, 2015�2022 (USD Million)
Table 13 Smart Transformers Market Size, By Application, 2015�2022 (USD Million)
Table 14 Traction Locomotive: Market Size, By Region, 2015�2022 (USD Million)
Table 15 Smart Grid: Market Size, By Region, 2015�2022 (USD Million)
Table 16 Smart Grid: Market Size, By Country (Top 5 Countries), 2015�2022 (USD Million)
Table 17 Electric Vehicle Charging: Market Size, By Region, 2015�2022 (USD Million)
Table 18 Others: Smart Transformers Market Size, By Region, 2015�2022 (USD Million)
Table 19 Smart Transformers Market Size, By Region, 2015�2022 (USD Million)
Table 20 Smart Transformers Market Size, By Country (Top 5 Countries), 2015�2022 (USD Million)
Table 21 North America: Market Size, By Type, 2015�2022 (USD Million)
Table 22 North America: Market Size, By Application, 2015�2022 (USD Million)
Table 23 North America: Market Size, By Country, 2015�2022 (USD Million)
Table 24 US: Smart Transformers Market Size, By Type, 2015�2022 (USD Million)
Table 25 US: Smart Transformers Market Size, By Application, 2015�2022 (USD Million)
Table 26 Canada: Smart Transformers Market Size, By Type, 2015�2022 (USD Million)
Table 27 Canada: Market Size, By Application, 2015�2022 (USD Million)
Table 28 Mexico: Market Size, By Type, 2015�2022 (USD Million)
Table 29 Mexico: Market Size, By Application, 2015�2022 (USD Thousand)
Table 30 Europe: Market Size, By Type, 2015�2022 (USD Million)
Table 31 Europe: Market Size, By Application, 2015�2022 (USD Million)
Table 32 Europe: Market Size, By Country, 2015�2022 (USD Million)
Table 33 Germany: Market Size, By Type, 2015�2022 (USD Million)
Table 34 Germany: Market Size, By Application, 2015�2022 (USD Million)
Table 35 UK: Market Size, By Type, 2015�2022 (USD Million)
Table 36 UK: Market Size, By Application, 2015�2022 (USD Million)
Table 37 France: Market Size, By Type, 2015�2022 (USD Million)
Table 38 France: Market Size, By Application, 2015�2022 (USD Million)
Table 39 Rest of Europe: Market Size, By Type, 2015�2022 (USD Million)
Table 40 Rest of Europe: Market Size, By Application, 2015�2022 (USD Million)
Table 41 Asia Pacific: Market Size, By Type, 2015�2022 (USD Million)
Table 42 Asia Pacific: Market Size, By Application, 2015�2022 (USD Million)
Table 43 Asia Pacific: Market Size, By Country, 2015�2022 (USD Million)
Table 44 China: Smart Transformers Market Size, By Type, 2015�2022 (USD Million)
Table 45 China: Market Size, By Application, 2015�2022 (USD Million)
Table 46 India: Smart Transformers Market Size, By Type, 2015�2022 (USD Million)
Table 47 India: Market Size, By Application, 2015�2022 (USD Thousand)
Table 48 Japan: Smart Transformers Market Size, By Type, 2015�2022 (USD Million)
Table 49 Japan: Market Size, By Application, 2015�2022 (USD Million)
Table 50 South Korea: Smart Transformers Market Size, By Type, 2015�2022 (USD Million)
Table 51 South Korea: Market Size, By Application, 2015�2022 (USD Million)
Table 52 Australia: Smart Transformers Market Size, By Type, 2015�2022 (USD Million)
Table 53 Australia: Market Size, By Application, 2015�2022 (USD Million)
Table 54 Rest of Asia Pacific: Smart Transformers Market Size, By Type, 2015�2022 (USD Million)
Table 55 Rest of Asia Pacific: Market Size, By Application, 2015�2022 (USD Million)
Table 56 Middle East: Smart Transformers Market Size, By Type, 2015�2022 (USD Million)
Table 57 Middle East: Market Size, By Application, 2015�2022 (USD Million)
Table 58 Middle East: Market Size, By Country, 2015�2022 (USD Million)
Table 59 Rest of the Middle East: Smart Transformers Market Size, By Type, 2015�2022 (USD Million)
Table 60 Rest of the Middle East: Market Size, By Application, 2015�2022 (USD Million)
Table 61 South America: Smart Transformers Market Size, By Type, 2015�2022 (USD Million)
Table 62 South America: Market Size, By Application, 2015�2022 (USD Million)
Table 63 South America: Market Size, By Country, 2015�2022 (USD Million)
Table 64 Africa: Smart Transformers Market Size, By Type, 2015�2022 (USD Million)
Table 65 Africa: Market Size, By Application, 2015�2022 (USD Million)
Table 66 Africa: Market Size, By Country, 2015�2022 (USD Million)
List of Figures (35 Figures)
Figure 1 Smart Transformer: Research Design
Figure 2 Market Size Estimation Methodology: Bottom-Up Approach
Figure 3 Market Size Estimation Methodology: Top-Down Approach
Figure 4 Data Triangulation Methodology
Figure 5 Assumptions of the Research Study
Figure 6 Asia Pacific Held the Largest Market Size By Value in the Smart Transformers Market in 2016
Figure 7 The Distribution Transformer is Expected to Grow at the Highest CAGR During the Forecast Period
Figure 8 The Smart Grid Segment is Expected to Dominate the Market During the Forecast Period
Figure 9 The Converters Segment is Expected to Grow at the Highest CAGR During the Forecast Period
Figure 10 Digitalization of Power Utilities is Expected to Drive the Market During the Forecast Period
Figure 11 The Asia Pacific Market Held the Largest Share in 2016
Figure 12 The Distribution Transformer Segment is Expected to Grow at the Highest CAGR During the Forecast Period
Figure 13 The Smart Grid is Expected to Lead the Market During the Forecast Period
Figure 14 The Distribution Transformer, By Type & China, By Country, Held the Maximum Share in the Asian Smart Transformers Market in 2016
Figure 15 Digitalization of Power Utilities is Expected to Drive the Market During the Forecast Period
Figure 16 Total Renewable Energy Capacity
Figure 17 Smart Distribution Transformers Segment is Expected to Hold the Largest Market Size By 2022
Figure 18 Transformers Segment is Expected to Account for the Largest Market Size By 2022
Figure 19 Smart Grid Application is Expected to Hold the Largest Market Size By 2022
Figure 20 Regional Snapshot: the Market in Asia Pacific is Expected to Grow at the Highest CAGR During the Forecast Period
Figure 21 Smart Transformers Market Size (Value), By Region, 2016
Figure 22 North America: Market Snapshot
Figure 23 Asia Pacific: Smart Transformers Market Snapshot
Figure 24 Companies Adopted Contracts & Agreements to Capture A Share of the Market, 2014�2017
Figure 25 Market Ranking, Smart Transformers Market, 2016
Figure 26 Battle for Market Share: Contracts & Agreements Was the Key Strategy, 2014�2017
Figure 27 Market Evaluation Framework: New Product Launches, Mergers & Acquisitions, Partnerships, Contracts & Agreements, & Others Fueled the Growth of the Companies From 2014�2017 97
Figure 28 ABB: Company Snapshot
Figure 29 Siemens : Company Snapshot
Figure 30 Schneider Electric : Company Snapshot
Figure 31 Eaton : Company Snapshot
Figure 32 GE: Company Snapshot
Figure 33 Mitsubishi Electric : Company Snapshot
Figure 34 Bhel: Company Snapshot
Figure 35 CG Power : Company Snapshot


Growth opportunities and latent adjacency in Smart Transformers Market