Transformer Monitoring Market

Transformer Monitoring Market by Component (Hardware Solutions, Software Solutions), Type (Oil-Immersed, Cast-Resin), Services (Oil Monitoring, Bushing Monitoring, Partial Discharge Monitoring, OLTC Monitoring), Voltage & Region - Global Forecast to 2028

Report Code: EP 4706 Dec, 2023, by marketsandmarkets.com

[233 Pages Report] The Transformer Monitoring market is expected to grow from an estimated USD 2.4 billion in 2023 to USD 3.7 billion by 2028, at a CAGR of 9.1% during the forecast period. The transformer monitoring market is expanding as a result of rising need for dependable power supply, increased adoption of smart grid technologies, increased awareness of transformer aging, and developments in sensor technology. Transformer monitoring systems are critical for assuring power grid stability and dependability. They can aid in the detection and prevention of transformer failures, which can result in costly outages. As the need for power grows, so will the demand for transformer monitoring systems.

Transformer Monitoring Market

To know about the assumptions considered for the study, Request for Free Sample Report

Transformer Monitoring Market

To know about the assumptions considered for the study, download the pdf brochure

Transformer Monitoring market Dynamics

Driver: Digitalization of utilities are promoting use of power transformers

Power utilities are investing in process automation along with digitalizing the monitoring and controlling of the processes. Power utilities require a huge number of sensors and data handling solutions to manage and use the acquired data intelligently. As power companies extend their electrical grids to satisfy the expanding energy demands of residential, commercial, and industrial users, they require more transformers to efficiently distribute electricity. Power utilities are also investing in grid modernization activities to improve reliability and resilience. This includes replacing obsolete transformers and improving aging infrastructure.

According to IEA’s article, several countries and regions have had recently put forward strategies and action plans to facilitate the digital transformation of their energy systems, while others are beginning to mandate the use of digital technologies to support clean energy transitions.

Transformer monitoring systems/solutions play a key role in network monitoring for transmission and distribution utilities while at the generation end. Monitoring generation transformers becomes critical before feeding the electricity to the grid. Collaborations with third-party vendors and service providers are common in the digitalization of the power sector. Thus, digitalization of the utilities is likely to boost the demand for transformer monitoring systems.

Restraints: Cost barrier is hindering the growth of power transformers

The cost barrier is a multidimensional impediment to broad adoption of power transformer monitoring devices. The significant upfront expenditure necessary for hardware, software, and installation can initially deter utilities and organizations particularly those with limited budgets. The continuing maintenance and calibration costs associated with complicated monitoring systems compound this budgetary limitation, raising the total cost of ownership. Retrofitting older transformers with monitoring equipment adds another financial barrier, frequently needing costly upgrades or replacements that organizations may find difficult to pay. The cumulative cost of establishing monitoring systems across all units can become a considerable hurdle for large-scale utilities or enterprises controlling several transformers.

Further, raw material costs, such as copper and steel, have a direct impact on transformer prices. Price fluctuations in these important components can cause cost uncertainty for both manufacturers and purchasers. Furthermore, the development of environmentally friendly and energy-efficient transformers, driven by severe laws, frequently necessitates the use of new technologies and materials, which can raise production costs even further. To overcome these cost barriers, innovative financing solutions, government incentives, and industry collaboration are required to drive down costs and make power transformers more accessible, especially considering rising electricity demand and the need for a resilient and sustainable power grid.

Opportunity: Growth of big data analytic

Big data analytics is driving demand for power transformers, and its influence on the energy sector is significant. Foremost, big data analytics enable utilities to optimize their power systems by gathering and analysing massive amounts of real-time data on electricity demand and supply. This data-driven strategy enables more efficient grid operations and increases overall system efficiency. To fulfil the demands of this data-driven era, utilities frequently require contemporary power transformers that can adjust to varying loads and interact easily with data analytics systems.

Big data analytics can provide predictive maintenance for power transformers. Analytics can detect possible difficulties and failures in transformers before they become significant by scrutinizing previous data and performance trends. This preventive maintenance strategy not only minimizes downtime but also increases transformer lifespan, making them more cost-effective for utilities in the long term. For instance, in June 2020, HPE launched HPE Ezmeral, which is a new software portfolio and brand that will accelerate data-driven transformation across organizations. HPE Ezmeral provides a complete portfolio, including container orchestration and management, AI/ML and data analytics, cost control, IT automation and AI-driven operations, and security. Similarly in 2020 ABB’s fully functional Ability Power Transformer was launched that provides with integrated solution for digitally enabled power transformers, fundamentally changing the transformer paradigm.

In addition, the energy efficiency landscape is evolving with the help of data analytics. These tools can pinpoint opportunities for energy savings by optimizing transformer operations. This increased focus on energy efficiency is spurring the adoption of more advanced and efficient transformers that align with sustainability goals, ensuring that power distribution systems are both reliable and environmentally responsible. As renewable energy sources like wind and solar power continue to grow, utilities are challenged with managing variable and intermittent power generation. Big data analytics come to the rescue by forecasting renewable energy output and facilitating the necessary adjustments to grid infrastructure. This often requires the integration of new and innovative transformers capable of handling the dynamics of renewable energy integration. Moreover, the rise of big data analytics is altering the energy sector in a variety of ways, having a direct impact on demand for power transformers. These transformers are critical for assuring power grid adaptability, efficiency, and reliability as they change to meet the challenges and opportunities posed by data analytics-driven energy systems.

Challenges: Acceptance level among end users

Acceptance of power transformer monitoring systems faces several obstacles when it comes to end users. Traditional and well-established industries may exhibit resistance to change, as they are accustomed to their existing practices and may be hesitant to adopt new technologies. The perceived complexity of monitoring systems can be a deterrent, with concerns over specialized knowledge requirements and potential disruptions to current operations. Moreover, data privacy and security issues can cast a shadow of doubt, as end users worry about the risk of data breaches and unauthorized access to sensitive information. Additionally, the initial costs of hardware, software, and installation pose a financial barrier, especially for organizations operating with limited budgets. The necessity for additional training and education to effectively operate monitoring technology can contribute to hesitancy among end users, who may fear the resource investment required for workforce proficiency. Furthermore, a lack of awareness about the benefits of power transformer monitoring can hinder acceptance, as some end users may not fully grasp how these systems can enhance their operations.

Additionally, incentivizing the adoption of monitoring systems through subsidies or financial mechanisms can make it more attractive, particularly for those concerned about the initial costs. Overall, raising awareness and education about the benefits of power transformer monitoring is pivotal in encouraging acceptance among end users and driving the adoption of this transformative technology.

Transformer Monitoring Market Ecosystem

Notable players in this industry comprise long-standing, financially robust manufacturers of Market and related components. These companies have a significant track record in the market, offering a wide range of products, employing cutting-edge technologies, and maintaining robust global sales and marketing networks. Prominent companies in this market include GE (US), ABB (Switzerland), Siemens Energy AG (Germany), Schneider Electric (France), and Eaton (Ireland).

Transformer Monitoring Market

Cast-resin, is expected to be the second-largest market, based on type.

Cast resin transformers are the second largest section of the transformers monitoring market for numerous reasons. For instance, cast resin transformers are more fire-resistant than liquid-filled transformers, making them a safer choice for usage in high-risk areas. Second, because they do not contain any harmful substances, cast resin transformers are more environmentally friendly. Third, compared to liquid-filled transformers, cast resin transformers are more compact and lighter, making them easier to install and carry. Finally, because cast resin transformers do not need to be replenished with oil on a regular basis, they require less maintenance than liquid-filled transformers.

Software solutions, by component, to hold the fastest market share during the forecast period.

The software solutions segment is the fastest growing segment of the transformer monitoring market because it offers various advantages over hardware solutions. Software solutions are more adaptable and scalable, and they can be tailored to each utility's unique requirements. Furthermore, software solutions are less expensive to deploy and maintain than hardware ones. Furthermore, software solutions offer more functionality than hardware solutions, such as real-time data visualization, analytics, and reporting. These characteristics assist utilities better understand the health and performance of their transformers, allowing them to identify and rectify problems before they create outages.

Asia Pacific is expected to be the fastest market during the forecast period.

The region's rapid urbanization and industrialization, coupled with massive technological advancements is making Asia Pacific the fastest growing region for transformer monitoring. China is Asia Pacific’s largest and fastest growing market, owing to the country’s massive renewable energy projects and vast manufacturing potential. Transformers become increasingly prone to failure as they age. Transformer monitoring systems can aid in the detection and prevention of these problems, which can result in costly outages. In Asia Pacific, the growing reliance on renewable energy sources is also pushing the market for transformer monitoring systems, as renewable energy sources, are erratic and might cause price volatility.

Asia Pacific Transformer Monitoring Market Size, and Share

Key Market Players

The market is dominated by a few major players that have a wide regional presence. The major players in the Transformer Monitoring market are GE (US), ABB (Switzerland), Siemens Energy AG (Germany), Schneider Electric (France), and Eaton (Ireland). Between 2019 and 2023, Strategies such as product launches, contracts, agreements, partnerships, collaborations, alliances, acquisitions, and expansions are followed by these companies to capture a larger share of the market.

Get online access to the report on the World's First Market Intelligence Cloud

  • Easy to Download Historical Data & Forecast Numbers
  • Company Analysis Dashboard for high growth potential opportunities
  • Research Analyst Access for customization & queries
  • Competitor Analysis with Interactive dashboard
  • Latest News, Updates & Trend analysis
Request Sample

Scope of the Report

Report Metric

Details

Market size available for years

2021–2028

Base year considered

2022

Forecast period

2023–2028

Forecast units

Value (USD)

Segments covered

Component, Type, Services, Voltage, Application, and Region

Geographies covered

Asia Pacific, North America, Europe, Middle East & Africa, and South America

Companies covered

GE (US), ABB (Switzerland), Siemens Energy AG (Germany), Schneider Electric (France), Eaton (Ireland), Mistras Group (US), Mitsubishi Electrical Corporation (Japan), Vaisala (Finland), Hitachi Energy Ltd (Switzerland), KJ Dynatech Inc (Japan), Maschinenfabrik Reinhausen GmbH (Germany), Qualitrol (US), Gasera (Finland), Doble Engineering Company (US), and Wilson Transformers (US).

This research report categorizes the market by component, type, services, voltage, application, and region

On the basis of component, the Transformer Monitoring market has been segmented as follows:
  • Hardware Solutions
  • Software Solutions
On the basis of type, the market has been segmented as follows:
  • Oil-immersed
  • Cast-resin
  • Others
On the basis of by services, the Transformer Monitoring market has been segmented as follows:
  • Oil monitoring
  • Bushing monitoring
  • Partial discharge monitoring
  • OLTC monitoring
  • Others
On the basis of by voltage, the market has been segmented as follows:
  • Low voltage
  • Medium voltage
  • High & Extra High voltage
On the basis of by application, the Transformer Monitoring market has been segmented as follows:
  • Distribution transformers
  • Power transformers
  • Others
On the basis of region, the Transformer Monitoring market has been segmented as follows:
  • Asia Pacific
  • Europe
  • North America
  • Middle East & Africa
  • South America

Recent Developments

  • In October 2023, Eaton invested USD 85 million to increase the manufacturing of utility solutions to advance energy transitions and electrifications. These investments in regional manufacturing increases the supplies for transformers, regulators, switchgears, and their utility equipment. These investments would help the manufacturers to integrate condition monitoring in their transformers.
  • In September 2023, Schneider Electric has invested USD 300 million to establish an electrical equipment manufacturing plant in El Paso, Texas, US. This expansion will help Schneider Electric to manufacture monitoring devices for transformers and other electrical appliances.
  • In October 2022, Schneider Electric had offered a solution that extends transformer lifetime. By incorporating digital transformation through the implementation of IoT sensors and expert analysis, Schneider Electric monitor’s transformer insulation health. The EcoStruxture Transformer Expert is an affordable and accurate transformer monitoring, also has the ability to offer automated insights.

Frequently Asked Questions (FAQ):

To speak to our analyst for a discussion on the above findings, click Speak to Analyst

TABLE OF CONTENTS
 
1 INTRODUCTION (Page No. - 31)
    1.1 STUDY OBJECTIVES 
    1.2 MARKET DEFINITION 
    1.3 INCLUSIONS AND EXCLUSIONS 
           1.3.1 TRANSFORMER MONITORING MARKET, BY COMPONENT: INCLUSIONS AND EXCLUSIONS
           1.3.2 MARKET, BY TYPE: INCLUSIONS AND EXCLUSIONS
           1.3.3 MARKET, BY SERVICES: INCLUSIONS AND EXCLUSIONS
           1.3.4 MARKET, BY VOLTAGE: INCLUSIONS AND EXCLUSIONS
           1.3.5 MARKET, BY APPLICATION: INCLUSIONS AND EXCLUSIONS
    1.4 MARKET SCOPE 
           1.4.1 MARKETS COVERED
           1.4.2 REGIONAL SCOPE
           1.4.3 YEARS CONSIDERED
           1.4.4 CURRENCY CONSIDERED
    1.5 LIMITATIONS 
    1.6 STAKEHOLDERS 
    1.7 SUMMARY OF CHANGES 
    1.8 RECESSION IMPACT 
 
2 RESEARCH METHODOLOGY (Page No. - 37)
    2.1 RESEARCH DATA 
           FIGURE 1 TRANSFORMER MONITORING MARKET: RESEARCH DESIGN
    2.2 MARKET BREAKDOWN AND DATA TRIANGULATION 
           FIGURE 2 DATA TRIANGULATION
           2.2.1 SECONDARY DATA
                    2.2.1.1 Key data from secondary sources
           2.2.2 PRIMARY DATA
                    2.2.2.1 Key industry insights
                    2.2.2.2 Breakdown of primaries
    2.3 SCOPE 
           FIGURE 3 MAIN METRICS CONSIDERED TO ANALYZE AND ASSESS DEMAND  FOR TRANSFORMER MONITORING SYSTEMS
    2.4 MARKET SIZE ESTIMATION 
           2.4.1 BOTTOM-UP APPROACH
                    FIGURE 4 MARKET SIZE ESTIMATION METHODOLOGY: BOTTOM-UP APPROACH
           2.4.2 TOP-DOWN APPROACH
                    FIGURE 5 MARKET SIZE ESTIMATION METHODOLOGY: TOP-DOWN APPROACH
           2.4.3 DEMAND-SIDE ANALYSIS
                    2.4.3.1 Regional analysis
                    2.4.3.2 Country-level analysis
                    2.4.3.3 Assumptions for demand-side analysis
                    2.4.3.4 Calculations for demand-side analysis
           2.4.4 SUPPLY-SIDE ANALYSIS
                    FIGURE 6 KEY STEPS CONSIDERED TO ASSESS SUPPLY OF TRANSFORMER MONITORING SYSTEMS
                    FIGURE 7 TRANSFORMERS MONITORING MARKET: SUPPLY-SIDE ANALYSIS
                    2.4.4.1 Calculations for supply-side analysis
                    2.4.4.2 Assumptions for supply-side analysis
                               FIGURE 8 INDUSTRY CONCENTRATION, 2022
           2.4.5 FORECAST
    2.5 RISK ASSESSMENT 
    2.6 IMPACT OF RECESSION 
 
3 EXECUTIVE SUMMARY (Page No. - 50)
    TABLE 1 TRANSFORMER MONITORING MARKET SNAPSHOT 
    FIGURE 9 ASIA PACIFIC TO REGISTER HIGHEST CAGR IN TRANSFORMERS MONITORING MARKET DURING FORECAST PERIOD 
    FIGURE 10 HARDWARE SOLUTIONS SEGMENT TO LEAD MARKET DURING FORECAST PERIOD 
    FIGURE 11 OIL-IMMERSED SEGMENT TO DOMINATE MARKET DURING FORECAST PERIOD 
    FIGURE 12 POWER TRANSFORMERS SEGMENT TO LEAD TRANSFORMER MONITORING MARKET DURING FORECAST PERIOD 
    FIGURE 13 HIGH AND EXTRA HIGH VOLTAGE SEGMENT TO LEAD MARKET DURING FORECAST PERIOD 
    FIGURE 14 OIL MONITORING SEGMENT TO LEAD TRANSFORMERS MONITORING MARKET DURING FORECAST PERIOD 
 
4 PREMIUM INSIGHTS (Page No. - 55)
    4.1 ATTRACTIVE OPPORTUNITIES FOR PLAYERS IN TRANSFORMER MONITORING MARKET 
           FIGURE 15 RISING ADOPTION OF EFFICIENT POWER DISTRIBUTION SYSTEMS
    4.2 TRANSFORMER MONITORING MARKET, BY REGION 
           FIGURE 16 ASIA PACIFIC TO REGISTER HIGHEST CAGR DURING FORECAST PERIOD
    4.3 ASIA PACIFIC MARKET,  BY SERVICES AND COUNTRY, 2022 
           FIGURE 17 OIL MONITORING SEGMENT AND CHINA HELD LARGEST SHARES OF ASIA PACIFIC MARKET IN 2022
    4.4 TRANSFORMERS MONITORING MARKET, BY COMPONENT 
           FIGURE 18 HARDWARE SOLUTIONS SEGMENT TO DOMINATE MARKET IN 2028
    4.5 TRANSFORMERS MONITORING MARKET, BY TYPE 
           FIGURE 19 OIL-IMMERSED SEGMENT TO ACCOUNT FOR LARGEST SHARE OF MARKET IN 2028
    4.6 TRANSFORMER MONITORING MARKET, BY APPLICATION 
           FIGURE 20 POWER TRANSFORMERS SEGMENT TO ACCOUNT FOR LARGEST SHARE OF TRANSFORMERS MONITORING MARKET IN 2028
    4.7 TRANSFORMERS MONITORING MARKET, BY VOLTAGE 
           FIGURE 21 HIGH AND EXTRA HIGH VOLTAGE SEGMENT TO ACCOUNT FOR LARGEST SHARE OF TRANSFORMERS MONITORING MARKET IN 2028
    4.8 TRANSFORMER MONITORING MARKET, BY SERVICES 
           FIGURE 22 OIL MONITORING SEGMENT TO ACCOUNT FOR LARGEST SHARE OF TRANSFORMERS MONITORING MARKET IN 2028
 
5 MARKET OVERVIEW (Page No. - 60)
    5.1 INTRODUCTION 
    5.2 MARKET DYNAMICS 
           FIGURE 23 TRANSFORMER MONITORING MARKET: DRIVERS, RESTRAINTS, OPPORTUNITIES, AND CHALLENGES
           5.2.1 DRIVERS
                    5.2.1.1 Increasing focus on digitalization of utilities
                               TABLE 2 PROJECTS BY DIFFERENT COUNTRIES FOR ENERGY TRANSITION
                               FIGURE 24 INVESTMENTS IN DIGITALIZATION OF TRANSFORMERS,  2015–2022 (USD BILLION)
                    5.2.1.2 Increased investments in renewable and clean energy generation
                               FIGURE 25 GLOBAL CLEAN ENERGY INVESTMENTS, 2015–2023 (USD BILLION)
                               FIGURE 26 ENERGY TRANSITION INVESTMENTS, BY TOP 10 COUNTRIES, 2021 (%)
                               FIGURE 27 ENERGY TRANSITION INVESTMENTS, BY SECTOR, 2021 (USD BILLION)
                    5.2.1.3 Growing use of monitoring systems for transformers
                               FIGURE 28 ELECTRICITY CONSUMPTION, BY COUNTRY, 2022 (TWH)
           5.2.2 RESTRAINTS
                    5.2.2.1 High hardware, software, and installation costs
           5.2.3 OPPORTUNITIES
                    5.2.3.1 Growing use of big data analytics in energy industry
                    5.2.3.2 Increased investments in offshore wind farms
                               FIGURE 29 NEW OFFSHORE INSTALLATIONS, 2016–2022 (MW)
           5.2.4 CHALLENGES
                    5.2.4.1 Low acceptance among end users
    5.3 TRENDS/DISRUPTIONS IMPACTING CUSTOMERS’ BUSINESSES 
           FIGURE 30 TRENDS/DISRUPTIONS IMPACTING CUSTOMERS’ BUSINESSES
    5.4 ECOSYSTEM MAPPING 
           TABLE 3 COMPANIES AND THEIR ROLE IN TRANSFORMER MONITORING ECOSYSTEM
           FIGURE 31 TRANSFORMERS MONITORING MARKET: ECOSYSTEM MAPPING
    5.5 VALUE CHAIN ANALYSIS 
           FIGURE 32 TRANSFORMERS MONITORING MARKET: VALUE CHAIN ANALYSIS
           5.5.1 RAW MATERIAL PROVIDERS/SUPPLIERS/COMPONENT MANUFACTURERS
           5.5.2 TRANSFORMER MONITORING SYSTEM MANUFACTURERS/ASSEMBLERS
           5.5.3 DISTRIBUTORS/RESELLERS
           5.5.4 END USERS
           5.5.5 MAINTENANCE/SERVICE PROVIDERS
    5.6 TECHNOLOGY ANALYSIS 
           5.6.1 SENSORS AND INTERNET OF THINGS (IOT)
           5.6.2 DATA ANALYTICS AND ARTIFICIAL INTELLIGENCE (AI)
           5.6.3 DIGITAL TWINS AND SIMULATION
           5.6.4 CLOUD-BASED AND MOBILE SOLUTIONS
    5.7 PATENT ANALYSIS 
           FIGURE 33 MARKET: PATENT REGISTRATIONS, 2012–2022
           TABLE 4 MARKET: INNOVATIONS AND PATENT REGISTRATIONS, 2019–2023
    5.8 TRADE ANALYSIS 
           5.8.1 IMPORT SCENARIO FOR HS CODE 850423-COMPLIANT PRODUCTS
                    TABLE 5 IMPORT DATA FOR HS CODE 850423-COMPLIANT PRODUCTS, BY COUNTRY,  2020–2022 (USD THOUSAND)
                    FIGURE 34 IMPORT DATA FOR HS CODE 850423-COMPLIANT PRODUCTS, BY TOP FIVE COUNTRIES, 2020–2022 (USD THOUSAND)
           5.8.2 EXPORT SCENARIO FOR HS CODE 850423-COMPLIANT PRODUCTS
                    TABLE 6 EXPORT DATA FOR HS CODE 850423-COMPLIANT PRODUCTS, BY COUNTRY,  2020–2022 (USD THOUSAND)
                    FIGURE 35 EXPORT DATA FOR HS CODE 850423-COMPLIANT PRODUCTS, BY TOP FIVE COUNTRIES, 2020–2022 (USD THOUSAND)
           5.8.3 IMPORT SCENARIO FOR HS CODE 850421-COMPLIANT PRODUCTS
                    TABLE 7 IMPORT DATA FOR HS CODE 850421-COMPLIANT PRODUCTS, BY COUNTRY, 2020–2022 (USD THOUSAND)
                    FIGURE 36 IMPORT SCENARIO FOR HS CODE 850421-COMPLIANT PRODUCTS, BY TOP FIVE COUNTRIES, 2020–2022 (USD THOUSAND)
           5.8.4 EXPORT SCENARIO FOR HS CODE 850421-COMPLIANT PRODUCTS
                    TABLE 8 EXPORT DATA FOR HS CODE 850421-COMPLIANT PRODUCTS, BY COUNTRY,  2020–2022 (USD THOUSAND)
                    FIGURE 37 EXPORT DATA FOR HS CODE 850421-COMPLIANT PRODUCTS, BY TOP FIVE COUNTRIES, 2020–2022 (USD THOUSAND)
    5.9 PRICING ANALYSIS 
           FIGURE 38 AVERAGE SELLING PRICE (ASP) OF TRANSFORMER MONITORING SYSTEMS,  BY APPLICATION, 2021, 2022, 2023, AND 2028 (USD/UNIT)
                    TABLE 9 AVERAGE SELLING PRICE (ASP) OF TRANSFORMER MONITORING SYSTEMS,  BY APPLICATION, 2021, 2022, 2023, AND 2028 (USD/UNIT)
                    TABLE 10 AVERAGE SELLING PRICE (ASP) TREND, BY REGION, 2020, 2021, 2022,  AND 2030 (USD/UNIT)
                    FIGURE 39 AVERAGE SELLING PRICE (ASP) TREND, BY REGION, 2020, 2021,  2022, AND 2030 (USD/UNIT)
    5.10 TARIFF ANALYSIS 
           TABLE 11 TARIFF LEVIED ON TRANSFORMER MONITORING SYSTEMS (HS CODE 850423), 2022
           TABLE 12 TARIFF LEVIED ON TRANSFORMER MONITORING SYSTEMS (HS CODE 850421), 2022
    5.11 STANDARDS AND REGULATORY LANDSCAPE 
           5.11.1 STANDARDS RELATED TO TRANSFORMER MONITORING SYSTEMS
                    TABLE 13 TRANSFORMER MONITORING MARKET: NORTH AMERICAN STANDARDS
                    TABLE 14 MARKET: EUROPEAN STANDARDS
                    TABLE 15 MARKET: ASIA PACIFIC STANDARDS
                    TABLE 16 MARKET: INTERNATIONAL STANDARDS
           5.11.2 REGULATORY BODIES, GOVERNMENT AGENCIES, AND OTHER ORGANIZATIONS
                    TABLE 17 NORTH AMERICA: REGULATORY BODIES, GOVERNMENT AGENCIES,  AND OTHER ORGANIZATIONS
                    TABLE 18 EUROPE: REGULATORY BODIES, GOVERNMENT AGENCIES,  AND OTHER ORGANIZATIONS
                    TABLE 19 ASIA PACIFIC: REGULATORY BODIES, GOVERNMENT AGENCIES,  AND OTHER ORGANIZATIONS
                    TABLE 20 ROW: REGULATORY BODIES, GOVERNMENT AGENCIES, AND OTHER ORGANIZATIONS
    5.12 PORTER’S FIVE FORCES ANALYSIS 
                    FIGURE 40 TRANSFORMER MONITORING MARKET: PORTER’S FIVE FORCES ANALYSIS
                    TABLE 21 MARKET: PORTER’S FIVE FORCES ANALYSIS
           5.12.1 THREAT OF SUBSTITUTES
           5.12.2 BARGAINING POWER OF SUPPLIERS
           5.12.3 BARGAINING POWER OF BUYERS
           5.12.4 THREAT OF NEW ENTRANTS
           5.12.5 INTENSITY OF COMPETITIVE RIVALRY
    5.13 CASE STUDY ANALYSIS 
           5.13.1 EARLY DETECTION OF TEMPERATURE, OIL QUALITY, GAS LEVELS, AND ELECTRICAL CHARACTERISTICS IN TRANSFORMERS BY CONDITION MONITORING
                    5.13.1.1 Problem statement
                    5.13.1.2 Solution
           5.13.2 GUJARAT POWER RESEARCH & DEVELOPMENT (GPRD) DEPLOYED SYSTEM LEVEL SOLUTIONS (SLS)’S REAL-TIME TRANSFORMER MONITORING SYSTEM (TMS) FOR REAL-TIME TRANSFORMER MONITORING
                    5.13.2.1 Problem statement
                    5.13.2.2 Solution
           5.13.3 OMICRON ELECTRONICS GMBH WAS CONTRACTED BY SUBSTATION BASED IN AUSTRIA TO RECTIFY PARTIAL DISCHARGE AND ENSURE OPERATIONAL SAFETY AND RELIABILITY
                    5.13.3.1 Problem statement
                    5.13.3.2 Solution
    5.14 KEY STAKEHOLDERS AND BUYING CRITERIA 
           5.14.1 KEY STAKEHOLDERS IN BUYING PROCESS
                    FIGURE 41 INFLUENCE OF KEY STAKEHOLDERS ON BUYING PROCESS FOR TOP THREE SERVICES
                    TABLE 22 INFLUENCE OF KEY STAKEHOLDERS ON BUYING PROCESS FOR TOP THREE SERVICES
           5.14.2 BUYING CRITERIA
                    FIGURE 42 KEY BUYING CRITERIA FOR TOP THREE SERVICES
                    TABLE 23 KEY BUYING CRITERIA FOR TOP THREE SERVICES
    5.15 KEY CONFERENCES AND EVENTS, 2023–2024 
                    TABLE 24 TRANSFORMERS MONITORING MARKET: LIST OF KEY CONFERENCES AND EVENTS, 2023–2024
 
6 TRANSFORMER MONITORING MARKET, BY VOLTAGE (Page No. - 97)
    6.1 INTRODUCTION 
           FIGURE 43 MARKET, BY VOLTAGE, 2022
           TABLE 25 TRANSFORMER MONITORING MARKET, BY VOLTAGE, 2021–2028 (USD MILLION)
    6.2 LOW VOLTAGE 
           6.2.1 HIGHLY USED TO POWER DEVICES AND SYSTEMS REQUIRING LOWER VOLTAGE
                    TABLE 26 LOW VOLTAGE: TRANSFORMER MONITORING MARKET, BY REGION,  2021–2028 (USD MILLION)
    6.3 MEDIUM VOLTAGE 
           6.3.1 USED TO STEP DOWN HIGHER VOLTAGES SUPPLIED BY GRID TO LEVELS APPROPRIATE FOR INDUSTRIAL OPERATIONS, ENSURING SAFE AND MANAGEABLE ELECTRICITY DISTRIBUTION
                    TABLE 27 MEDIUM VOLTAGE: TRANSFORMERS MONITORING MARKET,  BY REGION, 2021–2028 (USD MILLION)
    6.4 HIGH AND EXTRA HIGH VOLTAGE 
           6.4.1 FACILITATES EARLY FAULT DETECTION, COMPLIANCE ADHERENCE, AND REMOTE OVERSIGHT
                    TABLE 28 HIGH VOLTAGE: TRANSFORMERS MONITORING MARKET, BY REGION,  2021–2028 (USD MILLION)
 
7 TRANSFORMER MONITORING MARKET, BY SERVICES (Page No. - 102)
    7.1 INTRODUCTION 
           FIGURE 44 MARKET, BY SERVICES, 2022
           TABLE 29 TRANSFORMER MONITORING MARKET, BY SERVICES,  2021–2028 (USD MILLION)
    7.2 OIL MONITORING 
           7.2.1 HELPS DETECT ISSUES EARLY AND EXTEND OPERATIONAL LIFE OF TRANSFORMERS
                    TABLE 30 OIL MONITORING: TRANSFORMER MONITORING MARKET, BY REGION,  2021–2028 (USD MILLION)
    7.3 BUSHING MONITORING 
           7.3.1 ENSURES INTEGRITY AND PREVENTS CRIPPLING OF TRANSFORMER, CIRCUIT BREAKER, OR SHUNT REACTOR BUSHING FAILURE
                    TABLE 31 BUSHING MONITORING: TRANSFORMERS MONITORING MARKET, BY REGION, 2021–2028 (USD MILLION)
    7.4 PARTIAL DISCHARGE (PD) MONITORING 
           7.4.1 ENABLES EARLY PROBLEM IDENTIFICATION AND PREVENTATIVE MAINTENANCE
                    TABLE 32 PARTIAL DISCHARGE (PD) MONITORING: TRANSFORMERS MONITORING MARKET, BY REGION, 2021–2028 (USD MILLION)
    7.5 ON-LOAD TAP CHANGER (OLTC) MONITORING 
           7.5.1 ENSURES PROPER FUNCTIONING BY MODIFYING TURN RATIO OF TRANSFORMERS AND ADJUSTING VOLTAGE UNDER VARIOUS LOAD SITUATIONS
                    TABLE 33 ON-LOAD TAP CHANGER (OLTC) MONITORING: TRANSFORMERS MONITORING MARKET, BY REGION, 2021–2028 (USD MILLION)
    7.6 OTHER SERVICES 
           TABLE 34 OTHER SERVICES: MARKET, BY REGION,  2021–2028 (USD MILLION)
 
8 TRANSFORMER MONITORING MARKET, BY COMPONENT (Page No. - 108)
    8.1 INTRODUCTION 
           FIGURE 45 MARKET, BY COMPONENT, 2022
           TABLE 35 TRANSFORMER MONITORING MARKET, BY COMPONENT,  2021–2028 (USD MILLION)
    8.2 HARDWARE SOLUTIONS 
           8.2.1 INCREASED EFFORTS TO IMPROVE EFFICIENCY, RELIABILITY, AND LONGEVITY OF POWER TRANSFORMERS TO DRIVE DEMAND
                    TABLE 36 HARDWARE SOLUTIONS: TRANSFORMERS MONITORING MARKET, BY REGION, 2021–2028 (USD MILLION)
    8.3 SOFTWARE SOLUTIONS 
           8.3.1 GROWING ADOPTION FOR PREVENTATIVE MAINTENANCE, IMPROVING POWER TRANSFORMER PERFORMANCE, AND TRANSFORMING RAW DATA INTO USABLE INSIGHTS TO DRIVE MARKET
                    TABLE 37 SOFTWARE SOLUTIONS: TRANSFORMERS MONITORING MARKET, BY REGION, 2021–2028 (USD MILLION)
 
9 TRANSFORMER MONITORING MARKET, BY APPLICATION (Page No. - 112)
    9.1 INTRODUCTION 
           FIGURE 46 MARKET, BY APPLICATION, 2022
           TABLE 38 TRANSFORMER MONITORING MARKET, BY APPLICATION,  2021–2028 (USD MILLION)
           TABLE 39 MARKET, BY APPLICATION, 2021–2028 (UNITS)
    9.2 POWER TRANSFORMERS 
           9.2.1 CAPABILITY TO DETECT ANOMALIES FOR INFORMED DECISION-MAKING TO DRIVE DEMAND
                    TABLE 40 POWER TRANSFORMERS: TRANSFORMER MONITORING MARKET, BY REGION, 2021–2028 (USD MILLION)
                    TABLE 41 POWER TRANSFORMERS: MARKET,  BY REGION, 2021–2028 (UNITS)
    9.3 DISTRIBUTION TRANSFORMERS 
           9.3.1 ABILITY TO REMOTELY MONITOR AND CONTROL POWER DISTRIBUTION TO FUEL DEMAND
                    TABLE 42 DISTRIBUTION TRANSFORMERS: TRANSFORMER MONITORING MARKET,  BY REGION, 2021–2028 (USD MILLION)
                    TABLE 43 DISTRIBUTION TRANSFORMERS: MARKET,  BY REGION, 2021–2028 (UNITS)
    9.4 OTHER APPLICATIONS 
           TABLE 44 OTHER APPLICATIONS: TRANSFORMERS MONITORING MARKET, BY REGION, 2021–2028 (USD MILLION)
           TABLE 45 OTHER APPLICATIONS: MARKET,  BY REGION, 2021–2028 (UNITS)
 
10 TRANSFORMER MONITORING MARKET, BY TYPE (Page No. - 119)
     10.1 INTRODUCTION 
               FIGURE 47 MARKET, BY TYPE, 2022
               TABLE 46 TRANSFORMER MONITORING MARKET, BY TYPE, 2021–2028 (USD MILLION)
     10.2 OIL-IMMERSED 
             10.2.1 USED IN UTILITIES TO HANDLE POSSIBLE FAULTS, REDUCE UNPLANNED OUTAGES, AND OPTIMIZE TRANSFORMER PERFORMANCE
                       TABLE 47 OIL-IMMERSED: TRANSFORMERS MONITORING MARKET, BY REGION,  2021–2028 (USD MILLION)
     10.3 CAST-RESIN 
             10.3.1 IDEAL FOR REAL-TIME ASSESSMENT OF SOLID INSULATION CONDITION
                       TABLE 48 CAST-RESIN: TRANSFORMERS MONITORING MARKET, BY REGION,  2021–2028 (USD MILLION)
     10.4 OTHER TYPES 
               TABLE 49 OTHER TYPES: MARKET, BY REGION,  2021–2028 (USD MILLION)
 
11 TRANSFORMER MONITORING MARKET, BY REGION (Page No. - 124)
     11.1 INTRODUCTION 
               FIGURE 48 MARKET, BY REGION, 2022 (%)
               FIGURE 49 ASIA PACIFIC TO REGISTER HIGHEST CAGR DURING FORECAST PERIOD
               TABLE 50 TRANSFORMER MONITORING MARKET, BY REGION, 2021–2028 (USD MILLION)
               TABLE 51 MARKET, BY COMPONENT,  2021–2028 (USD MILLION)
               TABLE 52 MARKET, BY SERVICES,  2021–2028 (USD MILLION)
               TABLE 53 MARKET, BY TYPE, 2021–2028 (USD MILLION)
               TABLE 54 MARKET, BY VOLTAGE, 2021–2028 (USD MILLION)
               TABLE 55 MARKET, BY APPLICATION,  2021–2028 (USD MILLION)
     11.2 NORTH AMERICA 
             11.2.1 NORTH AMERICAN MARKET: RECESSION IMPACT
                       FIGURE 50 NORTH AMERICA: MARKET SNAPSHOT
                       TABLE 56 NORTH AMERICA: TRANSFORMER MONITORING MARKET, BY COUNTRY,  2021–2028 (USD MILLION)
                       TABLE 57 NORTH AMERICA: MARKET, BY COMPONENT, 2021–2028 (USD MILLION)
                       TABLE 58 NORTH AMERICA: MARKET, BY SERVICES,  2021–2028 (USD MILLION)
                       TABLE 59 NORTH AMERICA: MARKET,  BY TYPE, 2021–2028 (USD MILLION)
                       TABLE 60 NORTH AMERICA: MARKET, BY VOLTAGE,  2021–2028 (USD MILLION)
                       TABLE 61 NORTH AMERICA: MARKET, BY APPLICATION, 2021–2028 (USD MILLION)
             11.2.2 US
                       11.2.2.1 Growing electricity demand and need for reliable and efficient operation of power utilities
                                   TABLE 62 US: TRANSFORMER MONITORING MARKET, BY SERVICES,  2021–2028 (USD MILLION)
             11.2.3 CANADA
                       11.2.3.1 Rising use to reduce operational risks and ensure reliability of power transformers in technologically evolving landscape
                                   TABLE 63 CANADA: MARKET, BY SERVICES,  2021–2028 (USD MILLION)
             11.2.4 MEXICO
                       11.2.4.1 Increasing use of renewable energy and growing emphasis on sustainability and grid resilience
                                   TABLE 64 MEXICO: MARKET, BY SERVICES,  2021–2028 (USD MILLION)
     11.3 EUROPE 
               FIGURE 51 EUROPE: MARKET SNAPSHOT
             11.3.1 EUROPEAN MARKET: RECESSION IMPACT
                       TABLE 65 EUROPE: TRANSFORMER MONITORING MARKET, BY COUNTRY,  2021–2028 (USD MILLION)
                       TABLE 66 EUROPE: MARKET, BY COMPONENT,  2021–2028 (USD MILLION)
                       TABLE 67 EUROPE: MARKET, BY SERVICES,  2021–2028 (USD MILLION)
                       TABLE 68 EUROPE: MARKET, BY TYPE,  2021–2028 (USD MILLION)
                       TABLE 69 EUROPE: MARKET, BY VOLTAGE,  2021–2028 (USD MILLION)
                       TABLE 70 EUROPE: MARKET, BY APPLICATION,  2021–2028 (USD MILLION)
             11.3.2 UK
                       11.3.2.1 Growing adoption of innovative monitoring systems
                                   TABLE 71 UK: TRANSFORMER MONITORING MARKET, BY SERVICES,  2021–2028 (USD MILLION)
             11.3.3 GERMANY
                       11.3.3.1 Expansion of T&D network with shift from nuclear and fossil fuels to renewable energy
                                   TABLE 72 GERMANY: TRANSFORMERS MONITORING MARKET, BY SERVICES,  2021–2028 (USD MILLION)
             11.3.4 FRANCE
                       11.3.4.1 Decommissioning of aging nuclear plants and growing importance of reliable and efficient power infrastructure
                                   TABLE 73 FRANCE: TRANSFORMERS MONITORING MARKET, BY SERVICES,  2021–2028 (USD MILLION)
             11.3.5 ITALY
                       11.3.5.1 Increased power consumption and use of renewable energy sources
                                   TABLE 74 ITALY: TRANSFORMERS MONITORING MARKET, BY SERVICES,  2021–2028 (USD MILLION)
             11.3.6 RUSSIA
                       11.3.6.1 Rising government-led investments in modernization of power grids
                                   TABLE 75 RUSSIA: TRANSFORMERS MONITORING MARKET, BY SERVICES,  2021–2028 (USD MILLION)
             11.3.7 REST OF EUROPE
                       TABLE 76 REST OF EUROPE: MARKET, BY SERVICES,  2021–2028 (USD MILLION)
     11.4 ASIA PACIFIC 
               FIGURE 52 ASIA PACIFIC: MARKET SNAPSHOT
             11.4.1 ASIA PACIFIC MARKET: RECESSION IMPACT
                       TABLE 77 ASIA PACIFIC: TRANSFORMER MONITORING MARKET , BY COUNTRY,  2021–2028 (USD MILLION)
                       TABLE 78 ASIA PACIFIC: MARKET, BY COMPONENT,  2021–2028 (USD MILLION)
                       TABLE 79 ASIA PACIFIC: MARKET, BY SERVICES,  2021–2028 (USD MILLION)
                       TABLE 80 ASIA PACIFIC: MARKET, BY TYPE,  2021–2028 (USD MILLION)
                       TABLE 81 ASIA PACIFIC: MARKET, BY VOLTAGE,  2021–2028 (USD MILLION)
                       TABLE 82 ASIA PACIFIC: MARKET, BY APPLICATION,  2021–2028 (USD MILLION)
             11.4.2 CHINA
                       11.4.2.1 Rising focus on grid stability and sustainability
                                   TABLE 83 CHINA: MARKET, BY SERVICES,  2021–2028 (USD MILLION)
             11.4.3 JAPAN
                       11.4.3.1 Increasing need for modernized and resilient power grids
                                   TABLE 84 JAPAN: TRANSFORMER MONITORING MARKET, BY SERVICES,  2021–2028 (USD MILLION)
             11.4.4 INDIA
                       11.4.4.1 Growing need for dependable and efficient power supply and aging transformer infrastructure
                                   TABLE 85 INDIA: MARKET, BY SERVICES,  2021–2028 (USD MILLION)
             11.4.5 SOUTH KOREA
                       11.4.5.1 Increased power consumption and adoption of renewable sources for electricity production
                                   TABLE 86 SOUTH KOREA: TRANSFORMER MONITORING MARKET, BY SERVICES,  2021–2028 (USD MILLION)
             11.4.6 AUSTRALIA
                       11.4.6.1 Increasing electricity demand, growing share of renewable energy sources, and rising adoption of distributed generation
                                   TABLE 87 AUSTRALIA: TRANSFORMERS MONITORING MARKET, BY SERVICES,  2021–2028 (USD MILLION)
             11.4.7 REST OF ASIA PACIFIC
                       TABLE 88 REST OF ASIA PACIFIC: MARKET, BY SERVICES, 2021–2028 (USD MILLION)
     11.5 SOUTH AMERICA 
             11.5.1 SOUTH AMERICAN MARKET: RECESSION IMPACT
                       TABLE 89 SOUTH AMERICA: TRANSFORMER MONITORING MARKET, BY COUNTRY, 2021–2028 (USD MILLION)
                       TABLE 90 SOUTH AMERICA: MARKET, BY COMPONENT, 2021–2028 (USD MILLION)
                       TABLE 91 SOUTH AMERICA: MARKET, BY SERVICES,  2021–2028 (USD MILLION)
                       TABLE 92 SOUTH AMERICA: MARKET, BY TYPE,  2021–2028 (USD MILLION)
                       TABLE 93 SOUTH AMERICA: MARKET, BY VOLTAGE,  2021–2028 (USD MILLION)
                       TABLE 94 SOUTH AMERICA: MARKET, BY APPLICATION, 2021–2028 (USD MILLION)
             11.5.2 BRAZIL
                       11.5.2.1 Growing solar power generation
                                   TABLE 95 BRAZIL: TRANSFORMER MONITORING MARKET, BY SERVICES,  2021–2028 (USD MILLION)
             11.5.3 ARGENTINA
                       11.5.3.1 Increased hydroelectricity generation
                                   TABLE 96 ARGENTINA: TRANSFORMERS MONITORING MARKET, BY SERVICES,  2021–2028 (USD MILLION)
             11.5.4 VENEZUELA
                       11.5.4.1 Presence of aging and underinvested power grids
                                   TABLE 97 VENEZUELA: TRANSFORMERS MONITORING MARKET, BY SERVICES,  2021–2028 (USD MILLION)
             11.5.5 REST OF SOUTH AMERICA
                       TABLE 98 REST OF SOUTH AMERICA: MARKET, BY SERVICES, 2021–2028 (USD MILLION)
     11.6 MIDDLE EAST & AFRICA 
             11.6.1 MIDDLE EASTERN & AFRICAN MARKET: RECESSION IMPACT
                       TABLE 99 MIDDLE EAST & AFRICA: TRANSFORMER MONITORING MARKET, BY COUNTRY, 2021–2028 (USD MILLION)
                       TABLE 100 MIDDLE EAST & AFRICA: MARKET,  BY COMPONENT, 2021–2028 (USD MILLION)
                       TABLE 101 MIDDLE EAST & AFRICA: MARKET, BY SERVICES, 2021–2028 (USD MILLION)
                       TABLE 102 MIDDLE EAST & AFRICA: MARKET, BY TYPE,  2021–2028 (USD MILLION)
                       TABLE 103 MIDDLE EAST & AFRICA: MARKET, BY VOLTAGE, 2021–2028 (USD MILLION)
                       TABLE 104 MIDDLE EAST & AFRICA: MARKET,  BY APPLICATION, 2021–2028 (USD MILLION)
             11.6.2 GCC COUNTRIES
                       11.6.2.1 High electricity demand in residential sector
                                   TABLE 105 UAE: TRANSFORMER MONITORING MARKET, BY COUNTRY,  2021–2028 (USD MILLION)
                                   TABLE 106 UAE: MARKET, BY SERVICES,  2021–2028 (USD MILLION)
                       11.6.2.2 UAE
                                   11.6.2.2.1 Rising investments in solar energy generation
                                   TABLE 107 UAE: MARKET, BY SERVICES,  2021–2028 (USD MILLION)
                       11.6.2.3 SAUDI ARABIA
                                   11.6.2.3.1 Expansion of grids and energy diversification
                                   TABLE 108 SAUDI ARABIA: MARKET, BY SERVICES, 2021–2028 (USD MILLION)
                       11.6.2.4 QATAR
                                   11.6.2.4.1 Increased electricity generation capacity year-on-year
                                   TABLE 109 QATAR: MARKET, BY SERVICES,  2021–2028 (USD MILLION)
                       11.6.2.5 REST OF GCC COUNTRIES
                                   TABLE 110 REST OF GCC COUNTRIES: MARKET, BY SERVICES, 2021–2028 (USD MILLION)
             11.6.3 IRAN
                       11.6.3.1 Growing use of renewable energy sources and aging transformer infrastructure
                                   TABLE 111 IRAN: MARKET, BY SERVICES,  2021–2028 (USD MILLION)
             11.6.4 ALGERIA
                       11.6.4.1 Growing deployment in power grids and oil & gas fields
                                   TABLE 112 ALGERIA: TRANSFORMERS MONITORING MARKET, BY SERVICES,  2021–2028 (USD MILLION)
             11.6.5 SOUTH AFRICA
                       11.6.5.1 Increased power generation using coal and growing use to improve transformer dependability and longevity by giving real-time data on performance and potential defects
                                   TABLE 113 SOUTH AFRICA: TRANSFORMERS MONITORING MARKET, BY SERVICES,  2021–2028 (USD MILLION)
             11.6.6 REST OF MIDDLE EAST & AFRICA
                       TABLE 114 REST OF MIDDLE EAST & AFRICA: TRANSFORMERS MONITORING MARKET,  BY SERVICES, 2021–2028 (USD MILLION)
 
12 COMPETITIVE LANDSCAPE (Page No. - 166)
     12.1 OVERVIEW 
     12.2 MAJOR STRATEGIES ADOPTED BY KEY PLAYERS 
               FIGURE 53 MARKET: MAJOR STRATEGIES ADOPTED BY KEY PLAYERS, 2018–2023
     12.3 MARKET SHARE ANALYSIS, 2022 
               FIGURE 54 MARKET SHARE ANALYSIS, 2022
     12.4 REVENUE ANALYSIS OF FIVE KEY PLAYERS, 2018–2022 
               FIGURE 55 MARKET: ANNUAL REVENUE ANALYSIS OF FIVE KEY PLAYERS, 2018–2022
     12.5 COMPETITIVE SCENARIOS AND TRENDS 
             12.5.1 DEALS
                       TABLE 116 MARKET: DEALS, 2018–2023
             12.5.2 OTHERS
                       TABLE 117 MARKET: OTHERS, 2018–2023
     12.6 COMPANY EVALUATION MATRIX, 2022 
               FIGURE 56 MARKET: COMPANY EVALUATION MATRIX, 2022
             12.6.1 STARS
             12.6.2 EMERGING LEADERS
             12.6.3 PERVASIVE PLAYERS
             12.6.4 PARTICIPANTS
             12.6.5 COMPANY FOOTPRINT
                       TABLE 118 COMPONENT: COMPANY FOOTPRINT
                       TABLE 119 TYPE: COMPANY FOOTPRINT
                       TABLE 120 SERVICES: COMPANY FOOTPRINT
                       TABLE 121 VOLTAGE: COMPANY FOOTPRINT
                       TABLE 122 APPLICATION: COMPANY FOOTPRINT
                       TABLE 123 REGION: COMPANY FOOTPRINT
                       TABLE 124 COMPANY OVERALL FOOTPRINT
     12.7 STARTUPS/SMALL AND MEDIUM-SIZED ENTERPRISES (SMES) EVALUATION MATRIX, 2022 
               FIGURE 57 MARKET: STARTUPS/SMALL AND MEDIUM-SIZED ENTERPRISES (SMES) EVALUATION MATRIX, 2022
             12.7.1 PROGRESSIVE COMPANIES
             12.7.2 RESPONSIVE COMPANIES
             12.7.3 DYNAMIC COMPANIES
             12.7.4 STARTING BLOCKS
             12.7.5 COMPETITIVE BENCHMARKING
                       TABLE 125 TRANSFORMER MONITORING MARKET: LIST OF KEY STARTUPS/SMES
                       TABLE 126 COMPETITIVE BENCHMARKING OF KEY STARTUPS/SMES, BY COMPONENT
                       TABLE 127 COMPETITIVE BENCHMARKING OF KEY STARTUPS/SMES, BY TYPE
                       TABLE 128 COMPETITIVE BENCHMARKING OF KEY STARTUPS/SMES, BY SERVICES
                       TABLE 129 COMPETITIVE BENCHMARKING OF KEY STARTUPS/SMES, BY VOLTAGE
                       TABLE 130 COMPETITIVE BENCHMARKING OF KEY STARTUPS/SMES, BY REGION
                       TABLE 131 KEY STARTUPS/SMES OVERALL FOOTPRINT
 
13 COMPANY PROFILES (Page No. - 186)
(Business overview, Products/Services/Solutions offered, Recent Developments, MNM view)*
     13.1 KEY PLAYERS 
             13.1.1 SIEMENS ENERGY AG
                       TABLE 132 SIEMENS ENERGY AG: COMPANY OVERVIEW
                       FIGURE 58 SIEMENS ENERGY AG: COMPANY SNAPSHOT
                       TABLE 133 SIEMENS ENERGY AG: PRODUCTS/SOLUTIONS/SERVICES OFFERED
                       TABLE 134 SIEMENS ENERGY AG: PRODUCT LAUNCHES
             13.1.2 ABB
                       TABLE 135 ABB: COMPANY OVERVIEW
                       FIGURE 59 ABB: COMPANY SNAPSHOT
                       TABLE 136 ABB: PRODUCTS/SOLUTIONS/SERVICES OFFERED
                       TABLE 137 ABB: PRODUCT LAUNCHES
             13.1.3 GE
                       TABLE 138 GE: COMPANY OVERVIEW
                       FIGURE 60 GE: COMPANY SNAPSHOT
                       TABLE 139 GE: PRODUCTS/SOLUTIONS/SERVICES OFFERED
                       TABLE 140 GE: DEALS
             13.1.4 SCHNEIDER ELECTRIC
                       TABLE 141 SCHNEIDER ELECTRIC: COMPANY OVERVIEW
                       FIGURE 61 SCHNEIDER ELECTRIC: COMPANY SNAPSHOT
                       TABLE 142 SCHNEIDER ELECTRIC: PRODUCTS/SOLUTIONS/SERVICES OFFERED
                       TABLE 143 SCHNEIDER ELECTRIC: PRODUCT LAUNCHES
                       TABLE 144 SCHNEIDER ELECTRIC: DEALS
                       TABLE 145 SCHNEIDER ELECTRIC: OTHERS
             13.1.5 EATON
                       TABLE 146 EATON: COMPANY OVERVIEW
                       FIGURE 62 EATON: COMPANY SNAPSHOT
                       TABLE 147 EATON: PRODUCTS/SOLUTIONS/SERVICES OFFERED
                       TABLE 148 EATON: OTHERS
             13.1.6 MISTRAS GROUP
                       TABLE 149 MISTRAS GROUP: COMPANY OVERVIEW
                       FIGURE 63 MISTRAS GROUP: COMPANY SNAPSHOT
                       TABLE 150 MISTRAS GROUP: PRODUCTS/SOLUTIONS/SERVICES OFFERED
             13.1.7 MITSUBISHI ELECTRIC CORPORATION
                       TABLE 151 MITSUBISHI ELECTRICAL CORPORATION: COMPANY OVERVIEW
                       FIGURE 64 MITSUBISHI ELECTRICAL CORPORATION: COMPANY SNAPSHOT
                       TABLE 152 MITSUBISHI ELECTRICAL CORPORATION: PRODUCTS/SOLUTIONS/SERVICES OFFERED
                       TABLE 153 MITSUBISHI ELECTRICAL CORPORATION: DEALS
             13.1.8 VAISALA
                       TABLE 154 VAISALA: COMPANY OVERVIEW
                       FIGURE 65 VAISALA: COMPANY SNAPSHOT
                       TABLE 155 VAISALA: PRODUCTS/SOLUTIONS/SERVICES OFFERED
             13.1.9 HITACHI ENERGY LTD
                       TABLE 156 HITACHI ENERGY LTD: COMPANY OVERVIEW
                       TABLE 157 HITACHI ENERGY LTD: PRODUCTS/SOLUTIONS/SERVICES OFFERED
             13.1.10 KJ DYNATECH, INC.
                       TABLE 158 KJ DYNATECH, INC.: COMPANY OVERVIEW
                       TABLE 159 KJ DYNATECH, INC.: PRODUCTS/SOLUTIONS/SERVICES OFFERED
             13.1.11 MASCHINENFABRIK REINHAUSEN GMBH
                       TABLE 160 MASCHINENFABRIK REINHAUSEN GMBH: COMPANY OVERVIEW
                       TABLE 161 MASCHINENFABRIK REINHAUSEN GMBH: PRODUCTS/SOLUTIONS/SERVICES OFFERED
                       TABLE 162 MASCHINENFABRIK REINHAUSEN GMBH: DEALS
                       TABLE 163 MASCHINENFABRIK REINHAUSEN GMBH: OTHERS
             13.1.12 QUALITROL
                       TABLE 164 QUALITROL: COMPANY OVERVIEW
                       TABLE 165 QUALITROL: PRODUCTS/SOLUTIONS/SERVICES OFFERED
                       TABLE 166 QUALITROL: PRODUCT LAUNCHES
             13.1.13 GASERA
                       TABLE 167 GASERA: COMPANY OVERVIEW
                       TABLE 168 GASERA: PRODUCTS/SOLUTIONS/SERVICES OFFERED
             13.1.14 DOBLE ENGINEERING COMPANY
                       TABLE 169 DOBLE ENGINEERING COMPANY: COMPANY OVERVIEW
                       TABLE 170 DOBLE ENGINEERING COMPANY: PRODUCTS/SOLUTIONS/SERVICES OFFERED
                       TABLE 171 DOBLE ENGINEERING COMPANY: PRODUCT LAUNCHES
                       TABLE 172 DOBLE ENGINEERING COMPANY: DEALS
             13.1.15 WILSON TRANSFORMERS
                       TABLE 173 WILSON TRANSFORMERS: COMPANY OVERVIEW
                       TABLE 174 WILSON TRANSFORMERS: PRODUCTS/SOLUTIONS/SERVICES OFFERED
     13.2 OTHER PLAYERS 
             13.2.1 SAIELECTRICAL
             13.2.2 CAMLIN LTD
             13.2.3 TREETECH
             13.2.4 EMCO ELECTRONICS
             13.2.5 ADVANCED POWER TECHNOLOGIES LLC
             13.2.6 KONCAR - ELECTRICAL ENGINEERING INSTITUTE LTD.
             13.2.7 CMSGP
             13.2.8 UBICQUIA, INC
             13.2.9 AVL INDIA PRIVATE LTD
*Details on Business overview, Products/Services/Solutions offered, Recent Developments, MNM view might not be captured in case of unlisted companies.
 
14 APPENDIX (Page No. - 224)
     14.1 INSIGHTS FROM INDUSTRY EXPERTS 
     14.2 DISCUSSION GUIDE 
     14.3 KNOWLEDGESTORE: MARKETSANDMARKETS’  SUBSCRIPTION PORTAL 
     14.4 CUSTOMIZATION OPTIONS 
     14.5 RELATED REPORTS 
     14.6 AUTHOR DETAILS 

The study involved major activities in estimating the current size of the transformer monitoring market. Exhaustive secondary research was done to collect information on the peer and parent markets. The next step was to validate these findings, assumptions, and sizing with industry experts across the value chain through primary research. Both top-down and bottom-up approaches were employed to estimate the complete market size. Thereafter, market breakdown and data triangulation were used to estimate the market size of the segments and subsegments.

Secondary Research

This research study on the Transformers Monitoring market involved the use of extensive secondary sources, directories, and databases, such as The Transformer Association, American Public Power Association, Transformer Manufacturing Association of America, National Electrical Manufacturers Association, US Department of Energy, Electro-Federation Canada (EFC), The European Power Supplies Manufacturers' Association, China Electronic Production Equipment Industry Association, and Bureau of Energy Efficiency, to identify and collect information useful for a technical, market-oriented, and commercial study of the global market. The other secondary sources included annual reports, press releases & investor presentations of companies, white papers, certified publications, articles by recognized authors, manufacturer associations, trade directories, and databases.

Primary Research

The transformer monitoring market comprises several stakeholders such as transformer monitoring manufacturers, manufacturers of subcomponents of transformer monitoring, manufacturing technology providers, and technology support providers in the supply chain. The demand side of this market is characterized by the rising demand for utilities and microgrid companies that utilize transformer monitoring systems to meet their sustainability requirements are categorized as end users. Moreover, the increasing requirement for reliable power supply, aging infrastructure, and the growing adoption of smart grid technologies are driving increased demand for transformer monitoring. Transformer monitoring ensures preventative maintenance, reduces downtime, and improves the operation of power distribution systems.
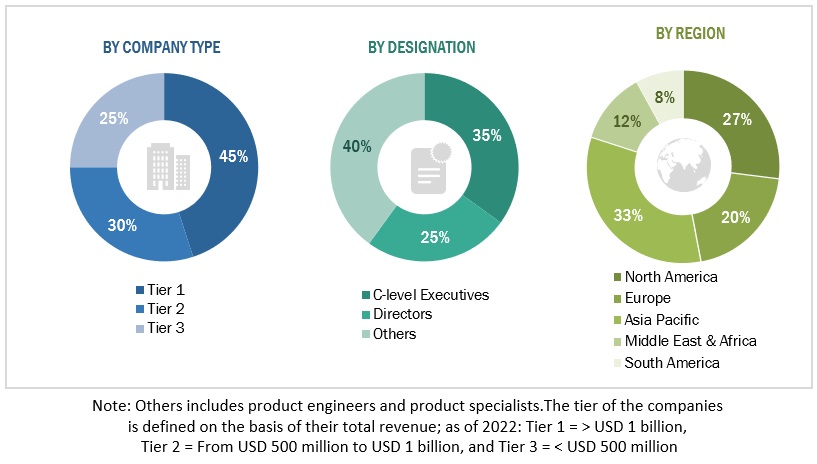
Transformer Monitoring  Market Size, and Share

To know about the assumptions considered for the study, download the pdf brochure

Market Size Estimation

Both top-down and bottom-up approaches were used to estimate and validate the total size of the Transformers Monitoring market. These methods were also used extensively to estimate the size of various subsegments in the market. The research methodology used to estimate the market size includes the following:

  • The key players in the industry and market have been identified through extensive secondary research, and their market share in the respective regions have been determined through both primary and secondary research.
  • The industry’s value chain and market size, in terms of value, have been determined through primary and secondary research processes.
  • All percentage shares, splits, and breakdowns have been determined using secondary sources and verified through primary sources.

Global Transformer Monitoring Market Size: Top-down Approach
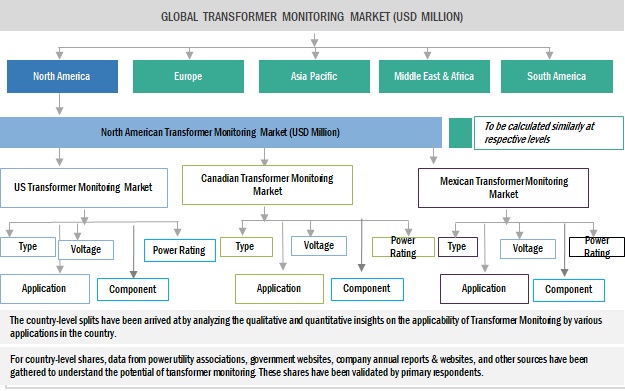
Transformer Monitoring  Market Top Down Approach

To know about the assumptions considered for the study, Request for Free Sample Report

Global Transformer Monitoring Market Size: Bottom-Up Approach

Transformer Monitoring  Market Bottom Up Approach

Data Triangulation

After arriving at the overall market size from the estimation process explained above, the total market has been split into several segments and subsegments. To complete the overall market engineering process and arrive at the exact statistics for all the segments and subsegments, the data triangulation and market breakdown processes have been employed, wherever applicable. The data has been triangulated by studying various factors and trends from both the demand- and supply sides. Along with this, the market has been validated using both the top-down and bottom-up approaches.

Market Definition

Transformer monitoring actively analyses numerous operating variables to ensure optimal operation. Transformer monitors collect data and transmit alarms to alert the user if something appears to be wrong. Transformer monitors detects the signs of transformer failure by monitoring the cooling system, load tap changer, dissolved gas, bushing power factor and capacitance, partial discharge, oil levels, pressure, temperatures and other parameters.

Key Stakeholders

  • Transformer Manufacturing Companies
  • Builders and Contractors
  • Government and Industry Associations
  • Investment and Consulting Firms
  • Power Distribution Utilities
  • Power transformer component manufacturers, dealers, and suppliers
  • Substation equipment manufacturing companies
  • Power grid project developers
  • Process and Manufacturing Plants
  • State and National Regulatory Authorities
  • State- or Government-Owned Corporations

Objectives of the Study

  • To define, describe, segment, and forecast the Transformer Monitoring market, in terms of value and volume, component, type, services, voltage, application, and region
  • To forecast the market size for five key regions: North America, South America, Europe, Asia Pacific, and Middle East & Africa, along with their key countries
  • To provide detailed information about the key drivers, restraints, opportunities, and challenges influencing the growth of the market
  • To strategically analyze the subsegments with respect to individual growth trends, prospects, and contributions of each segment to the overall market size
  • To analyze market opportunities for stakeholders and the competitive landscape of the market
  • To strategically profile the key players and comprehensively analyze their market shares and core competencies
  • To analyze competitive developments, such as deals and agreements in the market

Available Customizations:

With the given market data, MarketsandMarkets offers customizations as per the client’s specific needs. The following customization options are available for this report:

Geographic Analysis

  • Further breakdown of region or country-specific analysis

Company Information

  • Detailed analyses and profiling of additional market players (up to 5)
Custom Market Research Services

We will customize the research for you, in case the report listed above does not meet with your exact requirements. Our custom research will comprehensively cover the business information you require to help you arrive at strategic and profitable business decisions.

Request Customization
Report Code
EP 4706
Published ON
Dec, 2023
Choose License Type
BUY NOW
  • SHARE
X
Request Customization
Speak to Analyst
Speak to Analyst
OR FACE-TO-FACE MEETING
PERSONALIZE THIS RESEARCH
  • Triangulate with your Own Data
  • Get Data as per your Format and Definition
  • Gain a Deeper Dive on a Specific Application, Geography, Customer or Competitor
  • Any level of Personalization
REQUEST A FREE CUSTOMIZATION
LET US HELP YOU!
  • What are the Known and Unknown Adjacencies Impacting the Transformer Monitoring Market
  • What will your New Revenue Sources be?
  • Who will be your Top Customer; what will make them switch?
  • Defend your Market Share or Win Competitors
  • Get a Scorecard for Target Partners
CUSTOMIZED WORKSHOP REQUEST
  • Call Us
  • +1-888-600-6441 (Corporate office hours)
  • +1-888-600-6441 (US/Can toll free)
  • +44-800-368-9399 (UK office hours)
CONNECT WITH US
ABOUT TRUST ONLINE
©2024 MarketsandMarkets Research Private Ltd. All rights reserved
DMCA.com Protection Status
Website Feedback