Global Smart TV Market (2011 � 2016) Critical Capability, Use Case Analysis & Forecast By Accessories, Platforms, Middleware, Application & Geography


The need of the hour and focus on the future are the driving factors for the global smart TV market. A smart TV device is either a television set with integrated Internet capabilities or a set-top box for television that offers more advanced computing ability and connectivity than a contemporary basic television set. The report illustrates the current market of smart TV�s that enable consumers to search, chat, browser, share, update, download, etc. in face of emphasis on experience design over the next five years with insights into:
- Changing psychological consumer behavior and its impact on the commercial sector
- The feasibility of potential applications for smart TV in the consumer electronics market
- The integration of smart TV platforms with IC technology solutions
Smart TV market research report also captures the market roadmap with market sizes, revenue forecasts, value chain, market & product trends, price trends and regulations, competitive landscape, leading players, and their key developments, strategy and profile.
The companies are employing numerous strategies such as new product developments, mergers & acquisitions, partnerships, collaborations, contracts, and agreements to gain a competitive edge over rivals. The key growth strategy adopted by most of the companies in global market is new product development & research. The reason behind this increase is the fact that the companies are coming up with better and more efficient products to cater to the demand in the future. New products launch accounted for almost 41% of the strategic developments. Partnerships, collaborations, contracts, and agreements accounted for almost 27% of the total strategic developments, followed by expansion; which accounted for 7% of growth strategies adapted from January 2009 to November 2011.
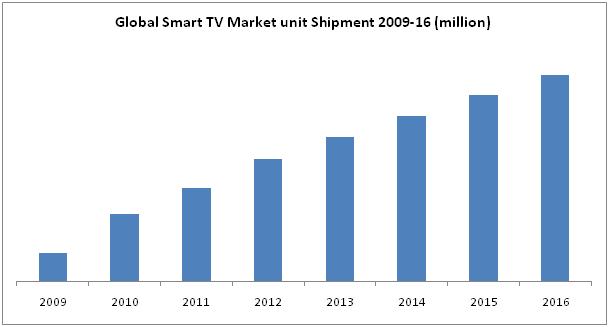
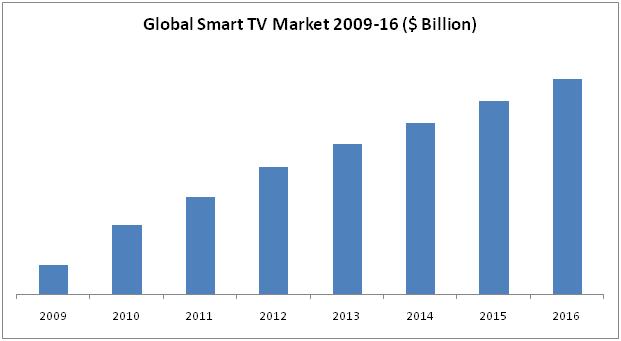
The overall smart TV market was worth $86 billion in 2010 and is expected to reach $265 billion by the end of 2016 at a CAGR of 17%. In terms of unit shipments, smart TV was valued at 43.6 million units in 2010 and reached around 64 million by the end of 2011 at an annual growth of 47%. By 2016, smart TV unit shipment is expected to reach 153.2 million units at a CAGR of 19%.
Scope of the report
This smart TV industry research report categorizes the global market on the basis of various applications, technology, middleware provider, operating system, smart TV application, accessories market, and geographical analysis; forecasting revenue, and analyzing trends in the market.
On the basis of applications
The application market will leverage on the market growth. It will provide application creators, aggregators, and integrators with a whale of opportunities. There are loads of companies creating content and having widgets for the smart TV.
Smart TV is going to be use in the different field or areas such as:
- Home entertainment
- Office purpose
- Educational purpose
On the basis of geography
- North America
- Europe
- Asia-Pacific
- ROW
- With special coverage of:
- Poland
- Japan
- Korea
Each section will provide market data, market drivers, trends and opportunities, key players, and competitive outlook. It will also provide market tables for covering the sub-segments and micro-markets. In addition, the report provides more than 20 company profiles covering all the sub-segments.
Smart TV is an area in the field of TV industry that has drawn the attention of loads of people, including manufacturers, vendors, content providers, middleware providers, advertising agencies, and most importantly - consumers. This is the reason why smart TV industry is growing on a huge rate.
A smart TV device is either a television set with integrated internet capabilities or a set-top box for television that offers more advanced computing ability and connectivity than a contemporary basic television set. The global market report illustrates the current market of smart TV�s that let consumers search, chat, browser, share, update, download, etc. in face of the emphasis of experience design over the next five years.
Smart TV provides complete home entertainment to the consumer. It has everything that we imagine on television. This can be referred to as an extended or the upgraded version of the smartphone. The applications that were earlier developed for smartphones are now looking for their market in smart TV category. Android, which is a big player in the smartphone industry, is now getting a good exposure to this market, the only difference we can notice: smartphone is to be used by an individual and smart TV by a large audience - say family.
There are various companies currently involved in the market in either way through TV manufacturing, integrating, middleware, content creations, advertising, etc. Some of the key players are Samsung (South Korea), Sony (Japan), LG Electronics (South Korea), Google (U.S.), Panasonic (Japan), and Sharp (U.S.). In countries like South Korea, Governments are proactively supporting the smart TV industry players. Korea is the home country of the two majors such as Samsung and LG Electronics.
Source: MarketsandMarkets Analysis
Source: MarketsandMarkets Analysis
 Exclusive indicates content/data unique to MarketsandMarkets and not available with any competitors.
TABLE OF CONTENTS
1 INTRODUCTION
1.1 KEY TAKE-AWAYS
1.2 REPORT DESCRIPTION
1.3 MARKETS COVERED
1.4 STAKEHOLDERS
1.5 RESEARCH METHODOLOGY
2 SUMMARY
3 MARKET OVERVIEW
3.1 EVOLUTION OF TELEVISION
3.1.1 PICTORIAL REPRESENTATION
3.1.2 INTRODUCTION OF INTERNET TO TV
3.1.3 OVERVIEW OF GLOBAL TV MARKET
3.2 OVERVIEW OF SMART TV INDUSTRY
3.3 OVERVIEW OF CONNECTED DEVICES MARKET, 2010 � 16
3.4 INDUSTRY LIFE CYCLE
3.5 VALUE CHAIN ANALYSIS
3.5.1 CONTENT CREATORS
3.5.2 AGGREGATORS
3.5.3 DISTRIBUTORS
3.5.4 INTEGRATOR
3.6 MARKET DYNAMICS
3.6.1 MARKET DRIVERS
3.6.1.1 Expected high demand in future
3.6.1.2 Industry leaders investing high on technology
3.6.1.3 Industry leaders joining together
3.6.1.4 Growing pool of internet users
3.6.2 MARKET RESTRAINTS
3.6.2.1 Fear, uncertainty, and doubt of customer
3.6.2.2 TV vs PC
3.6.3 OPPORTUNITIES
3.6.3.1 Wide open Western Europe, U.S. & China markets
3.6.3.2 Technology shift from internet TV to smart TV
3.6.3.3 Opening advertising platform
3.7 ACCESSORIES MARKET ANALYSIS FOR SMART TV
3.7.1 KEYPADS
3.7.1.1 Comparison matrix
3.7.2 3D GLASSES
3.7.2.1 Comparison matrix
3.7.3 GAMING DEVICES/PLAY STATIONS
3.7.3.1 Comparison matrix
3.7.4 TV CAMERA
3.7.4.1 Comparison matrix
3.7.5 WIRELESS LAN ADAPTOR
3.7.5.1 Comparison matrix
3.8 MARKET SHARE ANALYSIS
3.8.1 MARKET SHARE OF KEY PLAYERS
3.9 WINNING IMPERATIVE
3.10 BURNING ISSUE
3.11 PATENT ANALYSIS
4 CRITICAL CAPABILITIES OF SMART TV
4.1 CRITICAL CAPABILITIES
4.1.1 NORMAL TV BROADCASTING
4.1.2 INTERNET CONNECTABLE & WEB BROWSING
4.1.3 ONLINE VIDEO
4.1.4 SOCIAL NETWORKING
4.1.5 VIDEO ON DEMAND(VOD)
4.1.6 PROGRAM RECORDING
4.1.7 ONLINE MOVIES & MUSIC
4.1.8 BUILT IN APPLICATIONS WITH ABILITY FOR ENHANCEMENT
4.2 USE CASES
5 SMART TV PLATFORMS DEVELOPED, BY TV VENDORS
5.1 PLATFORMS
5.1.1 LG NETCAST
5.1.2 PANASONIC VIERA CAST
5.1.3 PHILIPS NETTV
5.1.4 SAMSUNG SMART TV
5.1.5 SHARP AQUOS NET+
5.1.6 TOSHIBA PLACES
5.2 COMPARISON MATRIX
6 MIDDLEWARE PROVIDERS FOR TV SETS
6.1 MIDDLEWARE PROVIDERS
6.1.1 GOOGLE TV
6.1.2 APPLE TV
6.1.3 YAHOO CONNECTED TV
6.1.4 BOXEE
6.1.5 HYBRID BROADCAST BROADBAND TV (HBBTV)
6.1.6 MEDIAROOM
6.1.7 MEEGO
6.1.8 TRU2WAY
6.1.9 TVBLOB
6.1.10 XBMC MEDIA CENTER
6.2 COMPARISON MATRIX
7 SMART TV MARKET
7.1 BY APPLICATION
7.1.1 HOME ENTERTAINMENT
7.1.2 OFFICE PURPOSE
7.1.3 EDUCATIONAL PURPOSE
7.2 BY PRODUCTS
7.2.1 TV VENDOR PLATFORM
7.2.2 APPLICATIONS
7.3 BY TECHNOLOGY
7.3.1 OPERATING SYSTEM
7.3.2 INTERFACE DESIGN
7.4 BY GEOGRAPHY
7.4.1 NORTH AMERICA
7.4.2 EUROPE
7.4.3 APAC
7.4.4 REST OF THE WORLD (ROW)
7.5 SPECIAL COVERAGE
7.5.1 POLAND
7.5.2 JAPAN
7.5.3 KOREA
8 COMPETITIVE LANDSCAPE
8.1 KEY GROWTH STRATEGIES
8.2 MERGERS & ACQUISITIONS
8.3 NEW PRODUCT DEVELOPMENT & RESEARCH
8.4 AGREEMENTS & COLLABORATIONS
8.5 EXPANSION
8.6 INVESTMENT
8.7 OTHERS
9 COMPANY PROFILES
9.1 APPLE
9.1.1 OVERVIEW
9.1.2 PRODUCTS & SERVICES
9.1.3 FINANCIALS
9.1.4 STRATEGY
9.1.5 DEVELOPMENTS
9.2 AMD
9.2.1 OVERVIEW
9.2.2 PRODUCTS & SERVICES
9.2.3 FINANCIALS
9.2.4 STRATEGY
9.2.5 DEVELOPMENTS
9.3 BOXEE INC.
9.3.1 OVERVIEW
9.3.2 PRODUCTS & SERVICES
9.3.3 STRATEGY
9.3.4 DEVELOPMENTS
9.4 CABLE LABS
9.4.1 OVERVIEW
9.4.2 PRODUCTS & SERVICES
9.4.3 FINANCIALS
9.4.4 STRATEGY
9.4.5 DEVELOPMENTS
9.5 GOOGLE
9.5.1 OVERVIEW
9.5.2 PRODUCTS & SERVICES
9.5.3 FINANCIALS
9.5.4 STRATEGY
9.5.5 DEVELOPMENTS
9.6 HAIER
9.6.1 OVERVIEW
9.6.2 PRODUCTS & SERVICES
9.6.3 FINANCIALS
9.6.4 STRATEGY
9.6.5 DEVELOPMENTS
9.7 INTEL
9.7.1 OVERVIEW
9.7.2 PRODUCTS & SERVICES
9.7.3 FINANCIALS
9.7.4 STRATEGY
9.7.5 DEVELOPMENTS
9.8 LG ELECTRONICS
9.8.1 OVERVIEW
9.8.2 PRODUCT & SERVICES
9.8.3 FINANCIALS
9.8.4 STRATEGY
9.8.5 DEVELOPMENTS
9.9 LOGITECH
9.9.1 OVERVIEW
9.9.2 PRODUCTS & SERVICES
9.9.3 FINANCIALS
9.9.4 STRATEGY
9.9.5 DEVELOPMENTS
9.10 MICROSOFT
9.10.1 OVERVIEW
9.10.2 PRODUCTS & SERVICES
9.10.3 FINANCIALS
9.10.4 STRATEGY
9.10.5 DEVELOPMENTS
9.11 NYXIO TECHNOLOGIES
9.11.1 OVERVIEW
9.11.2 PRODUCTS & SERVICES
9.11.3 STRATEGY
9.11.4 DEVELOPMENTS
9.12 ONIDA (MIRC ELECTRONICS LTD)
9.12.1 OVERVIEW
9.12.2 PRODUCTS & SERVICES
9.12.3 FINANCIALS
9.12.4 STRATEGY
9.12.5 DEVELOPMENTS
9.13 PANASONIC
9.13.1 OVERVIEW
9.13.2 PRODUCTS & SERVICES
9.13.3 FINANCIALS
9.13.4 STRATEGY
9.13.5 DEVELOPMENTS
9.14 PHILIPS
9.14.1 OVERVIEW
9.14.2 PRODUCTS & SERVICES
9.14.3 FINANCIALS
9.14.4 STRATEGY
9.14.5 DEVELOPMENTS
9.15 SAMSUNG
9.15.1 OVERVIEW
9.15.2 PRODUCTS & SERVICES
9.15.3 FINANCIALS
9.15.4 STRATEGY
9.15.5 DEVELOPMENTS
9.16 SHARP
9.16.1 OVERVIEW
9.16.2 PRODUCTS & SERVICES
9.16.3 FINANCIALS
9.16.4 STRATEGY
9.16.5 DEVELOPMENTS
9.17 SONY
9.17.1 OVERVIEW
9.17.2 PRODUCTS & SERVICES
9.17.3 FINANCIALS
9.17.4 STRATEGY
9.17.5 DEVELOPMENTS
9.18 TELE SYSTEM ELECTRONICS
9.18.1 OVERVIEW
9.18.2 PRODUCTS $ SERVICES
9.18.3 FINANCIALS
9.18.4 STRATEGY
9.18.5 DEVELOPMENTS
9.19 TOSHIBA
9.19.1 OVERVIEW
9.19.2 PRODUCTS & SERVICES
9.19.3 FINANCIALS
9.19.4 STRATEGY
9.19.5 DEVELOPMENTS
9.20 VIDEOCON
9.20.1 OVERVIEW
9.20.2 PRODUCTS & SERVICES
9.20.3 FINANCIALS
9.20.4 STRATEGY
9.20.5 DEVELOPMENTS
9.21 YAHOO
9.21.1 OVERVIEW
9.21.2 PRODUCTS & SERVICES
9.21.3 FINANCIALS
9.21.4 STRATEGY
9.21.5 DEVELOPMENTS
APPENDIX
SMART TV VS IPTV
U.S. PATENTS
EUROPE PATENTS
JAPAN PATENTS
LIST OF TABLES
TABLE 1 SMART TV MARKET VOLUME, BY GEOGRAPHY, 2009 � 2016 (MILLION UNITS)
TABLE 2 INTERNET EVOLUTION IN TV
TABLE 3 GLOBAL TV MARKET VOLUME, BY TECHNOLOGY, 2009 � 2016 (MILLION UNITS)
TABLE 4 GLOBAL TV SHIPMENT ANALOG VS DIGITAL (%)
TABLE 5 GLOBAL TV SHIPMENT ANALOG VS DIGITAL (MILLION UNITS)
TABLE 6 GLOBAL TV REVENUE, BY VALUE, 2010 � 2016 ($BILLION)
TABLE 7 TV REVENUE MARKET SHARE, BY GEOGRAPHY, 2010 � 2016 (%)
TABLE 8 GLOBAL MARKET, BY VOLUME, 2010 � 2016 (MILLION UNITS)
TABLE 9 GLOBAL MARKET, BY VALUE ($MILLION)
TABLE 10 GLOBAL SMART TV MARKET AVERAGE UNIT PRICE, 2009 � 2016 ($)
TABLE 11 GLOBAL TV SET CONNECTED TO INTERNET, 2010 � 2016 (MILLION UNITS)
TABLE 12 GLOBAL TV SET CONNECTED TO INTERNET Y-O-Y GROWTH (%)
TABLE 13 GLOBAL CONNECTED DEVICES SOLD ANNUALLY, 2010 � 2016 (MILLION UNITS)
TABLE 14 GLOBAL CONNECTED DEVICES SOLD ANNUALLY Y-O-Y GROWTH, 2010 � 2016
TABLE 15 % OF ONLINE POPULATION AS CONTENT CREATORS, 2011
TABLE 16 GLOBAL SHIPMENT FORECAST OF IETV AND IE STB, 2009 � 2016 (MILLION UNITS)
TABLE 17 GLOBAL SHIPMENT FORECAST OF IETV AND IE STB Y-O-Y GROWTH (%)
TABLE 18 STB UNIT SHIPMENT SHARE COMPARISON, 2011 � 2016 (%)
TABLE 19 STB UNIT SHIPMENT SHARE COMPARISON, 2011 � 2016 (MILLION UNITS)
TABLE 20 GLOBAL STB MARKET SHARE, 2011 (%)
TABLE 21 GLOBAL STB MARKET TOP PLAYERS, BY REVENUE ($BILLION)
TABLE 22 INTERNET USERS, BY GEOGRAPHY, 2009 � 2011 (MILLION)
TABLE 23 INTERNET USER SHARE, BY GEOGRAPHY, 2009 � 2011 (%)
TABLE 24 INTERNET USERS, BY GEOGRAPHY, 2009 � 2011 (MILLION)
TABLE 25 GLOBAL TOP 10 COUNTRIES BY INTERNET USERS, 2011 (MILLION)
TABLE 26 CHINA TV MARKET TREND, 2010 � 2016 (MILLION UNITS)
TABLE 27 CHINA TV SHIPMENT Y-O-Y GROWTH, 2010 � 2016
TABLE 28 CHINA SMART TV SHIPMENT Y-O-Y GROWTH
TABLE 29 EUROPE: SMART TV MARKET VOLUME, BY GEOGRAPHY, 2009 � 2016 (MILLION UNITS)
TABLE 30 EUROPE: SMART TV MARKET VALUE, BY GEOGRAPHY, 2009 � 2016 ($BILLION)
TABLE 31 NORTH AMERICA: SMART TV MARKET, BY VOLUME, 2009 � 2016 (MILLION UNITS)
TABLE 32 GLOBAL IPTV SUBSCRIBER FORECAST, 2010 � 2016 (MILLION)
TABLE 33 GLOBAL IPTV SERVICE, BY REVENUE, 2010 � 2016 ($BILLION)
TABLE 34 GLOBAL ONLINE ADVERTISEMENT REVENUE FORECAST, 2010 � 2016 ($BILLION)
TABLE 35 TOP 3 DOMINANT TERRITORIES FOR ONLINE ADVERTISING REVENUE, 2010 � 2016 (%)
TABLE 36 TOP 5 ONLINE AD SELLING COMPANIES IN U.S., 2010 � 2016 (%)
TABLE 37 IETV VS 3D TVS GLOBAL SHIPMENT, 2010 � 2016 (MILLION UNITS)
TABLE 38 GLOBAL GAMING SPEND, 2011 � 2016 ($BILLION)
TABLE 39 GLOBAL GAMING HARDWARE MARKET, 2011 � 2016 ($BILLION)
TABLE 40 GLOBAL GAMING SOFTWARE MARKET, 2011 � 2016 ($BILLION)
TABLE 41 GLOBAL ONLINE GAMING MARKET, 2011 � 2016 ($BILLION)
TABLE 42 GLOBAL FLAT PANEL TV BRAND RANKINGS, BY REVENUE SHARE (%)
TABLE 43 GLOBAL FLAT PANEL TV BRAND SHIPMENT UNITS, 2010
TABLE 44 GLOBAL TV BRANDS IN SMART TV, 2010
TABLE 45 PATENT BY TV TECHNOLOGY TYPE, 2006 � 2011
TABLE 46 PATENT ANALYSIS, BY GEOGRAPHY, 2006 � 2011
TABLE 47 YEAR-WISE PATENT
TABLE 48 COMPANY WISE PATENT ANALYSIS
TABLE 49 TOP SMART TV APPLICATION COMPARISON
TABLE 50 U.S. & EUROPE: CONSUMER SMART TV VIEWING BEHAVIOR, 2011
TABLE 51 SAMSUNG SMART TV APPS CATEGORY
TABLE 52 PANASONIC SMART TV APPS CATEGORY
TABLE 53 NORTH AMERICA VS ROW IPTV SUBSCRIBER, 2010 � 2016 (MILLION)
TABLE 54 NORTH AMERICA VS ROW IPTV SERVICES, BY REVENUE (%)
TABLE 55 EUROPE VS ROW IPTV SUBSCRIBERS, 2010 � 2016 (MILLION)
TABLE 56 EUROPE VS ROW IPTV SERVICES, BY REVENUE, 2010 � 2016 (BILLION)
TABLE 57 EUROPE: TOP 10 COUNTRIES, BY INTERNET USERS-2011 (MILLION)
TABLE 58 APAC & JAPAN VS ROW IPTV SUBSCRIBERS, 2010 � 2016 (MILLION)
TABLE 59 APAC & JAPAN VS ROW IPTV SERVICES, BY REVENUE, 2010 � 2016 (BILLION)
TABLE 60 ASIA: TOP 10 COUNTRIES, BY INTERNET USERS-2011 (MILLION)
TABLE 61 TOTAL ROW SMART TV MARKET, 2009 � 2016 (MILLION UNITS)
TABLE 62 ROW VS OTHERS IPTV SUBSCRIBERS, 2010 � 2016 (MILLION)
TABLE 63 ROW VS OTHERS IPTV SERVICES, BY REVENUE, 2010 � 2016 ($BILLION)
TABLE 64 POLAND: SMART TV MARKET (MILLION UNITS)
TABLE 65 POLAND: MARKET, BY VALUE, 2010 � 2016 ($MILLION)
TABLE 66 JAPAN: SMART TV MARKET, BY VOLUME, 2010 � 2016 (MILLION UNITS)
TABLE 67 JAPAN: MARKET, BY VALUE, 2009 � 2016 ($MILLION)
TABLE 68 KOREA: SMART TV MARKET, 2010 � 2016 (MILLION UNITS)
TABLE 69 KOREA: MARKET, BY VALUE, 2010 � 2016 ($BILLION)
LIST OF FIGURES
FIGURE 1 EVOLUTION OF TELEVISION
FIGURE 2 GLOBAL TV MARKET, 2009 � 2016
FIGURE 3 GLOBAL TV SHIPMENT, ANALOG VS DIGITAL, 2011 � 2016
FIGURE 4 GLOBAL TV SHIPMENT ANALOG VS DIGITAL (MILLION UNITS)
FIGURE 5 GLOBAL TV REVENUE, BY VALUE, 2010 � 2016 ($BILLION)
FIGURE 6 GLOBAL TV REVENUE MARKET SHARE, BY GEOGRAPHY, 2011 � 2016
FIGURE 7 GLOBAL SMART TV MARKET, 2009 � 2016
FIGURE 8 MARKET VOLUME, BY GEOGRAPHY, 2009 � 2016 ($MILLION)
FIGURE 9 FUTURE OF SMART TV
FIGURE 10 GLOBAL TV SETS CONNECTED TO INTERNET, 2010 � 2016 (MILLION UNITS)
FIGURE 11 GLOBAL CONNECTED DEVICES SOLD ANNUALLY, 2010 � 2016 (MILLION UNITS)
FIGURE 12 GRAPHICAL COMPARISON OF GLOBAL CONNECTED DEVICES SOLD ANNUALLY, 2010 � 2016 (MILLION UNITS)
FIGURE 13 REGIONAL MARKET LIFE CYCLE 2011
FIGURE 14 SMART TV VALUE CHAIN
FIGURE 15 REVENUE CYCLE OF SMART TV VALUE CHAIN
FIGURE 16 APPLICATIONS ROAD MAP
FIGURE 17 % OF ONLINE POPULATION AS CONTENT CREATORS, 2011
FIGURE 18 CONTENT ECO SYSTEM AND CONSUMER CONFUSION
FIGURE 19 CONTENT PROVIDER NETWORK
FIGURE 20 GLOBAL SHIPMENT FORECAST OF IETV AND IE STB, 2009 � 2016 (MILLION UNITS)
FIGURE 21 STB UNIT SHIPMENT SHARE COMPARISON, 2011 � 2016 (%)
FIGURE 22 GLOBAL STB MARKET SHARE, 2011
FIGURE 23 GLOBAL STB MARKET TOP PLAYERS, BY REVENUE, 2009 � 2011 ($BILLION)
FIGURE 24 DRIVER IMPACT ANALYSIS
FIGURE 25 SMART TV MARKET FORECAST, 2009 � 2016
FIGURE 26 GLOBAL INTERNET USERS, 2009 � 2011 (MILLION)
FIGURE 27 GLOBAL INTERNET USERS SHARE, 2009 � 2011 (%)
FIGURE 28 GLOBAL INTERNET USERS FORECAST, 2009 � 2016 (MILLION)
FIGURE 29 GLOBAL TOP 10 COUNTRIES BY INTERNET USERS, 2011
FIGURE 30 RESTRAINTS IMPACT ANALYSIS
FIGURE 31 OPPORTUNITY IMPACT ANALYSIS
FIGURE 32 CHINA TV MARKET TREND, 2010 � 2016 (MILLION UNITS)
FIGURE 33 CHINA TV MARKET TREND - LINE GRAPH, 2010 � 2016 (MILLION UNITS)
FIGURE 34 EUROPE: SMART TV MARKET VOLUME, BY GEOGRAPHY, 2009 � 2016 (MILLION UNITS)
FIGURE 35 GLOBAL IPTV SUBSCRIBER FORECAST, 2010 � 2016 (MILLION)
FIGURE 36 GLOBAL IPTV SERVICE, BY REVENUE, 2011 � 2016 ($BILLION)
FIGURE 37 GLOBAL ONLINE ADVERTISEMENT REVENUE FORECAST, 2010 � 2016 ($BILLION)
FIGURE 38 IETV VS 3D TVS GLOBAL SHIPMENT, 2010 � 2016 (MILLION UNITS)
FIGURE 39 GLOBAL GAMING SPEND, 2011 � 2016 ($BILLION)
FIGURE 40 GLOBAL GAMING MARKET, BY VALUE, 2011 � 2016 ($BILLION)
FIGURE 41 GLOBAL SPENDING MARKET SHARE ON GAMING, 2011 & 2016
FIGURE 42 GLOBAL FLAT PANEL TV BRAND SHIPMENTS, 2010
FIGURE 43 PATENT BY TV TECHNOLOGY, 2006 � 2011
FIGURE 44 PATENT ANALYSIS, BY GEOGRAPHY, 2006 � 2011
FIGURE 45 YEAR WISE PATENT
FIGURE 46 COMPANY WISE PATENTS
FIGURE 47 GOOGLE TV & ITS PARTNERS
FIGURE 48 ACCESS OF GOOGLE CONTENT
FIGURE 49 GOOGLE TV ECOSYSTEM
FIGURE 50 U.S. & EUROPE: CONSUMER SMART TV VIEWING BEHAVIOR, 2011
FIGURE 51 SAMSUNG SMART TV APPS CATEGORY
FIGURE 52 PANASONIC SMART TV APPS CATEGORY
FIGURE 53 TOP 10 GLOBAL SMART TV APPLICATIONS
FIGURE 54 GLOBAL TV MARKET, BY TECHNOLOGY
FIGURE 55 NORTH AMERICA: SMART TV MARKET BY VOLUME, 2009 � 2016 (MILLION UNITS)
FIGURE 56 NORTH AMERICA VS ROW IPTV SUBSCRIBER, 2011 & 2016
FIGURE 57 NORTH AMERICA VS ROW IPTV SERVICES, BY REVENUE, 2011 � 2016
FIGURE 58 EUROPE: SMART TV MARKET, BY VOLUME, 2009 � 2016 (MILLION UNITS)
FIGURE 59 EUROPE VS ROW IPTV SUBSCRIBER, 2011 � 2016
FIGURE 60 EUROPE VS ROW IPTV SERVICES, BY REVENUE, 2011 & 2016
FIGURE 61 EUROPE: TOP 10 COUNTRIES, BY INTERNET USERS-2011 (MILLION)
FIGURE 62 APAC: SMART TV MARKET, 2009 � 2016 (MILLION UNITS)
FIGURE 63 APAC & JAPAN VS ROW IPTV SUBSCRIBERS, 2011 � 2016
FIGURE 64 APAC & JAPAN VS ROW IPTV SERVICES, BY REVENUE, 2011 & 2016
FIGURE 65 ASIA:TOP 10 COUNTRIES, BY INTERNET USERS-2011 (MILLION)
FIGURE 66 TOTAL ROW SMART TV MARKET, 2009 � 2016 (MILLION UNITS)
FIGURE 67 ROW VS OTHERS IPTV SUBSCRIBER, 2011 � 2016
FIGURE 68 ROW VS OTHERS IPTV SERVICES, BY REVENUE (%), 2011 & 2016
FIGURE 69 JAPAN: SMART TV MARKET, BY VOLUME, 2009 � 2016 (MILLION UNITS)
FIGURE 70 KEY GROWTH STRATEGY
FIGURE 71 YEAR WISE KEY GROWTH STRATEGIES


Growth opportunities and latent adjacency in Global Smart TV Market