[176 Pages Report] The global software-Defined Anything (SDx) market size is expected to grow from USD 51.7 billion in 2019 to USD 160.8 billion by 2024, at a Compound Annual Growth Rate (CAGR) of 25.5% during the forecast period. The major factor expected to drive the growth of the Software-Defined Anything market is the increasing demand for virtualization and cloud in data centers, which is propelling the adoption of SDx solutions. Hence, enterprises owing to their ability, are providing unified management of all data center components, such as networking, server, storage, security, and other resources. Large-scale IT infrastructure users, such as cloud service providers, telecommunication operators, and enterprises are increasingly using SDx solutions.
By type, the SDDC segment is expected to account for the highest market share during the forecast period. Organizations are widely adopting SDDC solutions as they enable them to capitalize the agility, elasticity, and scalability of cloud computing. Businesses are leveraging the chief advantages of SDDC that enable them to automate all functions with the help of intelligent software, speeding IT resource provisioning, and enhancement of operational management.
By end user, the enterprise segment is expected to hold a larger market size during the forecast period. The wide adoption of SDx solutions among enterprises can be attributed to the exponentially increasing big data generated by enterprises. This is leading them to go for the multi-fold benefits achieved from improved network efficiency through centralized management, enhanced IT agility, network customization through fast and reliable application services, to manage the huge data and applications securely.
The global SDx market by region covers 4 major geographic regions, namely North America, Asia Pacific (APAC), Europe, and Rest of the World (RoW). North America is expected to grow at a CAGR of 24.0% during the forecast period, due to the rapid adoption of advanced technologies and infrastructure helping organizations in the region virtualize their IT infrastructure and facilitate advanced network management.
Key and emerging SDx market players include Cisco (US), Dell EMC (US), HPE (US), IBM (US),VMware (US), Huawei (China), Juniper Networks (US), Microsoft (US), Nokia (Finland), Oracle (US), Aryaka Networks (US), Big Switch Networks (US), Citrix (US), Extreme Networks (US), Infovista (France), NEC (Japan), Nutanix (US), Pluribus Networks (US), Red Hat (US), Silver Peak Systems (US), SUSE (Germany), Adaptiv Networks (US), Arista Networks (US), Bigleaf Networks (US), CloudGenix (US), Cumulus Networks (US), DataCore Software (US), DataDirect Networks (US), FatPipe Networks (US), flexiWAN (Israel), Fortinet (US), Fujitsu (Japan), HiveIO (US), Lavelle Networks (India), Lenovo (Hong Kong), Martello Technologies (Canada), Maxta (US), Mushroom Networks (US), NetApp (US), Peplink (US), Pica8 (US), Pivot3 (US), Riverbed (US),Scale Computing (US), StarWind Software (US), StorMagic (UK), Stratoscale (Israel), Veeam Software (Switzerland), Versa Networks (US), and Zenlayer (US).
Report Metrics |
Details |
Market size available for years |
2017–2024 |
Base year considered |
2018 |
Forecast period |
2019–2024 |
Forecast units |
Billion/Million (USD) |
Segments covered |
Type (SDN, SD-WAN, SDDC), End User (Service Providers and Enterprises), and Region |
Geographies covered |
North America, Europe, APAC, and Rest of World |
Companies covered |
Cisco (US), Dell EMC (US), HPE (US), IBM (US),VMware (US), Huawei (China), Juniper Networks (US), Microsoft (US), Nokia (Finland), Oracle (US), Aryaka Networks (US), Big Switch Networks (US), Citrix (US), Extreme Networks (US), Infovista (France), NEC (Japan), Nutanix (US), Pluribus Networks (US), Red Hat (US), Silver Peak Systems (US), SUSE (Germany), Adaptiv Networks (US), Arista Networks (US), Bigleaf Networks (US), CloudGenix (US), Cumulus Networks (US), DataCore Software (US), DataDirect Networks (US), FatPipe Networks (US), flexiWAN (Israel), Fortinet (US), Fujitsu (Japan), HiveIO (US), Lavelle Networks (India), Lenovo (Hong Kong), Martello Technologies (Canada), Maxta (US), Mushroom Networks (US), NetApp (US), Peplink (US), Pica8 (US), Pivot3 (US), Riverbed (US),Scale Computing (US), StarWind Software (US), StorMagic (UK), Stratoscale (Israel), Veeam Software (Switzerland), Versa Networks (US), and Zenlayer (US) |
The research report categorizes the Software-Defined Anything market to forecast the revenues and analyze trends in each of the following subsegments:
What is Software Defined Anything (SDx) market?
The SDx market refers to an architectural framework wherein all components of enterprise’s and service provider’s network and data center, such as compute, network, and storage, are virtualized to orchestrate network management, improve network agility, and lower operational cost. In a nutshell, the control plane (software) is abstracted from the data plane (hardware) that enables network administrators to manage the entire enterprise as well as data center infrastructure from a single software console.
What is forecast of SDX market in the next five years?
The global SDx market size is expected to grow from USD 51.7 billion in 2019 to USD 160.8 billion by 2024, at a Compound Annual Growth Rate (CAGR) of 25.5% during the forecast period.
Which region have the highest market share in SDx market?
North America and Europe region have the highest market share in the SDx market, where these two regions together contribute approximately 70-75% to the global SDx market in the year 2019.
What are the major factors that are anticipated to drive the SDx market?
Over the years, the SDx market has witnessed growth due to the rising need for mobility and increasing complexity of networks and rising amount of data causing the organizations to work for achieving flexibility, scalability, compliance, and cost efficiency. Along with this, there is a growing demand for effective network management methodologies. .
To speak to our analyst for a discussion on the above findings, click Speak to Analyst
Table of Contents
1 Introduction (Page No. - 20)
1.1 Objectives of the Study
1.2 Market Definition
1.3 Market Scope
1.3.1 Market Segmentation
1.4 Years Considered for the Study
1.5 Currency Considered
1.6 Stakeholders
2 Research Methodology (Page No. - 23)
2.1 Research Data
2.1.1 Breakup of Primary Profiles
2.1.2 Key Industry Insights
2.2 Market Breakup and Data Triangulation
2.3 Market Size Estimation
2.3.1 Top-Down Approach
2.3.2 Bottom-Up Approach
2.4 Market Forecast
2.5 Assumptions for the Study
2.6 Limitations of the Study
3 Executive Summary (Page No. - 32)
4 Premium Insights (Page No. - 36)
4.1 Attractive Market Opportunities in the Global Software-Defined Anything Market
4.2 Market By End User
4.3 Market in North America, By End User and Country
4.4 Market in Europe, By End User and Country
4.5 Market in Asia Pacific, By End User and Country
5 Market Overview and Industry Trends (Page No. - 39)
5.1 Introduction
5.2 Market Dynamics
5.2.1 Drivers
5.2.1.1 Increase in Data Volume
5.2.1.2 Significant Reduction in CAPEX and OPEX
5.2.1.3 Need for Effective Network Management
5.2.2 Restraints
5.2.2.1 Concerns Over Data Privacy and Security
5.2.2.2 Inefficient Resource Provisioning and Lack of Skilled Workforce
5.2.3 Opportunities
5.2.3.1 Increasing Demand for Hybrid Clouds
5.2.3.2 Growing Adoption of IoT
5.2.3.3 Regulations Concerning Data Localization
5.2.4 Challenges
5.2.4.1 Data Management for Enterprises
5.2.4.2 Difficulties in Transitioning From Traditional to Software Defined
5.3 Software-Defined Anything Architectural Ecosystem
5.3.1 Edge Routers
5.3.2 Switches
5.3.3 Workstations
5.3.4 Controllers
5.3.5 Firewalls
5.4 Software-Defined Anything Application Areas
5.4.1 Cloud Approach
5.4.2 Remote Connectivity
5.4.3 Multi-Tenant Platform Creation
5.4.4 Multibranch Connectivity
5.4.5 Security
5.4.6 Network Visibility
5.5 Value Chain Analysis
5.5.1 Software-Defined Data Center Networking
5.5.2 Software-Defined Storage
5.5.3 Software-Defined Compute
5.5.4 Network Virtualization Solution Providers
5.5.5 Hardware Equipment Providers
5.5.6 Resellers
5.5.7 Managed Service Providers
5.5.8 End Users
5.6 Industry Standards
5.6.1 Distributed Management Task Force Standards
5.6.2 Cloud Infrastructure Management Interface
5.6.3 Open Virtualization Format
5.6.4 Organization for the Advancement of Structured Information Standards
5.6.5 Storage Networking Industry Association—Cloud Data Management Interface
5.6.6 European Telecommunications Standards Institute/Industry Specification Group—Network Function Virtualization
6 Software-Defined Anything Market By Type (Page No. - 49)
6.1 Introduction
6.2 Software-Defined Networking
6.2.1 Increasing Demand for Cost-Effective Solutions for Operating Network Infrastructure and Business Functions to Drive the Software-Defined Networking Industry
6.3 Software-Defined Wide Area Network
6.3.1 Delivering Robust Branch Connectivity Over Traditional Wan Architecture By Reducing Overall CAPEX and Improving Network Capacity Effectively to Drive the Software-Defined Wide Area Network Industry
6.4 Software-Defined Data Center
6.4.1 Software-Defined Computing
6.4.1.1 Software-Defined Computing Tools to Facilitate Efficient and Dynamic Allocation of Workloads Across the Servers in the System
6.4.2 Software-Defined Storage
6.4.2.1 Liberty to Choose Industry-Standard Servers to Drive the SDS Segment Growth
6.4.3 Software-Defined Data Center Networking
6.4.3.1 Sddcn to Provide Centralized Control of the Network Traffic Without Configuring the Settings of Individual Switches
7 SDx Market By End User (Page No. - 61)
7.1 Introduction
7.2 Service Providers
7.2.1 Telecom Service Providers
7.2.1.1 Transition to 5G to Drive the SDx Market in the Telecom Service Providers Segment
7.2.2 Cloud Service Providers
7.2.2.1 Reduced Network Infrastructure Cost and Enhanced Service Assurance to Bolster the Adoption of the SDx Technology in the Cloud Service Providers Segment
7.3 Enterprises
7.3.1 Banking, Financial Services and Insurance
7.3.1.1 Flexibility and Added Speed in Application Delivery to Drive the SDx Technology in the BFSI Sector
7.3.2 Manufacturing
7.3.2.1 Centralized and Pre-Defined Policy Management to Drive the Adoption of SDx in Manufacturing
7.3.3 Retail
7.3.3.1 Evolving Nature of the Sector to Provide Next-Gen In-Store Technologies for Enforcing Retailers to Implement the SDx Technology
7.3.4 Healthcare
7.3.4.1 Need for In-Depth Network Visibility and Compliance to Bolster the Adoption of SDX in the Healthcare Segment
7.3.5 Government
7.3.5.1 Need for Overcoming Siloed It Infrastructure and Streamlining Data Economy to Motivate Government Stakeholders for Adopting the SDx Technology
7.3.6 Education
7.3.6.1 Growing Adoption of Digital Campuses With Cloud and IoT to Drive the Adoption of SDx in the Education Sector
7.3.7 Others
8 Software-Defined Anything Market By Region (Page No. - 82)
8.1 Introduction
8.2 North America
8.2.1 United States
8.2.1.1 Proliferation of Software-Defined Technologies Within Enterprises to Drive the Market Growth in the US
8.2.2 Canada
8.2.2.1 Government Initiatives Toward Digital Transformation to Fuel the Market Growth in Canada
8.3 Europe
8.3.1 United Kingdom
8.3.1.1 Rapid Digitalization to Drive the Growth of the SDx Market in the UK
8.3.2 Germany
8.3.2.1 Increase in the Number of Automotive Original Equipment Manufacturers to Boost the SDx Market in Germany
8.3.3 Rest of Europe
8.4 Asia Pacific
8.4.1 China
8.4.1.1 Demand for Hyperconverged Data Centers to Boost the SDx Market in China
8.4.2 Japan
8.4.2.1 Emergence of 5G and Edge Computing to Drive the SDx Market in Japan
8.4.3 Rest of Asia Pacific
8.5 Rest of the World
8.5.1 Middle East and Africa
8.5.2 Latin America
9 Competitive Landscape (Page No. - 100)
9.1 Overview
9.2 Competitive Scenario
9.2.1 Partnerships
9.2.2 New Product Launches
9.2.3 Acquisitions
9.2.4 Business Expansions
10 Company Profiles (Page No. - 105)
(Business Overview, Solutions. Products & Services, Key Insights, Recent Developments, SWOT Analysis, MnM View)*
10.1 Cisco
10.2 Dell EMC
10.3 HPE
10.4 IBM
10.5 VMware
10.6 Huawei
10.7 Juniper Networks
10.8 Microsoft
10.9 Nokia
10.10 Oracle
10.11 Aryaka
10.12 Big Switch Networks
10.13 Citrix
10.14 Extreme Networks
10.15 Infovista
10.16 NEC
10.17 Nutanix
10.18 Pluribus Networks
10.19 Red Hat
10.20 Silver Peak
10.21 Suse
10.22 Adaptiv Networks
10.23 Arista Networks
10.24 Bigleaf
10.25 Cloudgenix
10.26 Cumulus Networks
10.27 Datacore Software
10.28 Datadirect Networks
10.29 Fatpipe
10.30 Flexiwan
10.31 Fortinet
10.32 Fujitsu
10.33 Hiveio
10.34 Lavelle Networks
10.35 Lenovo
10.36 Martello Technologies
10.37 Maxta
10.38 Mushroom Networks
10.39 Netapp
10.40 Peplink
10.41 Pica8
10.42 Pivot3
10.43 Riverbed
10.44 Scale Computing
10.45 Starwind Software
10.46 Stormagic
10.47 Stratoscale
10.48 Veeam Software
10.49 Versa Networks
10.50 Zenlayer
*Details on Business Overview, Solutions, Products & Services, Key Insights, Recent Developments, SWOT Analysis, MnM View Might Not Be Captured in Case of Unlisted Companies.
11 Appendix (Page No. - 171)
11.1 Discussion Guide
11.2 Knowledge Store: Marketsandmarkets’ Subscription Portal
11.3 Available Customizations
11.4 Related Reports
11.5 Author Details
List of Tables (65 Tables)
Table 1 United States Dollar Exchange Rate, 2016–2018
Table 2 Factor Analysis
Table 3 Software-Defined Anything Market Size, By Type, 2017–2024 (USD Billion)
Table 4 Software-Defined Networking: Market Size By Region, 2017–2024 (USD Billion)
Table 5 Software-Defined Wide Area Network: Market Size By Region, 2017–2024 (USD Million)
Table 6 Software-Defined Data Center: Market Size By Type, 2017–2024 (USD Billion)
Table 7 Software-Defined Computing Market Size, By Region, 2017–2024 (USD Billion)
Table 8 Software-Defined Storage Market Size, By Region, 2017–2024 (USD Billion)
Table 9 Software-Defined Data Center Networking Market Size, By Region, 2017–2024 (USD Billion)
Table 10 Software-Defined Anything Market Size, By End User, 2017–2024 (USD Billion)
Table 11 Service Providers: Market Size By Region, 2017–2024 (USD Billion)
Table 12 Software-Defined Anything Market Size, By Enterprise, 2017–2024 (USD Billion)
Table 13 Enterprises: Market Size By Region, 2017–2024 (USD Million)
Table 14 Banking, Financial Services and Insurance Market Size, By Region, 2017–2024 (USD Billion)
Table 15 Use Case: Policy-Based Automation for Wan Connectivity to Help Unify the Management and Provisioning of Virtual Networks
Table 16 Use Case: Empowered Multi-Cloud Service Delivery to Help Reduce Network Complexities
Table 17 Use Case: Accelerated Service Delivery With an Increase in Network Agility
Table 18 Use Case: Improved Resource Allocation With Enhanced Network Security
Table 19 Manufacturing Market Size, By Region, 2017–2024 (USD Billion)
Table 20 Use Case: High Availability of Storage Services Improving Storage Infrastructure
Table 21 Use Case: Increase in Network Performance
Table 22 Use Case: Increase in the Quality of Service With Enhanced Productivity
Table 23 Retail Market Size, By Region, 2017–2024 (USD Billion)
Table 24 Use Case: Simplified and Consolidated Key Business Processes
Table 25 Use Case: Ease in Re-Routing Network Traffic
Table 26 Use Case: Improved Network Visibility Resulting in Greater Application Performance
Table 27 Healthcare Market Size, By Region, 2017–2024 (USD Billion)
Table 28 Use Case: Improved Network Latency and Ease in Availability of Resources
Table 29 Use Case: Accelerated Time to Value Through Automation and Centralized Management
Table 30 Use Case: Improved Network Visibility Enabling Fast Problem Identification and Resolution
Table 31 Use Case: Improved Stability and Reliability Over the Existing Virtual Network
Table 32 Government Market Size, By Region, 2017–2024 (USD Billion)
Table 33 Use Case: Effective Management of Network Resource to Help Government Organizations Lower Operational Costs
Table 34 Use Case: Reduced Cost of Mpls Services
Table 35 Use Case: Reduced Network Complexities to Empower Network Infrastructure
Table 36 Education Market Size, By Region, 2017–2024 (USD Billion)
Table 37 Use Case: Ease in Management of File Storage Systems
Table 38 Use Case: End-To-End Network Protection at A Lower Cost
Table 39 Use Case: Great Reduction in the Load of A Network Management Operation
Table 40 Others Market Size, By Region, 2017–2024 (USD Billion)
Table 41 Software-Defined Anything Market Size, By Region, 2017–2024 (USD Billion)
Table 42 North America: Software-Defined Anything Market Size, By Type, 2017–2024 (USD Billion)
Table 43 North America: SDx Market Size By Sddc, 2017–2024 (USD Billion)
Table 44 North America: Market Size By End User, 2017–2024 (USD Billion)
Table 45 North America: Market Size By Enterprise, 2017–2024 (USD Billion)
Table 46 North America: Market Size By Country, 2017–2024 (USD Billion)
Table 47 Europe: Software-Defined Anything Market Size, By Type, 2017–2024 (USD Billion)
Table 48 Europe: SDx Market Size By Sddc, 2017–2024 (USD Billion)
Table 49 Europe: Market Size By End User, 2017–2024 (USD Billion)
Table 50 Europe: Market Size By Enterprise, 2017–2024 (USD Billion)
Table 51 Europe: Market Size By Country, 2017–2024 (USD Million)
Table 52 Asia Pacific: Software-Defined Anything Market Size, By Type, 2017–2024 (USD Billion)
Table 53 Asia Pacific: SDx Market Size By Sddc, 2017–2024 (USD Billion)
Table 54 Asia Pacific: Market Size By End User, 2017–2024 (USD Billion)
Table 55 Asia Pacific: Market Size By Enterprise, 2017–2024 (USD Billion)
Table 56 Asia Pacific: Market Size By Country, 2017–2024 (USD Billion)
Table 57 Rest of the World: Software-Defined Anything Market Size, By Type, 2017–2024 (USD Billion)
Table 58 Rest of the World: SDx Market Size By Sddc, 2017–2024 (USD Billion)
Table 59 Rest of the World: Market Size By End User, 2017–2024 (USD Billion)
Table 60 Rest of the World: Market Size By Enterprise, 2017–2024 (USD Billion)
Table 61 Rest of the World: Market Size By Country, 2017–2024 (USD Billion)
Table 62 Partnerships, 2019
Table 63 New Product Launches, 2019
Table 64 Acquisitions, 2018–2019
Table 65 Business Expansions, 2018–2019
List of Figures (48 Figures)
Figure 1 Software-Defined Anything Market: Research Design
Figure 2 Research Methodology
Figure 3 SDx Market Top-Down and Bottom-Up Approaches
Figure 4 Market Holistic View
Figure 5 Market Growth Trend
Figure 6 Asia Pacific to Grow at the Highest Growth Rate During the Forecast Period
Figure 7 Growing Uptake of Digital Transformation Technologies to Drive the SDx Market Growth During the Forecast Period
Figure 8 Enterprises Segment to Account for A Higher Market Share in 2019
Figure 9 Enterprises Segment and United States to Dominate the North America Software-Defined Anything Market in North America in 2019
Figure 10 Enterprises Segment and United Kingdom to Dominate the Europe Software-Defined Anything Market in 2019
Figure 11 Enterprises Segment and China to Dominate the Asia Pacific Software-Defined Anything Market in 2019
Figure 12 Drivers, Restraints, Opportunities, and Challenges
Figure 13 Software-Defined Anything Architectural Ecosystem
Figure 14 Software-Defined Wide Area Network Segment to Grow at the Highest CAGR During the Forecast Period
Figure 15 Traditional Data Center vs Software-Defined Data Center: Architecture
Figure 16 Software-Defined Data Center: Architecture
Figure 17 Software-Defined Data Center Networking Segment to Grow at the Highest CAGR During the Forecast Period
Figure 18 Software-Defined Computing: Architecture
Figure 19 Software-Defined Storage: Architecture
Figure 20 Software-Defined Data Center Networking: Architecture
Figure 21 Service Providers Segment to Grow at A Higher CAGR During the Forecast Period
Figure 22 Banking, Financial Services and Insurance Segment to Dominate the Market During the Forecast Period
Figure 23 North America to Account for the Largest Market Size During the Forecast Period
Figure 24 Asia Pacific to Grow at the Highest CAGR During the Forecast Period
Figure 25 North America: SDx Market Snapshot
Figure 26 Asia Pacific: Market Snapshot
Figure 27 Key Developments By the Leading Players in the Software-Defined Anything Market, 2016–2019
Figure 28 Market Evaluation Framework, 2017–2019
Figure 29 Cisco: Company Snapshot
Figure 30 Cisco: SWOT Analysis
Figure 31 Dell EMC: Company Snapshot
Figure 32 Dell EMC: SWOT Analysis
Figure 33 HPE: Company Snapshot
Figure 34 HPE: SWOT Analysis
Figure 35 IBM: Company Snapshot
Figure 36 IBM: SWOT Analysis
Figure 37 VMware: Company Snapshot
Figure 38 VMware: SWOT Analysis
Figure 39 Huawei: Company Snapshot
Figure 40 Juniper Networks: Company Snapshot
Figure 41 Microsoft: Company Snapshot
Figure 42 Nokia: Company Snapshot
Figure 43 Oracle: Company Snapshot
Figure 44 Citrix: Company Snapshot
Figure 45 Extreme Networks: Company Snapshot
Figure 46 NEC: Company Snapshot
Figure 47 Nutanix: Company Snapshot
Figure 48 Red Hat: Company Snapshot
The study involved 4 major activities to estimate the current market size for the Software-Defined Anything (SDx) market. Exhaustive secondary research was done to collect information on the market, the peer market, and the parent market. The next step was to validate these findings, assumptions, and sizing with the industry experts across the value chain through primary research. Both top-down and bottom-up approaches were employed to estimate the complete market size. Thereafter, the market breakup and data triangulation procedures were used to estimate the market size of the segments and subsegments of the Software-Defined Anything market.
In the secondary research process, various secondary sources, such as D&B Hoovers, Bloomberg BusinessWeek, and Factiva, have been referred to identify and collect information for this study. These secondary sources included annual reports; press releases and investor presentations of companies; whitepapers, certified publications, and articles by recognized authors; gold standard and silver standard websites; crypto asset management technology Research and Development (R&D) organizations; regulatory bodies; and databases.
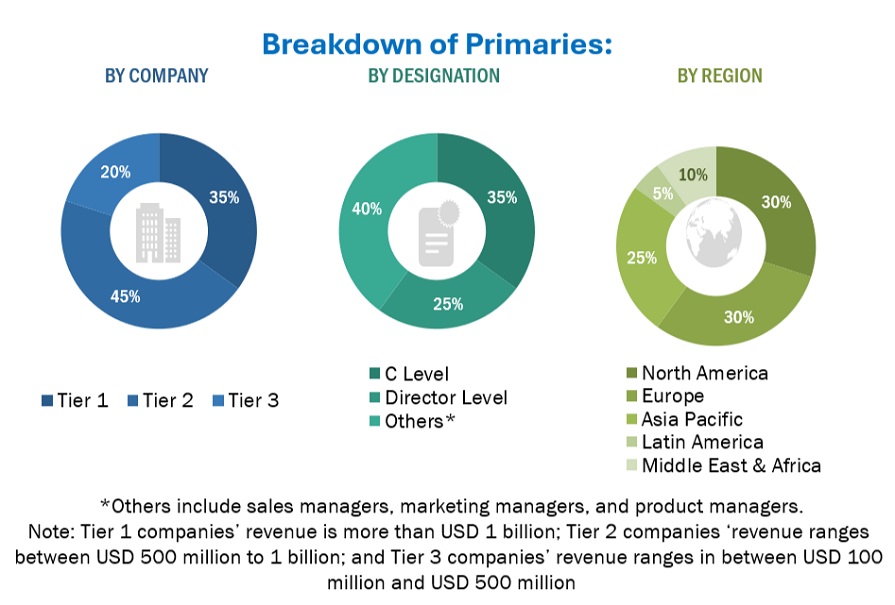
Various primary sources from both the supply and demand sides of the Software-Defined Anything market ecosystem were interviewed to obtain qualitative and quantitative information for the study. The primary sources from the supply side included industry experts, such as Chief Executive Officers (CEOs), Vice Presidents (VPs), marketing directors, technology and innovation directors, and related key executives from various vendors who provide SDx solutions and services operating in the targeted regions. All possible parameters that affect the market covered in this research study have been accounted for, viewed in extensive detail, verified through primary research, and analyzed to get the final quantitative and qualitative data. The following is the breakup of the primary respondents’ profiles:
To know about the assumptions considered for the study, download the pdf brochure
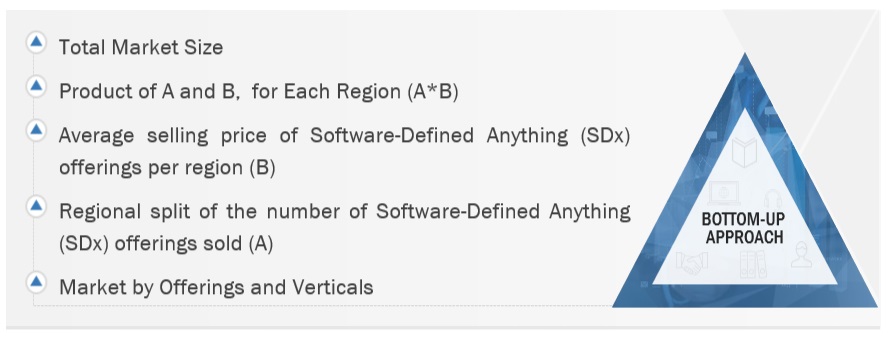
For making market estimates and forecasting the Software-Defined Anything market and the other dependent submarkets, the top-down and bottom-up approaches were used. The bottom-up procedure was used to arrive at the overall market size of the global SDx market using the revenues and offerings of the key companies in the market. The research methodology used to estimate the market size includes the following:
With data triangulation and validation through primary interviews, the exact value of the overall parent market size was determined and confirmed using this study. The overall market size was then used in the top-down procedure to estimate the size of other individual markets via percentage splits of the market segmentation.
With the given market data, MarketsandMarkets offers customizations as per the company’s specific requirements. The following customization options are available for the report:
Benchmarking the rapid strategy shifts of the Top 100 companies in the Software-Defined Anything (SDx) Market
Request For Special Pricing
Growth opportunities and latent adjacency in Software-Defined Anything (SDx) Market