Software Defined Perimeter Market by Component (Solutions and Services), Connectivity, Deployment Mode, Organization Size, User Type (Government & Defense, IT & Telecom, and Retail & eCommerce), and Region - Global Forecast to 2024


Software Defined Perimeter Market
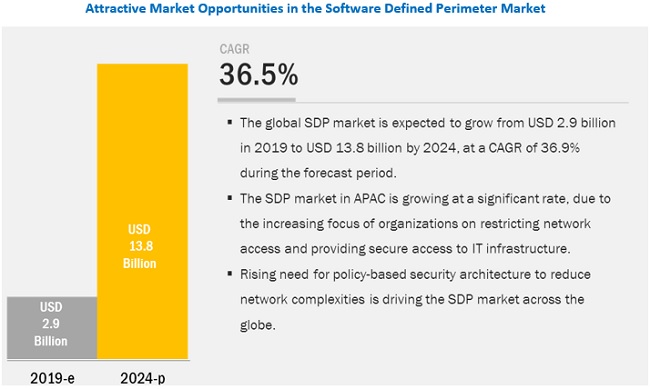
The global Software Defined Perimeter Market size was valued at USD 2.9 billion in 2019 and is anticipated to grow at CAGR of 36.5% between 2019 and 2024, attributed to the growing revenue of $13.8 billion by 2024. The major growth drivers of the software defined perimeter industry include the rising need for policy-based security architecture to reduce network complexities and the increasing demand for cloud-based applications.
Software Defined Perimeter Market Dynamics
Among solutions, the security compliance and policy management segment to grow at the highest CAGR during the forecast period
The software defined perimeter market is segmented on the basis of solutions such as access control, risk analytics and visualization, security compliance and policy management, performance management and reporting and others (control automation and orchestration, data loss prevention (DLP), intrusion detection system (IDS), and intrusion prevention system (IDS)). The security compliance and policy management segment is the fastest-growing segment in the software defined perimeter market. SDP solutions deliver a centralized security compliance and policy management solution by automating the entire security compliance and policy management process deployed via software, appliances, and hosted Software as a Service (SaaS) or virtual machines. It saves time and money, and enhances productivity by ensuring that businesses focus on their major tasks.
By deployment mode, the cloud segment to grow at a rapid pace during the forecast period
On the basis of deployment mode, the software defined perimeter market is segmented into cloud and on-premises. Cloud systems make better use of technology and enable easy sharing of infrastructure among multiple users and offices, offering a greater level of scalability and reducing the ongoing cost of implementation and continual development. These benefits are expected to drive the adoption of cloud SDP solutions across all user types. Owing to more and more applications being deployed over the cloud, there is a shift from traditional on-premises security solutions to cloud-based security solutions across large enterprises and SMEs.
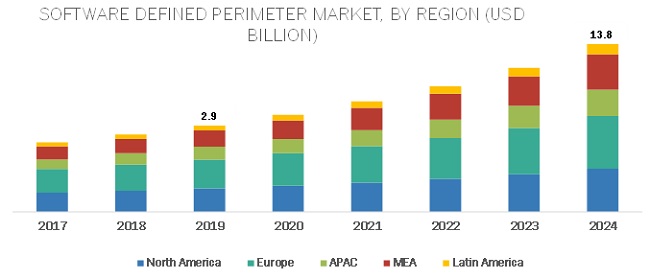
North America to hold the largest market size during the forecast period
North America is dominating the software defined perimeter market, as North America is considered to be the most advanced region with regards to cutting edge security technology adoption and infrastructure. Governments in this region are taking initiatives to build a secure IT environment and protect sensitive data. In addition, the region is highly regulated in terms of compliance management. As data centers become increasingly software-driven, businesses need flexible and agile security solutions.
Software Defined Perimeter Companies
Major vendors in the global Software Defined Perimeter Market include Check Point (Israel), Cisco (US), Akamai (US), Palo Alto Networks (US), Symantec (US), Okta (US), Proofpoint (US), Verizon (US), Fortinet (US), Intel (US), Perimeter 81 (Israel), Safe-T (Israel), Pulse Secure (US), CloudPassage (US), Illumio (US), DH2i (US), Certes Networks (US), TrustedPassage (US), Cato Networks (US), and AppGate (US). These vendors have adopted various organic and inorganic growth strategies, such as new product launches, partnerships and collaborations, and mergers and acquisitions, to expand their presence in the global software defined perimeter market.
Check Point (US) is one of the leading providers of internet security solutions across the globe, was founded in 1993 and headquartered in Tel Aviv, Israel. The company pioneered the industry with FireWall-1 and its patented inspection technology and continues to develop innovations based on the software blade architecture, providing customers with flexible and simple solutions that can be fully customized to meet the exact security needs of an organization. In the SDP market, the company offers software-defined protection that secures organizations with its three interconnected layers: the management layer, the control layer, and the enforcement layer. The architecture delivers real-time visualization of security incidents, enhances control of policy enforcement, and prevents attack proliferation. The software-defined protection solution helps organizations mitigate cyber threats and maintain a secure environment. Check Point’s products and services are sold to enterprises, service providers, SMEs, and consumers. The company secures more than 1,00,000 businesses and millions of users globally.
Scope of the Report
|
Report Metrics |
Details |
|
Market size value in 2019 |
USD 2.9 billion |
|
Revenue forecast for 2024 |
USD 13.8 billion |
|
Growth Rate |
36.5% CAGR |
|
Forecast units |
Billion (USD) |
|
Key Market Drivers |
|
|
Key Market Opportunities |
|
|
Segments covered |
Component, Connectivity, Deployment Mode, Organization Size, User Type and Region |
|
Geographies covered |
North America, Europe, APAC, Latin America, and MEA |
|
List of Companies in Software Defined Perimeter |
Check Point (Israel), Cisco (US), Akamai (US), Palo Alto Networks (US), Symantec (US), Okta (US), Proofpoint (US), Verizon (US), Fortinet (US), Intel (US), Perimeter 81 (Israel), Safe-T (Israel), Pulse Secure (US), CloudPassage (US), Illumio (US), DH2i (US), Certes Networks (US), TrustedPassage (US), Cato Networks (US), and AppGate (US) |
This research report categorizes the software defined perimeter market based on component, connectivity, deployment mode, organization size, and region.
By Component:
-
Solutions
- Access Control
- Risk Analytics and Visualization
- Security Compliance and Policy Management
- Performance Management and Reporting
- Others (Control Automation and Orchestration, Data Loss Prevention (DLP), Intrusion Detection System (IDS) and Intrusion Prevention System (IPS))
-
Services
- Consulting and Implementation
- Training, Support, and Maintenance
By Connectivity:
- Controller
- Gateway
- End Point
By Deployment Mode:
- Cloud
- On-premises
By Organization Size:
- Small and Medium-sized Enterprises (SMEs)
- Large Enterprises
By region:
-
North America
- US
- Canada
-
Europe
- UK
- Germany
- France
- Rest of Europe
-
Asia Pacific (APAC)
- China
- India
- Rest of APAC
-
Middle East and Africa (MEA)
- Israel
- South Africa
- Rest of MEA
-
Latin America
- Brazil
- Rest of Latin America
Recent developments
- In December 2019, Palo Alto Networks acquired Aporeto, a machine identity-based microsegmentation company. This acquisition would strengthen the Palo Alto Networks Cloud Native Security Platform delivered by Prisma Cloud.
- In May 2019, Palo Alto Networks announced the launch of a cloud security suite, Prisma. Prisma was designed to help the company’s customers lead a more secure digital life.
- In January 2019, Check Point acquired ForceNock, a Web Application and Application Program Interface (API) Protection start-up, to integrate ForceNock’s technology into its Infinity total protection architecture.
- In August 2018, Cisco acquired Duo Security to address a new security perimeter. The acquisition strengthened Cisco’s position in the software defined perimeter market and would accelerate Cisco’s intent-based networking strategy and expanding endpoint visibility coverage.
Critical questions the report answers
- What are the current trends driving the software defined perimeter market?
- Which are the user types where most software defined perimeter companies offering SaaS-based solutions and services? Where will all these developments take the industry in the mid- to long-term?
- Who are the top vendors in the software defined perimeter market, and what is their competitive analysis?
- What are the drivers and challenges faced by vendors of the software defined perimeter market?
Frequently Asked Questions (FAQ):
What is the projected market value of the global software defined perimeter market?
What is the estimated growth rate (CAGR) of the global software defined perimeter market for the next five years?
What are the major revenue pockets in the software defined perimeter market currently?
Who are the key vendors in the software defined perimeter market?
To speak to our analyst for a discussion on the above findings, click Speak to Analyst
 Exclusive indicates content/data unique to MarketsandMarkets and not available with any competitors.
Table of Contents
1 Introduction (Page No. - 17)
1.1 Objectives of the Study
1.2 Market Definition
1.2.1 Inclusions and Exclusions
1.3 Market Scope
1.3.1 Market Segmentation
1.3.2 Regions Covered
1.4 Years Considered for the Study
1.5 Currency Considered
1.6 Stakeholders
2 Research Methodology (Page No. - 21)
2.1 Research Data
2.1.1 Secondary Data
2.1.2 Primary Data
2.1.2.1 Breakup of Primary Profiles
2.2 Market Breakup and Data Triangulation
2.2.1.1 Key Industry Insights
2.3 Market Size Estimation
2.3.1 Top-Down Approach
2.3.2 Bottom-Up Approach
2.4 Market Forecast
2.5 Assumptions for the Study
2.6 Limitations of the Study
3 Executive Summary (Page No. - 32)
4 Premium Insights (Page No. - 35)
4.1 Attractive Market Opportunities in the Software Defined Perimeter Market
4.2 North America Market, By User Type and Country
4.3 Software Defined Perimeter Market: Major Countries
5 Market Overview and Industry Trends (Page No. - 38)
5.1 Introduction
5.2 Market Dynamics
5.2.1 Drivers
5.2.1.1 Rising Need for Policy-Based Security Architecture to Reduce Network Complexities
5.2.1.2 Increasing Adoption of Cloud-Based Applications
5.2.1.3 Growing Need for Regulations and Compliances to Enhance Network Security
5.2.2 Restraints
5.2.2.1 Lack of Awareness Concerning Security in a Virtualization Environment
5.2.3 Opportunities
5.2.3.1 Increasing Number of Connected Devices Due to IoT and Byod Trends
5.2.4 Challenges
5.2.4.1 Growing Demand for Open-Source Security Applications
5.2.4.2 Lack of Industry Standards
5.3 Industry Trends
5.3.1 Use Case 1: Healthcare Firm
5.3.2 Use Case 2: Myheritage
5.3.3 Use Case 3: Amlaw Group
5.3.4 Use Case 4: VIA
5.4 Regulatory Implications
5.4.1 General Data Protection Regulation
5.4.2 Payment Card Industry Data Security Standard
5.4.3 Health Insurance Portability and Accountability Act
5.4.4 Federal Information Security Management Act
5.4.5 Gramm-Leach-Bliley Act
5.4.6 Sarbanes-Oxley Act
6 Software Defined Perimeter Market, By Component (Page No. - 46)
6.1 Introduction
6.2 Solutions
6.2.1 Solutions: Market Drivers
6.3 Access Control
6.4 Risk Analytics and Visualization
6.5 Security Compliance and Policy Management
6.6 Performance Management and Reporting
6.7 Others
6.8 Services
6.8.1 Services: Market Driver
6.8.2 Consulting and Implementation
6.8.3 Training, Support, and Maintenance
7 Software Defined Perimeter Market, By Connectivity (Page No. - 58)
7.1 Introduction
7.1.1 Connectivity: Market Drivers
7.2 Controller
7.3 Gateway
7.4 End Point
8 Software Defined Perimeter Market, By Deployment Mode (Page No. - 63)
8.1 Introduction
8.2 On-Premises
8.2.1 On-Premises: Market Drivers
8.3 Cloud
8.3.1 Cloud: Market Drivers
9 Software Defined Perimeter Market, By Organization Size (Page No. - 68)
9.1 Introduction
9.2 Large Enterprises
9.2.1 Large Enterprises: Market Drivers
9.3 Small and Medium-Sized Enterprises
9.3.1 Small and Medium-Sized Enterprises: Market Drivers
10 Software Defined Perimeter Market, By User Type (Page No. - 73)
10.1 Introduction
10.2 Government and Defense
10.2.1 Government and Defense: Market Drivers
10.3 IT and Telecom
10.3.1 IT and Telecom: Market Drivers
10.4 Banking, Financial Services and Insurance
10.4.1 Banking, Financial Services and Insurance: Market Drivers
10.5 Manufacturing
10.5.1 Manufacturing: Market Drivers
10.6 Healthcare
10.6.1 Healthcare: Market Drivers
10.7 Retail and Ecommerce
10.7.1 Retail and Ecommerce: Market Drivers
10.8 Others
11 Software Defined Perimeter Market, By Region (Page No. - 86)
11.1 Introduction
11.2 North America
11.2.1 North America: Market Drivers
11.2.2 United States
11.2.3 Canada
11.3 Europe
11.3.1 Europe: Market Drivers
11.3.2 United Kingdom
11.3.3 Germany
11.3.4 France
11.3.5 Rest of Europe
11.4 Asia Pacific
11.4.1 Asia Pacific: Software Defined Perimeter Market Drivers
11.4.2 China
11.4.3 India
11.4.4 Rest of Asia Pacific
11.5 Middle East and Africa
11.5.1 Middle East and Africa: Market Drivers
11.5.2 Israel
11.5.3 South Africa
11.5.4 Rest of Middle East and Africa
11.6 Latin America
11.6.1 Latin America: Market Drivers
11.6.2 Brazil
11.6.3 Rest of Latin America
12 Competitive Landscape (Page No. - 120)
12.1 Overview
12.2 Competitive Scenario
12.2.1 New Product/Solution Launches and Product Enhancements
12.2.2 Business Expansions
12.2.3 Acquisitions
12.2.4 Partnerships, Agreements, and Collaborations
12.3 Competitive Leadership Mapping
12.3.1 Visionary Leaders
12.3.2 Dynamic Differentiators
12.3.3 Innovators
12.3.4 Emerging Companies
13 Company Profiles (Page No. - 127)
(Business Overview, Products Offered, Recent Developments, SWOT Analysis, MnM View)*
13.1 Introduction
13.2 Check Point
13.3 Cisco
13.4 Palo Alto Networks
13.5 Intel
13.6 Fortinet
13.7 Akamai
13.8 Okta
13.9 Symantec
13.10 Proofpoint
13.11 Verizon
13.12 Cato Networks
13.13 APPGate
13.14 Safe-T
13.15 Perimeter 81
13.16 Illumio
13.17 CloudPassage
13.18 DH2i
13.19 Certes Networks
13.20 Pulse Secure
13.21 TrusteDPAssage
13.22 Right-To-Win
*Details on Business Overview, Products Offered, Recent Developments, SWOT Analysis, MnM View Might Not be Captured in Case of Unlisted Companies.
14 Appendix (Page No. - 165)
14.1 Discussion Guide
14.2 Knowledge Store: Marketsandmarkets’ Subscription Portal
14.3 Available Customizations
14.4 Related Reports
14.5 Author Details
List of Tables (105 Tables)
Table 1 United States Dollar Exchange Rate, 2017–2019
Table 2 Factor Analysis
Table 3 Software Defined Perimeter Market Size, By Component, 2017–2024 (USD Million)
Table 4 North America: Components Market Size, By Country, 2017–2024 (USD Million)
Table 5 Solutions: Market Size, By Region, 2017–2024 (USD Million)
Table 6 North America: Solutions Market Size, By Country, 2017–2024 (USD Million)
Table 7 Access Control Market Size, By Region, 2017–2024 (USD Million)
Table 8 Risk Analytics and Visualization Market Size, By Region, 2017–2024 (USD Thousand)
Table 9 Security Compliance and Policy Management Market Size, By Region, 2017–2024 (USD Million)
Table 10 Performance Management and Reporting Market Size, By Region, 2017–2024 (USD Million)
Table 11 Others: Software Defined Perimeter Market Size, By Region, 2017–2024 (USD Thousand)
Table 12 Services: Market Size, By Type, 2017–2024 (USD Million)
Table 13 Services: Market Size, By Region, 2017–2024 (USD Million)
Table 14 North America: Services Market Size, By Country, 2017–2024 (USD Million)
Table 15 Consulting and Implementation Market Size, By Region, 2017–2024 (USD Million)
Table 16 Training, Support, and Maintenance Market Size, By Region, 2017–2024 (USD Thousand)
Table 17 Software Defined Perimeter Market Size, By Connectivity, 2017–2024 (USD Million)
Table 18 Controller: Market Size, By Region, 2017–2024 (USD Million)
Table 19 Gateway: Market Size, By Region, 2017–2024 (USD Million)
Table 20 End Point: Market Size, By Region, 2017–2024 (USD Million)
Table 21 Software Defined Perimeter Market Size, By Deployment Mode, 2017–2024 (USD Million)
Table 22 On-Premises: Market Size, By Region, 2017–2024 (USD Million)
Table 23 North America: On-Premises Market Size, By Country, 2017–2024 (USD Million)
Table 24 Cloud: Market Size, By Region, 2017–2024 (USD Million)
Table 25 North America: Cloud Market Size, By Country, 2017–2024 (USD Million)
Table 26 Software Defined Perimeter Market Size, By Organization Size, 2017–2024 (USD Million)
Table 27 Large Enterprises: Market Size, By Region, 2017–2024 (USD Million)
Table 28 North America: Large Enterprises Market Size, By Country, 2017–2024 (USD Million)
Table 29 Small and Medium-Sized Enterprises: Market Size, By Region, 2017–2024 (USD Million)
Table 30 North America: Small and Medium-Sized Enterprises Market Size, By Country, 2017–2024 (USD Million)
Table 31 Software Defined Perimeter Market Size, By User Type, 2017–2024 (USD Million)
Table 32 Government and Defense: Market Size, By Region, 2017–2024 (USD Million)
Table 33 North America: Government and Defense Market Size, By Country, 2017–2024 (USD Million)
Table 34 IT and Telecom: Market Size, By Region, 2017–2024 (USD Million)
Table 35 North America: IT and Telecom Market Size, By Country, 2017–2024 (USD Million)
Table 36 Banking, Financial Services and Insurance: Market Size, By Region, 2017–2024 (USD Million)
Table 37 North America: Banking, Financial Services and Insurance Market Size, By Country, 2017–2024 (USD Million)
Table 38 Manufacturing: Market Size, By Region, 2017–2024 (USD Thousand)
Table 39 North America: Manufacturing Market Size, By Country, 2017–2024 (USD Million)
Table 40 Healthcare: Market Size, By Region, 2017–2024 (USD Thousand)
Table 41 North America: Healthcare Market Size, By Country, 2017–2024 (USD Million)
Table 42 Retail and Ecommerce: Market Size, By Region, 2017–2024 (USD Thousand)
Table 43 North America: Retail and Ecommerce Market Size, By Country, 2017–2024 (USD Million)
Table 44 Others: Market Size, By Region, 2017–2024 (USD Thousand)
Table 45 North America: Others Market Size, By Country, 2017–2024 (USD Million)
Table 46 Software Defined Perimeter Market Size, By Region, 2017–2024 (USD Million)
Table 47 North America: Market Size, By Component, 2017–2024 (USD Million)
Table 48 North America: Market Size, By Solution, 2017–2024 (USD Million)
Table 49 North America: Market Size, By Service, 2017–2024 (USD Million)
Table 50 North America: Market Size, By Connectivity, 2017–2024 (USD Million)
Table 51 North America: Market Size, By Organization Size, 2017–2024 (USD Million)
Table 52 North America: Market Size, By Deployment Mode, 2017–2024 (USD Million)
Table 53 North America: Market Size, By User Type, 2017–2024 (USD Thousand)
Table 54 North America: Market Size, By Country 2017–2024 (USD Million)
Table 55 United States: Software Defined Perimeter Market Size, By Component, 2017–2024 (USD Million)
Table 56 United States: Market Size, By Solutions, 2017–2024 (USD Thousand)
Table 57 United States: Market Size, By Service, 2017–2024 (USD Million)
Table 58 United States: Market Size, By Connectivity, 2017–2024 (USD Million)
Table 59 United States: Market Size, By Deployment Mode, 2017–2024 (USD Million)
Table 60 United States: Market Size, By Organization Size, 2017–2024 (USD Million)
Table 61 United States: Market Size, By User Type, 2017–2024 (USD Thousand)
Table 62 Canada: Software Defined Perimeter Market Size, By Component, 2017–2024 (USD Million)
Table 63 Canada: Market Size, By Solution, 2017–2024 (USD Thousand)
Table 64 Canada: Market Size, By Service, 2017–2024 (USD Thousand)
Table 65 Canada: Market Size, By Connectivity, 2017–2024 (USD Million)
Table 66 Canada: Market Size, By Organization Size, 2017–2024 (USD Million)
Table 67 Canada: Market Size, By Deployment Mode, 2017–2024 (USD Million)
Table 68 Canada: Market Size, By User Type, 2017–2024 (USD Thousand)
Table 69 Europe: Software Defined Perimeter Market Size, By Component, 2017–2024 (USD Million)
Table 70 Europe: Market Size, By Solution, 2017–2024 (USD Million)
Table 71 Europe: Market Size, By Service, 2017–2024 (USD Million)
Table 72 Europe: Market Size, By Connectivity, 2017–2024 (USD Million)
Table 73 Europe: Market Size, By Organization Size, 2017–2024 (USD Million)
Table 74 Europe: Market Size, By Deployment Mode, 2017–2024 (USD Million)
Table 75 Europe: Market Size, By User Type, 2017–2024 (USD Thousand)
Table 76 Europe: Market Size, By Country, 2017–2024 (USD Million)
Table 77 Asia Pacific: Software Defined Perimeter Market Size, By Component, 2017–2024 (USD Million)
Table 78 Asia Pacific: Market Size, By Solution, 2017–2024 (USD Million)
Table 79 Asia Pacific: Market Size, By Service, 2017–2024 (USD Million)
Table 80 Asia Pacific: Market Size, By Connectivity, 2017–2024 (USD Million)
Table 81 Asia Pacific: Market Size, By Organization Size, 2017–2024 (USD Million)
Table 82 Asia Pacific: Market Size, By Deployment Mode, 2017–2024 (USD Million)
Table 83 Asia Pacific: Market Size, By User Type, 2017–2024 (USD Thousand)
Table 84 Asia Pacific: Market Size, By Country, 2017–2024 (USD Million)
Table 85 Middle East and Africa: Software Defined Perimeter Market Size, By Component, 2017–2024 (USD Million)
Table 86 Middle East and Africa: Market Size, By Solution, 2017–2024 (USD Thousand)
Table 87 Middle East and Africa: Market Size, By Service, 2017–2024 (USD Thousands Million)
Table 88 Middle East and Africa: Market Size, By Connectivity, 2017–2024 (USD Million)
Table 89 Middle East and Africa: Market Size, By Organization Size, 2017–2024 (USD Million)
Table 90 Middle East and Africa: Market Size, By Deployment Mode, 2017–2024 (USD Million)
Table 91 Middle East and Africa: Market Size, By User Type, 2017–2024 (USD Thousand)
Table 92 Middle East and Africa: Market Size, By Country 2017–2024 (USD Thousand)
Table 93 Latin America: Software Defined Perimeter Market Size, By Component, 2017–2024 (USD Million)
Table 94 Latin America: Market Size, By Solution, 2017–2024 (USD Thousand)
Table 95 Latin America: Market Size, By Service, 2017–2024 (USD Thousand)
Table 96 Latin America: Market Size, By Connectivity, 2017–2024 (USD Thousand)
Table 97 Latin America: Market Size, By Organization Size, 2017–2024 (USD Million)
Table 98 Latin America: Market Size, By Deployment Mode, 2017–2024 (USD Million)
Table 99 Latin America: Market Size, By User Type, 2017–2024 (USD Thousand)
Table 100 Latin America: Software Defined Perimeter Market Size, By Country 2017–2024 (USD Million)
Table 101 New Product/Solution Launches and Product Enhancements, 2018–2019
Table 102 Business Expansions, 2018–2019
Table 103 Acquisitions, 2018–2019
Table 104 Partnerships, Agreements, and Collaborations, 2018–2019
Table 105 Evaluation Criteria
List of Figures (39 Figures)
Figure 1 Software Defined Perimeter Market: Research Design
Figure 2 Data Triangulation
Figure 3 Market Size Estimation Methodology: Approach 1 (Supply Side): Revenue of Solutions/Services of the Market
Figure 4 Market Size Estimation Methodology: Approach 1 Bottom-Up (Supply Side): Collective Revenue of All Solutions/Services of the Market
Figure 5 Market Size Estimation Methodology: Approach 2 Top-Down (Demand Side): Share of Market Through the Overall Software Defined Perimeter Spending
Figure 6 Software Defined Perimeter Market: Top-Down and Bottom-Up Approaches
Figure 7 Large Enterprises Segment to Hold the Highest Share in the Market in 2019
Figure 8 North America to Hold the Largest Market Size in the Market in 2019
Figure 9 Rising Need for Policy-Based Security Architecture to Reduce Network Complexities to Drive the Market
Figure 10 Government and Defense User Type and the United States to Account High Market Shares in the North American Market in 2019
Figure 11 Software Defined Perimeter Market in India to Grow at the Highest Rate During the Forecast Period
Figure 12 Drivers, Restraints, Opportunities, and Challenges: Market
Figure 13 Services Segment to Grow at a Higher CAGR During the Forecast Period
Figure 14 Security Compliance and Policy Management Segment to Grow at the Highest CAGR During the Forecast Period
Figure 15 Consulting and Implementation Segment to Grow at a Higher CAGR During the Forecast Period
Figure 16 End Point Segment to Grow at the Highest CAGR During the Forecast Period
Figure 17 Cloud Segment to Grow at a Higher CAGR During the Forecast Period
Figure 18 Small and Medium-Sized Enterprises Segment to Grow at a Higher CAGR During the Forecast Period
Figure 19 Retail and Ecommerce Vertical to Grow at the Highest CAGR During the Forecast Period
Figure 20 Asia Pacific to Witness Significant Growth During the Forecast Period
Figure 21 North America: Market Snapshot
Figure 22 Asia Pacific: Market Snapshot
Figure 23 Key Developments By the Leading Players in the Software Defined Perimeter Market, 2018–2019
Figure 24 Software Defined Perimeter Market (Global) Competitive Leadership Mapping, 2019
Figure 25 Check Point: Company Snapshot
Figure 26 Check Point: SWOT Analysis
Figure 27 Cisco: Company Snapshot
Figure 28 Cisco: SWOT Analysis
Figure 29 Palo Alto Networks: Company Snapshot
Figure 30 Palo Alto Networks: SWOT Analysis
Figure 31 Intel: Company Snapshot
Figure 32 Intel: SWOT Analysis
Figure 33 Fortinet: Company Snapshot
Figure 34 Fortinet: SWOT Analysis
Figure 35 Akamai: Company Snapshot
Figure 36 Okta: Company Snapshot
Figure 37 Symantec: Company Snapshot
Figure 38 Proofpoint: Company Snapshot
Figure 39 Verizon: Company Snapshot
The study involved 4 major activities in estimating the current market size of the Software Defined Perimeter (SDP) market. An extensive secondary research was done to collect information on the market, peer market, and the parent market. The next step was to validate these findings, assumptions, and sizing with industry experts across the value chain through primary research. Both top-down and bottom-up approaches were used to estimate the total market size. After that, the market breakup and data triangulation procedures were used to estimate the market size of the segments and subsegments of the SDP market.
Secondary Research
In the secondary research process, various secondary sources, such as D&B Hoovers and Bloomberg, BusinessWeek, Dun Bradstreet, and Factiva, have been referred to, for identifying and collecting information for this study. Secondary sources included annual reports; press releases and investor presentations of companies; whitepapers, certified publications, and articles by recognized authors; gold standard and silver standard websites; Research and Development (R&D) organizations; regulatory bodies; and databases. Journals, repositories, and resources from the Journal of Cloud Security Alliance (CSA): A proposed way forward, and How the network security solutions could get it with perimeter security were referred to for understanding the integration of SDP.
Primary Research
Various primary sources from both the supply and demand sides of the SDP market were interviewed to obtain qualitative and quantitative information for this study. The primary sources from the supply side included industry experts, such as Chief Executive Officers (CEOs), Vice Presidents (VPs), technology and innovation directors, and related key executives from various vendors offering SDP solutions, associated service providers, and system integrators operating in the targeted regions. All possible parameters that affect the market covered in this research study have been accounted for, viewed in extensive detail, verified through primary research, and analyzed to get the final quantitative and qualitative data.
The following is the breakup of primary profiles:
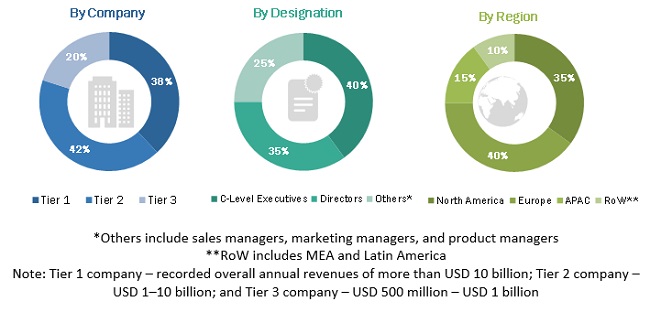
To know about the assumptions considered for the study, download the pdf brochure
Market Size Estimation
Both top-down and bottom-up approaches were used to estimate and validate the total size of the SDP market. The top-down approach was used to derive the revenue contribution of top vendors and their offerings in the SDP market. The bottom-up approach was used to arrive at the overall market size of the global SDP market using key companies’ revenue and their offerings in the market. The research methodology used to estimate the market size includes the following:
- Key players in the market were identified through extensive secondary research
- The market size, in terms of value, was determined through primary and secondary research processes
- All percentage, shares split, and breakups were determined using secondary sources and verified through primary sources
Data Triangulation
After arriving at the overall market size using the market size estimation processes as explained above, the market was split into several segments and subsegments. To complete the overall market engineering process and arrive at the exact statistics of each market segment and subsegment, data triangulation and market breakup procedures were employed, wherever applicable. The overall market size was then used in the top-down procedure to estimate the size of other individual markets via percentage splits of the market segmentation.
Report Objectives
- To define, segment, and related project the global market size for SDP
- To understand the structure of the SDP market by identifying its various subsegments
- To provide detailed information about key factors influencing the growth of the market (drivers, restraints, opportunities, and industry-specific challenges)
- To analyze the micromarkets concerning individual growth trends, prospects, and their contribution to the overall market
- To project the size of the market and its submarkets, in terms of value, for the 5 regions (along with their respective key countries)
- To profile key players and comprehensively analyze their core competencies
- To understand the competitive landscape and identify significant growth strategies adopted by players across key regions
- To analyze competitive developments, such as expansions and fundings, new product launches, mergers and acquisitions, strategic partnerships and agreements in the software defined perimeter market
Available Customizations
With the given market data, MarketsandMarkets offers customizations as per the company’s specific needs. The following customization options are available for the report:
Product Analysis
- Product matrix provides a detailed comparison of the product portfolio of each company
Geographic Analysis
- Further breakup of the North American SDP market
- Further breakup of the European SDP market
- Further breakup of the APAC SDP market
- Further breakup of the Latin American SDP market
- Further breakup of the MEA SDP market
Company Information
- Detailed analysis and profiling of additional market players up to 20


Growth opportunities and latent adjacency in Software Defined Perimeter Market
What companies are out there in the Software Defined Perimeter Market? What are their market leading strategies?