Solenoid Valve Market by Body Material (Stainless Steel, Brass, Aluminum, and Plastic), Valve Design (2-way, 3-way, 4-way, and 5-way) - Global Forecast to 2035


Emergency Shutdown System Market Summary
The global Emergency Shutdown System Market is undergoing steady expansion as oil & gas, chemical, petrochemical, power generation, pharmaceuticals, mining, and other process industries increase investments in functional safety, industrial automation, and risk-management infrastructure. The market is estimated at approximately USD 2 billion in 2025 and is projected to reach around USD 3 billion by 2035, registering a CAGR of approximately 6% during the forecast period. Rising concerns regarding industrial accidents, stricter functional-safety requirements, modernization of aging process facilities, and increasing deployment of automated control systems are among the primary factors supporting market growth. The growing integration of AI, IoT, edge computing, cloud connectivity, and industrial automation is also transforming emergency shutdown architectures by enabling faster monitoring, diagnostics, and predictive maintenance.
Emergency shutdown systems are designed to bring industrial processes or equipment to a safe state when predetermined hazardous conditions occur. These systems can automatically isolate equipment, stop machinery, close valves, shut down pumps, or interrupt fuel and energy supplies to minimize the consequences of abnormal operating conditions. As industrial facilities become more complex and highly automated, reliable shutdown functionality is becoming increasingly important for protecting personnel, assets, production continuity, and the environment.
The adoption of Industry 4.0 technologies is creating new opportunities for emergency shutdown system manufacturers. IoT-enabled sensors can continuously monitor temperature, pressure, flow, vibration, gas concentration, and other process parameters. Advanced analytics can identify deviations before they escalate into critical events, while AI-supported diagnostics can assist operators in identifying potential equipment failures. However, emergency shutdown functions remain safety-critical systems and are typically designed around deterministic, validated safety architectures rather than relying solely on AI decision-making.
Key Market Trends & Insights
The North American market is expected to remain a leading regional market due to the region's extensive oil & gas infrastructure, process manufacturing base, industrial automation adoption, and emphasis on workplace and process safety. The modernization of refineries, chemical plants, pipelines, and power facilities is generating continuing demand for safety instrumented systems and emergency shutdown solutions.
Asia Pacific is expected to register the fastest growth through 2035. Rapid industrialization, expanding refining and petrochemical capacity, increasing power generation investments, and the development of new manufacturing facilities across China, India, Japan, South Korea, and Southeast Asia are supporting demand.
The oil & gas industry remains a dominant application segment, particularly across upstream, midstream, and downstream facilities. Refineries, LNG facilities, offshore platforms, pipelines, and petrochemical plants operate under demanding conditions where automated emergency shutdown capabilities are essential for risk reduction.
A major technology trend is the integration of emergency shutdown systems with safety instrumented systems (SIS), distributed control systems (DCS), programmable logic controllers (PLCs), and industrial communication networks. This integration provides operators with improved visibility while maintaining separation between safety and basic process-control functions where required.
AI and analytics are increasingly being applied to predictive maintenance and system diagnostics. While the final emergency shutdown action generally relies on validated safety logic, AI can help identify deteriorating sensors, valves, actuators, or other components before they compromise system availability.
Market Size & Forecast
-
Base year market size (2025): Approximately USD 2 billion.
-
Forecast market value (2035): Approximately USD 3 billion.
-
Expected CAGR (2025–2035): Approximately 6%.
-
Major growth drivers: Industrial automation, functional-safety requirements, process-plant modernization, expansion of oil & gas infrastructure, and increasing emphasis on worker and environmental safety.
-
Technology outlook: IoT-enabled sensing, advanced diagnostics, edge computing, digital twins, industrial cybersecurity, and automation will increasingly influence system development.
-
Demand outlook: Replacement of legacy shutdown systems and new installations in greenfield industrial projects are expected to generate sustained opportunities.
Emergency Shutdown System Market Top 10 key takeaway
-
The global Emergency Shutdown System Market is projected to reach approximately USD 3 billion by 2035.
-
The market is expected to expand at approximately 6% CAGR between 2025 and 2035.
-
North America is expected to remain one of the leading regional markets.
-
Asia Pacific is projected to record the fastest growth during the forecast period.
-
Oil & gas remains one of the most important application industries.
-
Process-plant modernization is creating demand for advanced emergency shutdown architectures.
-
Safety instrumented systems are increasingly integrated with industrial automation platforms.
-
IoT sensors are improving monitoring and diagnostic capabilities around shutdown systems.
-
AI is increasingly used for predictive maintenance and anomaly detection rather than replacing deterministic safety logic.
-
Industrial cybersecurity, functional safety, and lifecycle management will become increasingly important competitive factors.
Product Insights
The Emergency Shutdown System Market includes safety controllers, emergency shutdown valves, sensors and transmitters, actuators, logic solvers, relays, communication interfaces, and integrated safety instrumented system platforms. Among these, safety controllers and logic-solving platforms represent a critical product category because they execute validated shutdown logic when hazardous process conditions are detected.
Emergency shutdown valves are also highly important in process industries because they physically isolate process flows during dangerous conditions. Their use is particularly widespread in oil & gas production facilities, refineries, LNG terminals, chemical plants, and pipeline infrastructure. Demand is increasing for high-reliability valves capable of operating under extreme pressure, temperature, corrosive environments, and demanding maintenance conditions.
Modern emergency shutdown systems increasingly feature redundant controllers, diagnostics, fail-safe architectures, remote monitoring, and improved communication capabilities. Manufacturers are also developing modular safety platforms that can be scaled according to plant size and process complexity.
Emerging products include intelligent valve positioners, smart sensors, remote I/O systems, cybersecurity-enabled safety controllers, and diagnostic software. These technologies can provide information about equipment health without compromising the fundamental safety architecture.
AI and analytics are becoming increasingly relevant at the product level. Intelligent diagnostics can monitor valve stroke times, sensor health, actuator performance, and controller conditions. This enables maintenance teams to identify degradation earlier and reduce the probability of hidden failures.
Technology / Component Insights
Technology is a fundamental differentiator in the Emergency Shutdown System Market. Modern systems combine sensors, logic solvers, final control elements, communication networks, engineering software, and human-machine interfaces to create a coordinated safety architecture.
Safety instrumented systems (SIS) remain central to modern emergency shutdown applications. SIS architectures are designed to detect hazardous conditions and initiate predetermined safety actions independently or with an appropriate level of separation from conventional process-control systems.
IoT technologies are improving the ability of maintenance teams to monitor safety-system components. Connected sensors can provide condition information related to pressure, temperature, vibration, valve position, and equipment status. This information can be analyzed through centralized industrial platforms.
Cloud computing is increasingly used for engineering data, asset management, reporting, and predictive maintenance applications, although critical shutdown logic generally remains within validated local or appropriately engineered safety infrastructure.
Edge computing is particularly relevant because it allows data to be analyzed close to industrial equipment. Edge-based analytics can support rapid diagnostics and reduce communication dependency.
Digital twins are another emerging technology. A digital representation of a process facility can help engineers evaluate equipment behavior, simulate abnormal conditions, and optimize maintenance strategies.
Industrial cybersecurity is becoming equally important. As safety systems become more connected, organizations must protect controllers, engineering workstations, communication networks, and remote-access interfaces against unauthorized access and cyber threats.
Application Insights
The oil & gas sector is expected to remain the leading application segment in the Emergency Shutdown System Market. Oil & gas facilities involve flammable materials, high pressures, extreme temperatures, and complex process operations, making reliable shutdown capabilities essential.
Upstream applications include offshore platforms, drilling facilities, production installations, and gathering systems. Midstream applications include pipelines, compressor stations, storage terminals, and LNG infrastructure. Downstream applications include refineries and petrochemical plants.
The chemical industry is another significant application area because chemical processes can involve toxic, corrosive, reactive, or combustible materials. Emergency shutdown systems help operators respond quickly to abnormal conditions and limit the scale of potential incidents.
Power generation facilities also require safety shutdown mechanisms across turbines, boilers, fuel systems, and other critical equipment. Pharmaceutical, food processing, mining, and industrial manufacturing facilities represent additional opportunities.
Future growth is expected to come from modernization projects, expansion of process industries, new energy infrastructure, and the increasing adoption of automated safety systems. Hydrogen, carbon capture, LNG, battery materials, and other emerging industrial applications could create new demand for advanced shutdown technologies.
Regional Insights
North America is expected to remain a major market due to its mature industrial infrastructure, large oil & gas sector, and strong emphasis on process safety. The United States accounts for a significant share of regional demand, supported by refinery modernization, shale-gas infrastructure, LNG investments, chemical manufacturing, and automation upgrades. Canada also represents an important market because of its oil sands, pipeline infrastructure, petrochemical facilities, and mining activities.
Europe has a mature Emergency Shutdown System Market supported by established process industries, stringent safety practices, and ongoing modernization of industrial facilities. Germany, France, the UK, Italy, and the Netherlands remain important industrial markets. European companies are increasingly focused on lifecycle optimization, digital safety management, and industrial cybersecurity.
Asia Pacific is expected to experience the fastest growth. China and India are expanding refining, petrochemical, power generation, and manufacturing capacity, while Japan and South Korea continue investing in sophisticated industrial automation. Southeast Asia is also creating opportunities through LNG, petrochemical, and industrial infrastructure projects.
-
North America: Mature process industries and infrastructure modernization support strong demand.
-
Europe: Functional-safety practices and industrial modernization maintain steady market opportunities.
-
Asia Pacific: Industrialization and new process facilities are driving the fastest growth.
-
Middle East & Africa: Oil & gas projects remain major sources of demand.
-
Latin America: Refinery, mining, and energy infrastructure investments are creating emerging opportunities.
Country-Specific Market Trends
Country-level adoption varies according to industrial capacity, safety regulations, infrastructure investments, and modernization cycles. China is expected to grow at approximately 8% CAGR, supported by petrochemical expansion, manufacturing automation, and energy infrastructure development. Japan could grow at around 5% CAGR, reflecting its mature process industries, advanced automation capabilities, and continued modernization.
In North America, the United States is projected to expand at approximately 6% CAGR, supported by oil & gas, chemicals, LNG, refining, and industrial automation investments. Canada could grow at around 5% CAGR, driven by energy infrastructure and process-industry modernization, while Mexico could achieve approximately 6% CAGR as manufacturing and energy infrastructure continue to develop.
In Europe, Germany could grow at approximately 5% CAGR, supported by industrial automation and chemical manufacturing, while France could expand at around 5% CAGR through investments in energy, chemicals, pharmaceuticals, and industrial safety.
Government regulations and industry standards remain central to adoption. Operators are increasingly focused not only on installing safety systems but also on ensuring their lifecycle performance, testing, documentation, cybersecurity, and functional reliability.
-
China: Petrochemical expansion and industrial automation support rapid adoption.
-
Japan: Mature process industries and advanced automation drive replacement demand.
-
United States: Oil & gas, LNG, chemicals, and refinery investments remain key growth drivers.
-
Germany: Process manufacturing and industrial modernization sustain demand.
-
France: Energy, chemical, pharmaceutical, and industrial safety investments support market expansion.
Key Emergency Shutdown System Company Insights
The competitive landscape includes major industrial automation, process-control, safety-system, valve, and instrumentation companies. Key participants include Emerson, Honeywell International, Siemens, Schneider Electric, ABB, Rockwell Automation, Yokogawa Electric, Baker Hughes, SLB, and HIMA.
These companies are increasingly focusing on integrated safety platforms, modular controllers, high-reliability final control elements, advanced diagnostics, and industrial cybersecurity. Product strategies increasingly emphasize interoperability between safety systems and broader automation architectures while maintaining the required independence and reliability of safety functions.
AI and analytics are primarily being applied to asset health, diagnostics, predictive maintenance, and operational insights. Companies are also investing in digital lifecycle-management platforms that enable engineering teams to monitor system performance and maintenance requirements over long operating periods.
-
Emerson: Focuses on integrated automation, safety, process control, and digital plant technologies.
-
Honeywell: Combines safety systems with process automation and industrial digitalization.
-
Siemens: Emphasizes integrated industrial automation, safety, and digital engineering.
-
Schneider Electric: Focuses on industrial automation, safety, energy management, and connected operations.
-
ABB: Develops automation and safety technologies for process industries and critical infrastructure.
Recent Developments
The market is increasingly witnessing the integration of advanced diagnostics into safety instrumented systems. Manufacturers are enhancing controller and final-element monitoring to identify potential failures before scheduled proof testing or unexpected shutdown events.
Another important development is the expansion of digital lifecycle-management platforms. These platforms combine engineering information, safety-system diagnostics, maintenance records, and asset data to help operators manage safety systems throughout their operating lifecycle.
Industrial automation providers are also increasing investments in cybersecurity-enabled safety architectures. As industrial facilities become more connected, security features such as secure communications, access management, network segmentation, and continuous monitoring are becoming important components of modern safety-system deployments.
Market Segmentation
The Emergency Shutdown System Market can be segmented by product, technology/component, application, and region. By product, the market includes safety controllers, sensors, emergency shutdown valves, actuators, logic solvers, relays, and related software and communication components. Safety controllers and final control elements represent critical segments because they directly participate in detecting and executing shutdown actions.
By technology/component, the market includes safety instrumented systems, programmable safety controllers, sensors and transmitters, emergency shutdown valves, industrial communication technologies, and diagnostic platforms. By application, major sectors include oil & gas, chemical and petrochemical, power generation, pharmaceuticals, mining, manufacturing, and other process industries. By region, the market covers North America, Europe, Asia Pacific, Latin America, and the Middle East & Africa.
-
By Product: Safety controllers, valves, sensors, and actuators represent key product categories.
-
By Technology: SIS, safety PLCs, intelligent sensors, diagnostics, and industrial networking are major technologies.
-
By Application: Oil & gas and chemical industries account for substantial demand.
-
By Region: North America leads in market maturity, while Asia Pacific offers strong growth potential.
-
Future segmentation: Connected diagnostics, cybersecurity, digital twins, and predictive maintenance will gain importance.
The Emergency Shutdown System Market is positioned for steady expansion as industrial operators prioritize functional safety, asset protection, regulatory compliance, and operational resilience. With the global market estimated at approximately USD 2 billion in 2025 and projected to approach USD 3 billion by 2035, demand will remain closely linked to process-industry investment, plant modernization, and the replacement of legacy safety infrastructure.
AI, IoT, edge computing, digital twins, and industrial analytics will increasingly enhance emergency shutdown system lifecycle management. However, the future of safety automation will depend on combining these technologies with deterministic, validated safety architectures rather than treating AI as a replacement for safety logic. Predictive diagnostics can help identify sensor, valve, actuator, and controller degradation before it affects system availability.
Through 2035, businesses are expected to prioritize scalable, interoperable, cybersecure, and diagnostically capable emergency shutdown solutions. For oil & gas, chemicals, power generation, and other process industries, investment in advanced shutdown systems will remain strategically important for reducing operational risk, protecting personnel and assets, and supporting reliable production in increasingly automated industrial environments.
FAQs
1. What is the market size of the Emergency Shutdown System Market?
The global Emergency Shutdown System Market is estimated at approximately USD 2 billion in 2025 and is projected to reach around USD 3 billion by 2035.
2. What is the growth rate of the Emergency Shutdown System Market?
The market is expected to grow at approximately 6% CAGR from 2025 to 2035, driven by industrial automation, plant modernization, process-safety requirements, and expansion of energy and chemical infrastructure.
3. What are the key drivers of the Emergency Shutdown System Market?
Key drivers include increasing industrial safety requirements, modernization of aging facilities, expansion of oil & gas and chemical infrastructure, adoption of industrial automation, functional-safety practices, IoT-enabled diagnostics, and growing focus on operational risk management.
4. Which region is expected to lead the Emergency Shutdown System Market?
North America is expected to remain a leading market due to its mature oil & gas, chemical, and process industries. Asia Pacific is expected to record the fastest growth because of rapid industrialization and expansion of refining, petrochemical, manufacturing, and energy infrastructure.
5. Who are the key companies in the Emergency Shutdown System Market?
Major companies include Emerson, Honeywell International, Siemens, Schneider Electric, ABB, Rockwell Automation, Yokogawa Electric, Baker Hughes, SLB, and HIMA, among other industrial automation and safety-system providers.
 Exclusive indicates content/data unique to MarketsandMarkets and not available with any competitors.
Table of Contents
1 Introduction (Page No. - 16)
1.1 Study Objectives
1.2 Market Definition
1.3 Study Scope
1.3.1 Markets Covered
1.3.2 Geographic Scope
1.3.3 Years Considered for the Study
1.4 Currency
1.5 Limitations
1.6 Stakeholders
2 Research Methodology (Page No. - 20)
2.1 Research Data
2.1.1 Secondary Data
2.1.1.1 Key Data From Secondary Sources
2.1.2 Primary Data
2.1.2.1 Key Data From Primary Sources
2.1.2.2 Key Industry Insights
2.1.2.3 Breakdown of Primaries
2.2 Factor Analysis
2.2.1 Introduction
2.2.2 Demand-Side Analysis
2.2.2.1 Increasing Adoption of Solenoid Valves in the Pharmaceutical Industry Would Drive the Demand for This Market
2.3 Market Size Estimation
2.3.1 Bottom-Up Approach
2.3.2 Top-Down Approach
2.4 Market Breakdown and Data Triangulation
2.5 Research Assumptions
3 Executive Summary (Page No. - 29)
4 Premium Insights (Page No. - 35)
4.1 Attractive Opportunities for the Solenoid Valves Market
4.2 Solenoid Valve Market, By Industry
4.3 Market in APAC
4.4 Life Cycle Analysis, By Geography
5 Market Overview (Page No. - 38)
5.1 Introduction
5.2 Market Segmentation
5.2.1 Market, By Body Material
5.2.2 Operating Procedures of Solenoid Valves
5.2.3 Market, By Valve Design
5.2.4 Market, By Industry
5.2.5 Market, By Geography
5.3 Market Dynamics
5.3.1 Drivers
5.3.1.1 Increasing Adoption of Solenoid Valves in the Food & Beverages Industry
5.3.1.2 Shift to Renewable Sources for Power Generation
5.3.2 Restraints
5.3.2.1 Technical Problems Associated With Solenoid Valves May Affect the Market
5.3.3 Opportunities
5.3.3.1 Increasing Demand for Wastewater Treatment Industries
5.3.3.2 Growing Adoption of Solenoid Valves in A Wide Range of Process Industries
5.3.4 Challenges
5.3.4.1 Reliability of Solenoid Valve
6 Industry Trends (Page No. - 48)
6.1 Introduction
6.2 Value Chain Analysis
6.3 Porter’s Five Forces Analysis
6.3.1 Intensity of Competitive Rivalry
6.3.2 Threat of Substitutes
6.3.3 Bargaining Power of Buyers
6.3.4 Bargaining Power of Suppliers
6.3.5 Threat of New Entrants
6.4 Strategic Benchmarking
6.4.1 Technology Integration and Product Enhancement
7 Operating Procedures of Solenoid Valves (Page No. - 57)
7.1 Introduction
7.2 Direct Operated
7.3 Indirect (Pilot) Operated
7.4 Semi-Direct Operated
8 Market, By Body Material (Page No. - 60)
8.1 Introduction
8.2 Stainless Steel Body Material
8.3 Brass Body Material
8.4 Aluminum Body Material
8.5 Plastic Body Material
9 Market, By Valve Design (Page No. - 69)
9.1 Introduction
9.2 2-Way Solenoid Valves
9.3 3-Way Solenoid Valves
9.4 4-Way Solenoid Valves
9.5 5-Way Solenoid Valves
10 Market, By Industry (Page No. - 77)
10.1 Introduction
10.2 Oil & Gas
10.3 Chemical & Petrochemical
10.4 Water & Wastewater
10.5 Food & Beverages
10.6 Power Generation
10.7 Pharmaceutical
10.8 Automotive
10.9 Medical
10.10 Others
11 Market, By Geography (Page No. - 104)
11.1 Introduction
11.2 Americas
11.2.1 North America
11.2.1.1 U.S.
11.2.1.1.1 Upgrading of Existing Facilities Would Drive the Market in the U.S.
11.2.1.2 Canada
11.2.1.2.1 Growing Medical and Healthcare Industry
11.2.1.3 Mexico
11.2.1.3.1 Growing Manufacturing Industry Would Further Drive the Utilization of Solenoid Valves
11.2.2 South America
11.3 Europe
11.3.1 Germany
11.3.1.1 Advanced Manufacturing Capabilities
11.3.2 France
11.3.2.1 Second-Largest Solenoid Valve Market in Europe
11.3.3 Italy
11.3.3.1 Third-Largest Solenoid Valve Market in Europe
11.3.4 U.K.
11.3.4.1 Growing Automation Technologies Would Drive the Solenoid Valves Market
11.3.5 Rest of Europe
11.3.5.1 Growing Economic Conditions
11.4 Asia-Pacific
11.4.1 Japan
11.4.1.1 A Substantial Mature Market
11.4.2 China
11.4.2.1 Second-Largest Solenoid Valve Market in Asia-Pacific
11.4.3 South Korea
11.4.3.1 Growth From Semiconductor Manufacturing Companies
11.4.4 India
11.4.4.1 Prominent Growth in the Water Treatment Plants
11.4.5 Rest of APAC
11.4.5.1 Australia & Indonesia are Potential Countries for Solenoid Valves
11.5 Rest of the World (RoW)
11.5.1 Middle East
11.5.1.1 Huge Oil & Gas Reserves and Petrochemical Industries Would Drive the Solenoid Valve Market
11.5.2 Africa
11.5.2.1 Emerging Region for Various Industries
12 Competitive Landscape (Page No. - 134)
12.1 Introduction
12.2 Market Ranking of Players in the Market, 2015
12.3 Competitive Scenario
12.4 Recent Developments
13 Company Profiles (Page No. - 139)
13.1 Introduction
13.2 Asco Valve, Inc.
13.3 Christian Bürkert GmbH & Co. Kg
13.4 Curtiss-Wright Corporation
13.5 Danfoss A/S
13.6 GSR Ventiltechnik GmbH & Co. Kg
13.7 IMI PLC
13.8 Parker Hannifin Corporation
13.9 Rotex Controls B.V.
13.10 SMC Corporation
13.11 The LEE Company
14 Appendix (Page No. - 161)
14.1 Insights of Industry Experts
14.2 Discussion Guide
14.3 Knowledge Store: Marketsandmarkets Subscription Portal
14.4 Introducing RT: Real-Time Market Intelligence
14.5 Available Customizations
14.6 Related Reports
List of Tables (74 Tables)
Table 1 Increasing Adoption of Solenoid Valves in Food & Beverages Industry Would Drive the Market
Table 2 Technical Problems Assocaited With Solenoid Valves May Affect the Solenoid Valve Market
Table 3 Increasing Demand for Solenoid Valves in Waste Water Treatment Plants Might Witness A Huge Opportunity for This Industry
Table 4 Porter’s Five Forces Analysis: Low Degree of Threat of Substitutes Likely to Have Minimum Impact on the Overall Market in 2015
Table 5 Market, By Body Material, 2013–2022 (USD Million)
Table 6 Market, By Body Material, 2013–2022 (Million Units)
Table 7 Market for Stainless Steel Body Material, By Region, 2013–2022 (USD Million)
Table 8 Market for Stainless Steel Body Material, By Region, 2013–2022 (Thousand Units)
Table 9 Market for Brass Body Material, By Region, 2013–2022 (USD Million)
Table 10 Market for Brass Body Material, By Region, 2013–2022 (Million Units)
Table 11 Solenoid Valve Market for Aluminum Body Material, By Region, 2013–2022 (USD Million)
Table 12 Market for Aluminum Body Material, By Region, 2013–2022 (Thousand Units)
Table 13 Market for Plastic Body Material, By Region, 2013–2022 (USD Million)
Table 14 Market for Plastic Body Material, By Region, 2013–2022 (Thousand Units)
Table 15 Market, By Valve Design Type, 2013–2022 (USD Million)
Table 16 Market for 2-Way Valve Design Type, By Industry, 2013–2022 (USD Million)
Table 17 Market for 3-Way Valve Design Type, By Industry, 2013–2022 (USD Million)
Table 18 Market for 4-Way Valve Design Type, By Industry, 2013–2022 (USD Million)
Table 19 Market for 5-Way Valve Design Type, By Industry, 2013–2022 (USD Million)
Table 20 Market, By Industry, 2013–2022 (USD Million)
Table 21 Market, By Industry, 2013–2022 (Million Units)
Table 22 Market for Oil & Gas Industry, By Region, 2013–2022 (USD Million)
Table 23 Market for Oil & Gas Industry, By Region, 2013–2022 (Thousand Units)
Table 24 Market for Oil & Gas Industry, By Valve Design Type, 2013–2022 (USD Million)
Table 25 Market for Chemical & Petrochemical Industry, By Region, 2013–2022 (USD Million)
Table 26 Market for Chemical & Petrochemical Industry, By Region, 2013–2022 (Thousand Units)
Table 27 Market for Chemical & Petrochemical Industry, By Valve Design Type, 2013–2022 (USD Million)
Table 28 Market for Water & Wastewater Industry, By Region, 2013–2022 (USD Million)
Table 29 Market for Water & Wastewater Industry, By Region, 2013–2022 (Thousand Units)
Table 30 Market for Water & Wastewater Industry, By Valve Design Type, 2013–2022 (USD Million)
Table 31 Market for Food & Beverages Industry, By Region, 2013–2022 (USD Million)
Table 32 Market for Food & Beverages Industry, By Region, 2013–2022 (Thousand Units)
Table 33 Market for Food & Beverages Industry, By Valve Design Type, 2013–2022 (USD Million)
Table 34 Market for Power Generation Industry, By Region, 2013–2022 (USD Million)
Table 35 Market for Power Generation Industry, By Region, 2013–2022 (Thousand Units)
Table 36 Market for Power Generation Industry, By Valve Design Type, 2013–2022 (USD Million)
Table 37 Market for Pharmaceuticals Industry, By Region, 2013–2022 (USD Million)
Table 38 Market for Pharmaceuticals Industry, By Region, 2013–2022 (Thousand Units)
Table 39 Market for Pharmaceuticals Industry, By Valve Design Type, 2013–2022 (USD Million)
Table 40 Market for Automotive Industry, By Region, 2013–2022 (USD Million)
Table 41 Market for Automotive Industry, By Region, 2013–2022 (Thousand Units)
Table 42 Market for Automotive Industry, By Valve Design Type, 2013–2022 (USD Million)
Table 43 Market for Medical Industry, By Region, 2013–2022 (USD Million)
Table 44 Market for Medical Industry, By Region, 2013–2022 (Thousand Units)
Table 45 Market for Medical Industry, By Valve Design Type, 2013–2022 (USD Million)
Table 46 Market for Other Industries, By Region, 2013–2022 (USD Million)
Table 47 Market for Other Industries, By Region, 2013–2022 (Thousand Units)
Table 48 Market for Others Industry, By Valve Design, 2013–2022 (USD Million)
Table 49 Market, By Region, 2013–2022 (USD Million)
Table 50 Market, By Region, 2013–2022 (Million Units)
Table 51 Market in Americas, By Region, 2013–2022 (USD Million)
Table 52 Market in North America, By Country, 2013–2022 (USD Million)
Table 53 Market in Americas, By Industry, 2013–2022 (USD Million)
Table 54 Market in Americas, By Industry, 2013–2022 (Thousand Units)
Table 55 Market in Americas, By Body Material, 2013–2022 (USD Million)
Table 56 Market in Americas, By Body Material, 2013–2022 (Thousand Units)
Table 57 Market in Europe, By Country, 2013–2022 (USD Million)
Table 58 Market in Europe, By Industry, 2013–2022 (USD Million)
Table 59 Market in Europe, By Industry, 2013–2022 (Thousand Units)
Table 60 Market in Europe, By Body Material, 2013–2022 (USD Million)
Table 61 Market in Europe, By Body Material, 2013–2022 (Thousand Units)
Table 62 Market in APAC, By Country, 2013–2022 (USD Million)
Table 63 Market in APAC, By Industry, 2013–2022 (USD Million)
Table 64 Market in APAC, By Industry, 2013–2022 (Thousand Units)
Table 65 Market in APAC, By Body Material, 2013–2022 (USD Million)
Table 66 Market in APAC, By Body Material, 2013–2022 (Thousand Units)
Table 67 Market in RoW, By Region, 2013–2022 (USD Million)
Table 68 Market in RoW, By Industry, 2013–2022 (USD Million)
Table 69 Market in RoW, By Industry, 2013–2022 (Thousand Units)
Table 70 Market in RoW, By Body Material, 2013–2022 (USD Million)
Table 71 Market in RoW, By Body Material, 2013–2022 (Thousand Units)
Table 72 Market Ranking of the Top 5 Players in the Solenoid Valve Market in 2015
Table 73 New Product Launches, 2014–2015
Table 74 Contracts, Agreements & Partnerships, 2014–2015
List of Figures (96 Figures)
Figure 1 Overview of the Micromarkets Covered
Figure 2 Market: Research Design
Figure 3 Market Size Estimation Methodology: Bottom-Up Approach
Figure 4 Market Size Estimation Methodology: Top-Down Approach
Figure 5 Data Triangulation
Figure 6 Market, 2013–2022 (In Terms of Value and Volume)
Figure 7 Market for the Chemical & Petrochemical Industry Expected to Witness the Largest Market Size During the Forecast Period
Figure 8 Solenoid Valves With Brass Body Material Expected to Hold the Largest Market Size Between 2016 and 2022
Figure 9 Solenoid Valves With Brass Body Material Expected to Hold the Largest Market Size Between 2016 and 2022
Figure 10 3-Way Design Solenoid Valves Expected to Grow at the Highest Rate During the Forecast Period
Figure 11 Solenoid Valve Market, By Region, 2015
Figure 12 Increasing Adoption of Solenoid Valves for Water & Wastewater Treatment Industry Expected to Drive the Market During the Forecast Period
Figure 13 The Chemical & Petrochemical Industry Expected to Dominate the Solenoid Valve Market in 2016
Figure 14 The Chemical & Petrochemical Industry Expected to Dominate the Solenoid Valve Market in the APAC Region in 2015
Figure 15 The Market in the APAC Region Experienced the Growth Phase in 2015
Figure 16 Market Dynamics: Overview
Figure 17 Global Renewable Energy Capacity (Installed)
Figure 18 Major Value Added During the Manufacturing and Assembly Phases
Figure 19 The Porter’s Five Forces Analysis (2015)
Figure 20 Market: Porter’s Five Forces Analysis
Figure 21 Intensity of Competitive Rivalry: Medium Competition in the Market Owing to the Presence of Well-Established Players
Figure 22 Threat of Substitutes Would Be Medium Due to the Buyers Propensity to Substitute
Figure 23 Bargaining Power of Buyers Expected to Be Medium Owing to the Availability of Wide Range of Solenoid Valves in the Market
Figure 24 Bargaining Power of Suppliers Expected to Be Low Due to the Presence of Substantial Players
Figure 25 New Entrants Less Likely to Enter This Market Owing to the Retaliation From Already Existing Firms
Figure 26 Strategic Benchmarking: Key Players Largely Adopted Organic Growth Strategies for New Product and Technology Development
Figure 27 Operating Principles of Solenoid Valves
Figure 28 Market, By Body Material
Figure 29 Brass Body Material Expected to Hold the Largest Size of the Solenoid Valve Market During the Forecast Period
Figure 30 Americas Expected to Hold the Largest Market Size for the Stainless Steel Solenoid Body Material Market During the Forecast Period
Figure 31 APAC Expected to Grow at the Highest Rate in the Brass Solenoid Body Material Market During the Forecast Period
Figure 32 APAC Expected to Grow at the Highest Rate in the Brass Solenoid Body Material Market During the Forecast Period
Figure 33 Rest of the World Expected to Witness the Highest Growth Rate for Plastic Solenoid Valves Market During the Forecast Period
Figure 34 Market, By Valve Design Type
Figure 35 2-Way Solenoid Valves Expected to Hold the Largest Market Size During the Forecast Period
Figure 36 Chemical & Petrochemical Industry Expected to Hold the Largest Size of the 2-Way Solenoid Valve Design Between 2016 and 2022
Figure 37 Water & Wastewater Industry Expected to Grow at the Highest Rate in the 3-Way Solenoid Valve Design Market During the Forecast Period
Figure 38 Oil & Gas Industry Expected to Hold the Largest Size in the 4-Way Solenoid Design Valves Market Between 2016 and 2022
Figure 39 Food & Beverages Industry Expected to Hold the Largest Size in the 5-Way Solenoid Design Valves Market During the Forecast Period
Figure 40 Market: By Industry
Figure 41 Market for the Chemical & Petrochemical Industry is Expected to Hold the Largest Market Size During the Forecast Period
Figure 42 Americas Expected to Hold the Largest Market Size in the Oil & Gas Industry During the Forecast Period
Figure 43 2-Way Solenoid Valves are Expected to Hold the Largest Market Size in the Oil & Gas Industry During the Forecast Period
Figure 44 RoW Region Expected to Grow at the Highest Rate in the Chemical & Petrochemical Industry Between 2016 and 2022
Figure 45 3-Way Solenoid Valves are Expected to Grow at the Highest Rate in the Chemical & Petrochemical Industry During the Forecast Period
Figure 46 Market in APAC Expected to Grow at the Highest Rate in the Water & Wastewater Industry During the Forecast Period
Figure 47 2-Way Solenoid Valves Expected to Hold the Largest Market Size in the Water & Wastewater Industry Between 2016 and 2022
Figure 48 Americas Expected to Hold the Largest Market in the Food & Beverages Industry During the Forecast Period
Figure 49 3-Way Solenoid Valves are Expected to Witness the Highest Growth in the Food & Beverages Industry Between 2016 and 2022
Figure 50 APAC Region Expected to Grow at the Highest Rate in the Power Generation Industry During the Forecast Period
Figure 51 Market for the Chemical & Petrochemical Industry is Expected to Hold the Largest Size During the Forecast Period
Figure 52 Market in APAC Region Expected to Witness the Highest Growth Rate in the Pharmaceutical Industry Between 2016 and 2022
Figure 53 3-Way Solenoid Valves are Expected to Grow at A Highest CAGR in the Pharmaceuticals Industry During the Forecast Period
Figure 54 Europe Expected to Hold the Largest Market Size in the Automotive Industry Between 2016 and 2022
Figure 55 2-Way Solenoid Valves are Expected to Hold the Largest Size in the Automotive Industry Between 2016 and 2022
Figure 56 Europe Expected to Hold the Largest Market Size of the Medical Industry During the Forecast Period
Figure 57 2-Way Solenoid Valves Expected to Hold the Largest Market Size in the Medical Industry Between 2016 and 2022
Figure 58 Americas Expected to Hold the Largest Market Size in the Other Industries During the Forecast Period
Figure 59 2-Way Solenoid Valves are Expected to Hold the Largest Market Size of the Other Industries During the Forecast Period
Figure 60 Solenoid Valve Market, By Region
Figure 61 Americas Expected to Dominate the Solenoid Valve Market During the Forecast Period
Figure 62 Americas: Solenoid Valve Market Snapshot
Figure 63 The Market in the Americas
Figure 64 The Market in the U.S. Expected to Hold the Largest Size During the Forecast Period
Figure 65 Water & Wastewater Industry Expected to Dominate the Solenoid Valve Market in the Americas Between 2016 and 2022
Figure 66 Brass Solenoid Valves Expected to Hold the Largest Market in the Solenoid Valve Market in the Americas During the Forecast Period
Figure 67 Europe: Solenoid Valve Market Snapshot
Figure 68 The Market in Europe
Figure 69 Germany Expected to Hold the Major Market for Solenoid Valves in Europe Between 2016 and 2022
Figure 70 Automotive Industry Expected to Hold the Major Market for Solenoid Valves in Europe Between 2016 and 2022
Figure 71 Brass Solenoid Valves Expected to Hold the Major Market for Solenoid Valves in Europe Between 2016 and 2022
Figure 72 APAC: Solenoid Valve Market Snapshot
Figure 73 The Market in Asia-Pacific
Figure 74 India Expected to Witness the Highest Growth Rate in the Solenoid Valve Market in the APAC Region Between 2016 and 2022
Figure 75 Water & Wastewater Industry Expected to Witness the Highest Growth Rate in the Market in the APAC Region Between 2016 and 2022
Figure 76 Brass Solenoid Valves Expected to Hold the Largest Market of the Market in APAC Between 2016 and 2022
Figure 77 The Markets in the RoW
Figure 78 Middle East to Hold the Largest Market for Solenoid Valves in RoW During the Forecast Period
Figure 79 Middle East to Hold the Largest Market for Solenoid Valves in RoW During the Forecast Period
Figure 80 Aluminum Solenoid Valves Expected to Grow at the Highest Rate in the Solenoid Valves Market in RoW During the Forecast Period
Figure 81 Key Growth Strategies Adopted By the Top Companies Between 2013 and 2015
Figure 82 Market Evaluation Framework: New Product Launches Fuelled the Growth and Innovation Between 2013 and 2015
Figure 83 Battle for Market Share: New Product Launches Was the Key Strategy
Figure 84 Geographic Revenue Mix of Major Players in the Market
Figure 85 Asco Valve, Inc.: SWOT Analysis
Figure 86 Christian Bürkert GmbH & Co. Kg: SWOT Analysis
Figure 87 Curtiss-Wright Corporation: Company Snapshot
Figure 88 Danfoss A/S: Company Snapshot
Figure 89 Danfoss A/S: SWOT Analysis
Figure 90 IMI PLC: Company Snapshot
Figure 91 IMI PLC: SWOT Analysis
Figure 92 Parker Hannifin Corporation: Company Snapshot
Figure 93 Parker Hannifin Corporation: SWOT Analysis
Figure 94 SMC Corporation: Company Snapshot
Figure 95 Marketsandmarkets Knowledge Store Snapshot
Figure 96 Marketsandmarkets Knowledge Store: Semiconductor & Electronics Industry Snapshot
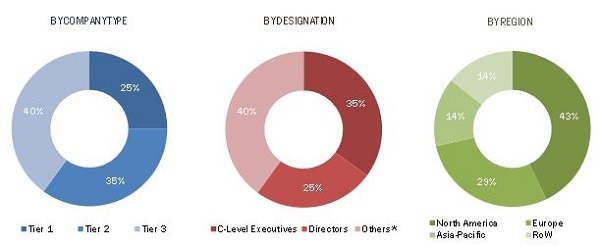
The research methodology used to estimate and forecast the solenoid valve market begins with gathering data on key vendor revenues through secondary research. The top-down and bottom-up approaches have been used to estimate and validate the size of the global market. The research methodology also includes the study of annual and financial reports of the top market players as well as interviews of industry experts (such as CEOs, VPs, directors, and marketing executives) for key insights (both, quantitative and qualitative) on the market. All percentage shares, splits, and breakdowns have been determined by using secondary sources and verified through primary sources. The data triangulation and market breakdown procedures have been employed to complete the overall market engineering process and arrive at the exact statistics for all segments and subsegments. The breakdown of profiles of primary is depicted in the following figure.
The solenoid valve ecosystem comprises valve manufacturers such as ASCO Valve, Inc. (U.S.), Christian Bürkert GmbH & Co. KG (Germany), Curtiss-Wright Corporation (U.S.), Danfoss A/S (Denmark), GSR Ventiltechnik GmbH & Co. KG (Germany) among others; component manufacturers such as CEME S.p.A. (Italy), CKD Corporation (Japan), ODE S.r.l. (Italy), KANEKO SANGYO Co., Ltd. (Japan), and Takasago Electric Industry Co., Ltd. (Japan) among others
The distributors include MAC Valves (U.S.), Applied Industrial Technologies (U.S.), Nison Consultants Pvt. Ltd. (India), and Yashima Export & Import Company (Japan) among others.
Target Audience of the Report:
The intended audience for this report includes:
- Solenoid valve equipment products and solutions providers
- Solenoid valve systems related service providers
- Research organizations and consulting companies
- Associations, organizations, forums, and alliances related to solenoid valve engineering
- Government bodies such as regulating authorities and policy makers
- Venture capitalists, private equity firms, and start-up companies
- End users who want to know more about the market
Scope of the Report:
This report categorizes the global solenoid valve market on the basis of body material, valve design, industry vertical, and geography.
By Body Material:
- Stainless Steel
- Brass
- Aluminium
- Plastic
By Valve Design Type:
- 2-way
- 3-way
- 4-way
- 5-way
By Industry:
- Oil & Gas
- Chemical & Petrochemical
- Water & Wastewater
- Food & Beverages
- Power Generation
- Pharmaceuticals
- Automotive
- Medical
- Others
By Region:
- Americas
- Europe
- Asia-Pacific (APAC)
- Rest of the World (RoW)
Available Customizations:
With the given market data, MarketsandMarkets offers customizations as per the company’s specific needs. The following customization options are available for the report:
Market Analysis
- Further breakdown of the global solenoid valves market, by geography
Company Information
- Detailed analysis and profiling of additional market players (up to five)













Growth opportunities and latent adjacency in Solenoid Valve Market
Dose report includes further segmentation of each industry into sub-application. Also what can be provides on solenoid actuators?