Solid State Drives Market by Form Factor (2.5”, 3.5”, M.2, U.2/SFF 8639, FHHL/HHHL), Interface (SATA, SAS, PCIe), Technology (SLC, MLC, TLC), End-user (Enterprise, Client, Industrial, Automotive), and Geography - Global Forecast to 2036


 Exclusive indicates content/data unique to MarketsandMarkets and not available with any competitors.
Table of Content
1 Introduction
1.1 Objectives of the study
1.2 Market definition
1.3 Study scope
1.3.1 Market Scope
1.3.2 Years considered for the study
1.4 Currency
1.5 Limitations
1.6 Stakeholders
2 Research Methodology
2.1 Research Data
2.1.1 Secondary Data
2.1.1.1 Key data from secondary sources
2.1.2 Primary data
2.1.2.1 Key data from primary sources
2.1.2.2 Key industry insights
2.1.2.3 Breakdown of primary interviews
2.2 Market size estimation
2.3 Data triangulation
2.4 Assumptions
3 Executive Summary
4 Premium Insights
5 Market Overview
5.1 Introduction
5.2 Market Dynamics
5.2.1 Drivers
5.2.2 Restraints
5.2.3 Opportunities
5.2.4 Challenges
6 Industry Trends
6.1 Market Evolution
6.2 Value Chain Analysis
7 Market by Interface
7.1 Introduction
7.2 SATA
7.3 SAS
7.4 PCIe
8 Market by Form Factor
8.1 Introduction
8.2 1.8”/2.5”
8.3 3.5”
8.4 M.2
8.5 U.2 (SFF 8639)
8.6 FHHL and HHHL
9 Market by Technology
9.1 Introduction
9.2 SLC
9.3 MLC Planar
9.4 MLC 3D
9.5 TLC Planar
9.6 TLC 3D
10 Storage
10.1 Under 500 GB
10.2 500 GB–1 TB
10.3 1 TB – 2 TB
10.4 Above 2 TB
11 Market by End-User
11.1 Introduction
11.2 Enterprise
11.2.1 Server attached
11.2.2 Storage attached
11.3 Client
11.3.1 Desktop PC
11.3.2 Notebook
11.3.3 Tablet
11.3.4 Others
11.4 Industrial
11.5 Automotive
12 Geographic Analysis
12.1 Introduction
12.2 North America
12.2.1 US
12.2.2 Canada
12.2.3 Mexico
12.3 Europe
12.3.1 Germany
12.3.2 UK
12.3.3 France
12.3.4 Rest of Europe
12.4 APAC
12.4.1 China
12.4.2 Taiwan
12.4.3 South Korea
12.4.4 India
12.4.5 Rest of APAC
12.5 Rest of the World
12.5.1 Africa
12.5.2 Latin America
12.5.3 Middle East
13 Competitive Landscape
13.1 Overview
13.2 Market Ranking (Key Player Analysis)
13.3 Competitive Situation & Trends
13.3.1 New Product Launches
13.3.2 Agreements & Collaborations
13.3.3 Mergers & Acquisitions
13.4 Competitive Leadership Mapping
13.4.1 Visionary Leaders
13.4.2 Dynamic Differentiators
13.4.3 Innovators
13.4.4 Emerging Companies
14 Company Profiles
14.1 Key Companies
14.1.1 Samsung
14.1.2 Intel
14.1.3 Western Digital
14.1.4 Micron
14.1.5 Toshiba
14.1.6 Seagate
14.1.7 Microsemi
14.1.8 Lite-On
14.1.9 SK Hynix
14.1.10 Kingston
14.2 Other Key Companies
14.2.1 Viking
14.2.2 Adata
14.2.3 Bitmicro Networks
14.2.4 Mushkin
14.2.5 NetApp
14.2.6 Lexar Media
14.2.7 Crossbar
14.2.8 G.Skill
14.2.9 Violin Memory
14.2.10 Corsair Components
15 Appendix
List of Tables (108 Tables)
Table 1 Differentiation Between SSD and HDD
Table 2 Solid State Drives Market, By Form Factor, 2015–2023, (USD Billion)
Table 3 Market, By Form Factor, 2015–2023 (Thousand Units)
Table 4 Market for 1.8"/2.5”, By Interface, 2015–2023 (USD Million)
Table 5 Market for 1.8"/2.5”, By Region, 2015–2023 (USD Million)
Table 6 Market for 1.8"/2.5”, By Region, 2015–2023 (Million Units)
Table 7 Market for 3.5”, By Interface, 2015–2023 (USD Million)
Table 8 3.5” Solid State Drive Market, By Region, 2015–2023 (USD Million)
Table 9 Market for 3.5”, By Region, 2015–2023 (Thousand Units)
Table 10 Market for M.2/Msata, By Interface, 2015–2023 (USD Million)
Table 11 Market for M.2/Msata, By Region, 2015–2023 (USD Million)
Table 12 Market for M.2/Msata, By Region, 2015–2023 (Million Units)
Table 13 Market for U.2 (SFF 8639), By Interface, 2015–2023 (USD Million)
Table 14 Market for U.2 (SFF 8639), By Region, 2015–2023 (USD Million)
Table 15 Market for U.2 (SFF 8639), By Region, 2015–2023 (Thousand Units)
Table 16 Market for FHHL and HHHL, By Interface, 2015–2023 (USD Million)
Table 17 Market for FHHL and HHHL, By Region, 2015–2023 (USD Million)
Table 18 Market for FHHL and HHHL, By Region, 2015–2023 (Thousand Units)
Table 19 Market, By Interface, 2015–2023 (USD Billion)
Table 20 Market, By Interface, 2015–2023 (Million Units)
Table 21 Market for SATA, By End User, 2015–2023 (USD Million)
Table 22 Market for SATA, By End User, 2015–2023 (Million Units)
Table 23 Market for SATA, By Region, 2015–2023 (USD Million)
Table 24 SATA Solid State Drive Market, By Form Factor, 2015-2023 (USD Million)
Table 25 Market for SAS, By Region, 2015–2023 (USD Million)
Table 26 SAS Solid State Drive Market, By Form Factor, 2015-2023 (USD Million)
Table 27 Market for PCIE, By End User, 2015–2023 (USD Million)
Table 28 Market for PCIE, By End User, 2015–2023 (Thousand Units)
Table 29 Market for PCIE, By Region, 2015–2023 (USD Million)
Table 30 Solid State Drive Market, By Form Factor, 2015-2023 (USD Million)
Table 31 Market, By Technology, 2015–2023 (USD Billion)
Table 32 Market, By Technology, 2015–2023 (Million Units)
Table 33 TLC Planar vs TLC 3D Comparison
Table 34 Solid State Drive Market, By Storage, 2015–2023 (USD Million)
Table 35 Market, By End-User, 2015–2023 (USD Million)
Table 36 Market, By End-User, 2015–2023 (Million Units)
Table 37 Enterprise Solid State Drive Market, By Application, (USD Million)
Table 38 Enterprise Market, By Region, 2015–2023 (USD Million)
Table 39 Enterprise Market, By Interface, 2015–2023 (USD Million)
Table 40 Enterprise Market, By Interface, 2015–2023 (Million Units)
Table 41 Client Solid State Drive Market, By Application (USD Million)
Table 42 Client Market, By Region, 2015–2023 (USD Million)
Table 43 Client Market, By Interface, 2015–2023 (USD Million)
Table 44 Client Market, By Interface, 2015–2023 (Million Units)
Table 45 Industrial Solid State Drive Market, By Region, 2015–2023 (USD Million)
Table 46 Industrial Market, By Interface, 2015–2023 (USD Million)
Table 47 Industrial Market, By Interface, 2015–2023 (Million Units)
Table 48 Automotive Solid State Drive Market, By Region, 2015–2023 (USD Million)
Table 49 Automotive Market, By Interface, 2015–2023 (USD Million)
Table 50 Automotive Market, By Interface, 2015–2023 (Thousand Units)
Table 51 Market, By Region, 2015–2023 (USD Billion)
Table 52 Market, By Region, 2015–2023 (Million Units)
Table 53 Market in North America, By Country, 2015–2023 (USD Million)
Table 54 Market in North America, By Form Factor, 2015–2023 (USD Million)
Table 55 Market in North America, By Form Factor, 2015–2023, (Thousand Units)
Table 56 Market in North America, By Interface, 2015–2023, (USD Million)
Table 57 Market in North America, By End User, 2015–2023 (USD Million)
Table 58 Market for Enterprise in North America, By Country, 2015–2023 (USD Million)
Table 59 Market for Client in North America, By Country, 2015–2023 (USD Million)
Table 60 Market for Industrial in North America, By Country, 2015–2023 (USD Million)
Table 61 Market for Automotive in North America, By Country, 2015–2023 (USD Million)
Table 62 Market in US, By End User, 2015–2023 (USD Million)
Table 63 Market in Canada, By End User, 2015–2023 (USD Million)
Table 64 Market in Mexico, By End User, 2015–2023 (USD Million)
Table 65 Market in Europe, By Country, 2015–2023 (USD Million)
Table 66 Market in Europe, By Form Factor, 2015–2023, (USD Million)
Table 67 Market in Europe, By Form Factor, 2015–2023, (Thousand Units)
Table 68 Market in Europe, By Interface, 2015–2023, (USD Million)
Table 69 Market in Europe, By End-User, 2015–2023 (USD Million)
Table 70 Market for Enterprise in Europe, By Country, 2015–2023 (USD Million)
Table 71 Market for Client in Europe, By Country, 2015–2023 (USD Million)
Table 72 Market for Industrial in Europe, By Country, 2015–2023 (USD Million)
Table 73 Market for Automotive in Europe, By Country, 2015–2023 (USD Million)
Table 74 Market in UK, By End User, 2015–2023 (USD Million)
Table 75 Market in Germany, By End User, 2015–2023 (USD Million)
Table 76 Market in France, By End User, 2015–2023 (USD Million)
Table 77 Market in Rest of Europe, By End User, 2015–2023 (USD Million)
Table 78 Market in APAC, By Country, 2015–2023 (USD Million)
Table 79 Market in APAC, By Form Factor, 2015–2023, (USD Million)
Table 80 Solid State Drive Market in APAC, By Form Factor, 2015–2023, (Thousand Units)
Table 81 Market in APAC, By Interface, 2015–2023, (USD Million)
Table 82 Market in APAC, By End-User, 2015–2023 (USD Million)
Table 83 Market for Enterprise in APAC, By Country, 2015–2023 (USD Million)
Table 84 Market for Client in APAC, By Country, 2015–2023 (USD Million)
Table 85 Market for Industrial in APAC, By Country, 2015–2023 (USD Million)
Table 86 Market for Automotive in APAC, By Country, 2015–2023 (USD Million)
Table 87 Market in China, By End User, 2015–2023 (USD Million)
Table 88 Market in India, By End User, 2015–2023 (USD Million)
Table 89 Market in Taiwan, By End User, 2015–2023 (USD Million)
Table 90 Market in South Korea, By End User, 2015–2023 (USD Million)
Table 91 Market in Rest of APAC, By End User, 2015–2023 (USD Million)
Table 92 Market in RoW, By Geography, 2015–2023 (USD Million)
Table 93 Market in RoW, By Form Factor, 2015–2023, (USD Million)
Table 94 Market in RoW, By Form Factor, 2015–2023, (Thousand Units)
Table 95 Market in RoW, By Interface, 2015–2023, (USD Million)
Table 96 Market in RoW, By End-User, 2015–2023 (USD Million)
Table 97 Market for Enterprise in RoW, By Region, 2015–2023 (USD Million)
Table 98 Market for Client in RoW, By Region, 2015–2023 (USD Million)
Table 99 Market for Industrial in RoW, By Region, 2015–2023 (USD Million)
Table 100 Market for Automotive in RoW, By Region, 2015–2023 (USD Million)
Table 101 Market in Africa, By End User, 2015–2023 (USD Million)
Table 102 Market in Latin America, By End User, 2015–2023 (USD Million)
Table 103 Market in Middle East, By End User, 2015–2023 (USD Million)
Table 104 Market Share Analysis of the Players in the Solid State Drives Market in 2016
Table 105 Product Launches, 2016 – 2017
Table 106 Partnerships, Agreements, and Collaborations, 2015–2017
Table 107 Acquisitions, 2014–2016
Table 108 Investments and Expansions, 2016–2017
List of Figures (46 Figures)
Figure 1 Solid State Drives Market Segmentation
Figure 2 Research Flow
Figure 3 Solid State Drive Market: Research Design
Figure 4 Market Size Estimation: Bottom-Up Approach
Figure 5 Market Size Estimation: Top-Down Approach
Figure 6 Data Triangulation
Figure 7 Solid State Drive Market for PCIE Interface SSD Expected to Grow at the Highest CAGR Between 2017 and 2023
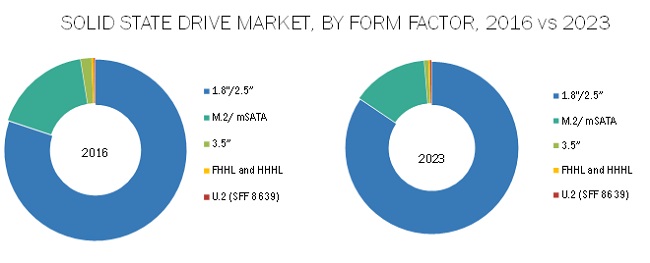
Figure 8 The Market for “1.8/2.5” Form Factors is Expected to Hold the Largest Share During the Forecast Period
Figure 9 Market for TLC 3D is Expected to Grow at the Highest CAGR During the Forecast Period
Figure 10 SSD Market for Automotive Expected to Grow at the Highest CAGR During the Forecast Period
Figure 11 North America Accounted for the Largest Market Share in 2016
Figure 12 SSD Market to Provide Attractive Growth Opportunities During the Forecast Period
Figure 13 Market PCIE Interface in Automotive Industry is Expected to Grow at the Highest CAGR During the Forecast Period
Figure 14 Enterprise Industry Held the Largest Market Share of the Market in APAC in 2016
Figure 15 SSD Market in China Expected to Grow at the Highest CAGR During the Forecast Period
Figure 16 Solid State Drives Market in China Expected to Grow at the Highest CAGR During the Forecast Period
Figure 17 Increasing Penetration of High-End Cloud Computing and the Growing Adoption of SSDS in Data Center are Driving the Growth of the Market
Figure 18 Data Center Traffic
Figure 19 Evolution of Market
Figure 20 Value Chain: Market, 2016
Figure 21 Market for FHHL and HHHL Form Factor is Expected to Grow at the Highest CAGR During the Forecast Period
Figure 22 SSD Market for 1.8"/2.5” in APAC is Expected to Grow at the Highest CAGR During the Forecast Period
Figure 23 SSD Market for M.2 in APAC is Expected to Grow at the Highest CAGR During the Forecast Period
Figure 24 SSD Market for PCIE Interface is Expected to Grow at the Highest CAGR During the Forecast Period
Figure 25 Market for SATA in Automotive is Expected to Grow at the Highest CAGR During the Forecast Period
Figure 26 Solid State Drives Market for TLC 3D is Expected to Grow at the Highest CAGR During the Forecast Period
Figure 27 SSD Market for the Automotive Expected to Grow at the Highest CAGR During the Forecast Period
Figure 28 Enterprise SSD Market for Storage-Attached Application is Expected to Grow at the Highest CAGR During the Forecast Period
Figure 29 Client Market for Tablets is Expected to Grow at the Highest CAGR During the Forecast Period
Figure 30 Industrial SSD Market in APAC is Expected to Grow at the Highest CAGR During the Forecast Period
Figure 31 Automotive SSD Market for PCIE Interface is Expected to Grow at the Highest CAGR During the Forecast Period
Figure 32 Geographic Snapshot: Rapidly Growing Countries Such as Taiwan and China Emerging as High-Potential Markets (2017–2023)
Figure 33 Market in APAC Estimated to Grow at the Highest CAGR Between 2017 and 2023
Figure 34 North America: Solid State Drive Market Snapshot
Figure 35 Europe: Market Snapshot
Figure 36 APAC: Market Snapshot
Figure 37 Companies Adopted Product Launch as the Key Growth Strategy Over the Last 4 Years (2014– August 2017)
Figure 38 Samsung: Company Snapshot
Figure 39 Intel: Company Snapshot
Figure 40 Western Digital: Company Snapshot
Figure 41 Micron: Company Snapshot
Figure 42 Toshiba: Company Snapshot
Figure 43 Seagate: Company Snapshot
Figure 44 Microsemi: Company Snapshot
Figure 45 Lite-On: Company Snapshot
Figure 46 SK Hynix: Company Snapshot
With the increasing adoption of SSDs, security is becoming a major concern. Ideally, hardware-based encryption is preferred over software-based encryption as software encryption is more vulnerable to crashes. At the same time, the improper designing of hardware-based encryption may hinder the overall performance. Advanced SSD controllers coordinate with various encryption standards such as ATA, TCG’s Opal/Enterprise, IEEE 1667, and others to improve the design. Therefore, overcoming design problems of SSDs is a challenge for the solid state drives market.
Scope of the Report
|
Report Metric |
Details |
|
Market size available for years |
2015-2023 |
|
Base year considered |
2016 |
|
Forecast period |
2017-2023 |
|
Forecast units |
Value (USD) in million |
|
Segments covered |
Interface, form factor, technology, storage, end-user, and region |
|
Geographies covered |
North America, APAC, Europe, and RoW |
|
Companies covered |
Samsung (South Korea), Intel (US), Western Digital (US), Micron (US), Toshiba (Japan), Kingston (US), Lite-On (Taiwan), Seagate (Ireland), SK hynix (South Korea), Microsemi (US), Viking (US), Adata (Taiwan), Bitmicro Networks (US), Mushkin (US), NetApp (US), Lexar Media (US), Crossbar (US), G.Skill (Taiwan), Violin Memory (US), Corsair Components (US). |
This research report categorizes the solid state drives market based on interface, form factor, technology, storage, end-user, and region.
Solid State Drives Market, by interface
- SATA
- SAS
- PCIe
Solid State Drives Market, by Form Factor
- 1.8”/2.5”
- 3.5”
- M.2
- U.2 (SFF 8639)
- FHHL and HHHL
Solid State Drives Market, by Technology
- SLC
- MLC Planar
- MLC 3D
- TLC Planar
- TLC 3D
SSD Market, by Storage:
- Under 500 GB
- 500 GB–1 TB
- 1 TB – 2 TB
- Above 2 TB
SSD Market, by End-User:
- Enterprise
- Client
- Industrial
- Automotive
SSD Market, by Geography
- North America
- Europe
- Asia Pacific (APAC)
- Rest of the World (RoW)
Key Market Players:
Key players in the solid state drives market include Samsung (South Korea), Intel (US), Western Digital (US), Micron (US), Toshiba (Japan), Kingston (US), Lite-On (Taiwan), Seagate (Ireland), SK hynix (South Korea), Microsemi (US), Viking (US), Adata (Taiwan), Bitmicro Networks (US), Mushkin (US), NetApp (US), Lexar Media (US), Crossbar (US), G.Skill (Taiwan), Violin Memory (US), Corsair Components (US).
Samsung Electronics Co., Ltd. (South Korea) has been at the top position because of its wide contribution to the parent market share and high financial power. The company accounted for a share of around 38.87% of the solid state drive market in 2016. The company has a strong technical expertise and a broad product portfolio in the solid state drives market. The company is one of the leading global brands in the storage industry and has a wide geographic reach through various distribution networks. The company’s innovative offering, V-NAND, improves the latency in its SSD products. The Charge Trap Flash (CTF) technology prevents data corruption caused by cell-to-cell interference and also leads to improved speed, power efficiency, and endurance.
Recent Developments:
- In May 2018, Western Digital launched 3D NAND SATA SSD with 64-layer 3D NAND technology for high capacity and reduced cell–cell interference for enhanced reliability.
- In August 2017, Samsung launched Portable SSD T5, the latest 64-layer V-NAND technology, which delivers industry-leading transfer speed with encrypted data security.
- In August 2017, Micron expanded its manufacturing facility in Boise, Idaho, US. The investment in R&D is dedicated toward developing new semiconductor manufacturing processes and designs for the company's future memory and storage technologies.
Critical questions the report answers:
- Where will all the developments take the industry in the mid to long term?
- What are the emerging applications that are expected to drive the solid state drives market?
- What are the key strategies adopted by leading companies in the solid state drives market?
- What are the trends prevalent in the solid state drives market?
- What advanced technologies are expected to gain traction in the solid state drives market?
To speak to our analyst for a discussion on the above findings, click Speak to Analyst


Growth opportunities and latent adjacency in Solid State Drives Market