Sonobuoy Market by Technology (BT, SAR, DICASS, DLC, DIFAR, LOFAR, EER, ADAR, VLAD), Function (Active, Passive, Special Purpose), By Application (Defense, Commercial), Size (A, B, C), Deployment (Spring, Pneumatic, Free Fall, Cartridge) & Geography - Global Trends and Forecasts to 2020


The sonobuoy market is estimated to be valued at USD 226.11 Million in 2015 and is projected to reach USD 316.59 Million by 2020, at a CAGR of 6.96% during the forecast period from 2015 to 2020. This report covers the forecasts of the sonobuoy market and its dynamics over the next five years, while also recognizing the market application gaps, evolving technologies, recent developments in the market, and high potential geographic regions and countries.
The report includes the market dynamics, such as drivers, restraints, challenges, and opportunities, along with Porter’s Five Forces analysis and a life cycle analysis of this market. The market for these sonobuoy systems is driven by various factors, such as the increase in anti-submarine warfare, high efficiency and technological advancements, and increasing maritime issues in Asia-Pacific. Various opportunities for the sonobuoy market include the rising need for cost-effective ASW systems, growing market for unmanned underwater vehicles, and increase in defense expenditure for SONAR systems
The major players in the market include Sparton Corporation (U.S.) and Ultra Electronics (U.K.). Acquisitions, long-term supply contracts, and new product launches are some of the major strategies that are adopted by the market players in the global sonobuoy market.
-
Market Analysis
-
Market Analysis, by Type of Active Sonar
- High-frequency active sonar
- Mid-frequency active sonar
- Low-frequency sonar
-
Market Analysis, By Component
- Antenna
- Antenna cable
- Radio receiver
- Anti-alias filter
- A/D Converter and recording system
-
Market Analysis, by Type of Active Sonar
The sonobuoy market is estimated to be valued at USD 226.11 Million in 2015 and is projected to reach USD 316.59 Million by 2020, at a CAGR of 6.96% during the forecast period from 2015 to 2020. Factors, such as the increasing focus by countries on strengthening their Anti-Submarine Warfare (ASW) capabilities, increase in the efficiency of sonobuoys due to various technological advancements, and rise in maritime disputes in Asia-Pacific, are expected to drive the growth of the sonobuoy market.
The key applications considered for the market study are defense and civil, wherein the overall sonobuoy market is dominated by the defense segment. This segment is projected to grow at a comparatively higher CAGR during the forecast period of 2015 to 2020, primarily driven by the high demand for sonobuoys which form an integral part of anti-submarine warfare (ASW) which is a key area of importance due to the increasing maritime disputes and the development of stealthier submarines.
The segment comprising passive sonobuoys dominates the sonobuoy market, segmented based on function. This segment dominates the studied market, and is expected to continue its dominance over the next 5 years, primarily driven by the high demand for passive sonobuoys which are more effective in detection due to their ability to prevent the detection of a tracking aircraft by a submarine.
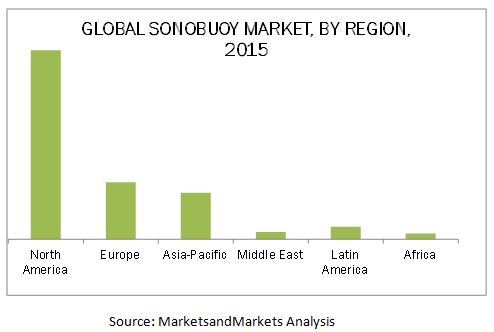
The APAC region is expected to exhibit the highest growth rate in the sonobuoy market, and is projected to grow at a CAGR of ~8% during the forecast period from 2015 to 2020. The growth of the sonobuoy market in this region can be attributed to the rise in maritime disputes and increased government spending by countries, such as China to strengthen their anti-submarine warfare capabilities.
Some of the factors such as limited capability of sonobuoys to detect increasingly stealthier submarines in littoral zones may limit the growth of this market.
The major players in the market include Sparton Corporation (U.S.) and Ultra Electronics (U.K.). Acquisitions, long term supply contracts, and new product launches are some of the major strategies adopted by the key players in the sonobuoy market. For instance, Sparton Corporation’s growth strategy has involved acquiring complementary businesses as well as entering into joint ventures and acquisitions. Moreover, Ultra Electronics has also entered into inorganic strategies partnerships and acquisitions in order to cater to various niche markets. These strategies have helped these companies maintain their leadership position in the market.
To speak to our analyst for a discussion on the above findings, click Speak to Analyst
 Exclusive indicates content/data unique to MarketsandMarkets and not available with any competitors.
Table of Contents
1 Introduction (Page No. - 22)
1.1 Objectives of the Study
1.2 Market Definition
1.3 Study Scope
1.3.1 Geographic Scope
1.3.2 Study Years
1.4 Currency & Pricing
1.5 Distribution Channel Participants
1.6 Study Limitations
1.7 Market Stakeholders
2 Research Methodology (Page No. - 25)
2.1 Research Data
2.1.1 Secondary Data
2.1.1.1 Key Data From Secondary Sources
2.1.2 Primary Data
2.1.2.1 Key Data From Primary Sources
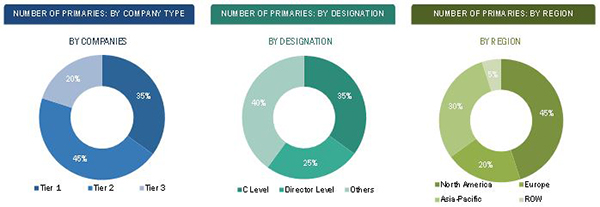
2.1.2.2 Breakdown of Primaries
2.2 Factor Analysis
2.2.1 Introduction
2.2.2 Demand-Side Analysis
2.2.2.1 Rise in Spending on Submarines By the Asia-Pacific Countries
2.2.2.2 Increase in Maritime Disputes
2.2.3 Supply-Side Analysis
2.2.3.1 Advancements in Technology
2.2.3.2 Development of Alternative Equipment Which Perform A Similar Function
2.3 Market Size Estimation
2.3.1 Bottom-Up Approach
2.3.2 Top-Down Approach
2.4 Market Breakdown and Data Triangulation
2.5 Research Assumtions & Limitations
2.5.1 Assumptions
2.5.2 Limitations
3 Executive Summary (Page No. - 34)
4 Premium Insights (Page No. - 37)
4.1 Attractive Market Opportunities in the Sonobuoy Market
4.2 Market, By Technology
4.3 Market, By Function
4.4 North America: Report, By Size
4.5 Report, By Application
4.6 Report, By Deployment
4.7 Report Share Analysis, By Region
4.8 Sonobuoy Life Cycle Analysis, By Region, 2014
5 Market Overview (Page No. - 42)
5.1 Introduction
5.2 Market Segmentation
5.2.1 Report, By Technology
5.2.2 Report, By Size
5.2.3 Report, By Deployment
5.2.4 Report, By Function
5.2.5 Report, By Application
5.2.6 Report, By Range
5.2.7 Report, By Geography
5.3 Market Dynamics
5.3.1 Drivers
5.3.1.1 Increased Focus By Countries on Strengthening Their Anti-Submarine Warfare Capabilities
5.3.1.2 Increase in the Efficiency of Sonobuoys Due to Various Technological Advancements
5.3.1.3 Rise in Maritime Disputes in Asia-Pacific
5.3.2 Restraints
5.3.2.1 Limited Capability to Detect Increasingly Stealthier Submarines in Littoral Zones
5.3.2.2 Impact of Sonobuoys on Marine Life
5.3.3 Opportunities
5.3.3.1 Rising Need for Cost-Effective Asw Systems
5.3.3.2 Growing Market of Unmanned Underwater Vehicles
5.3.3.3 Increase in Defense Expenditure on Sonar Systems
5.3.4 Challenges
5.3.4.1 Requirement for Rigorous Training of Operators
5.3.4.2 Environmental Regulations
6 Industry Trends (Page No. - 55)
6.1 Introduction
6.2 Value & Supply Chain Analysis
6.2.1 Key Influencers
6.3 Industry Trends
6.3.1 Application of Sonobuoy Technology in Robotics
6.3.2 Development of Light-Weight Passive Sonobuoys
6.3.3 Increasing Application of Mac
6.3.4 Development of Extended Life Sonobuoys
6.3.5 Development of Underwater Unmanned Vehicles (UUV)
6.3.6 Other Key Trends
6.4 Porter’s Five Forces Analysis
6.4.1 Threat of New Entrants
6.4.2 Threat of Substitutes
6.4.3 Bargaining Power of Suppliers
6.4.4 Bargaining Power of Buyers
6.4.5 Intensity of Competitive Rivalry
7 Sonobuoy Market, By Function (Page No. - 62)
7.1 Introduction
7.1.1 Sonobuoy Market, By Function, 2015-2020 (USD Million)
7.1.2 Sonobuoy Market, By Function, 2015-2020 (Units)
7.2 Active Sonobuoy
7.2.1 Cass Sonobuoys
7.2.2 Range Only (RO) Sonobuoy
7.2.3 Directional Command Activated Sonobuoy System (Dicass)
7.3 Passive Sonobuoy
7.3.1 Lofar System
7.3.2 Directional Frequency Analysis and Recording (DIFAR) Sonobuoy
7.4 Special Purpose Sonobuoy
7.4.1 Bathy Thermobuoy (BT)
7.4.2 Search and Rescue Buoy (SAR)
7.4.3 Air Transportable Communication and Downlink Communication Buoy (AT AC/DLC)
8 Sonobuoy Market, By Application Type (Page No. - 66)
8.1 Introduction
8.1.1 Report, By Application, 2013-2020, (USD Million)
8.1.2 Report, By Application, 2013-2020, (Unit)
8.2 Defense
8.3 Commercial
8.3.1 Environmental Research
8.3.2 Refraction Studies
9 Sonobuoy Market, By Technology (Page No. - 69)
9.1 Introduction
9.1.1 Report, By Technology, 2013-2020, (USD Million)
9.1.2 Report, By Technology, 2013-2020, (Unit)
9.2 Bathythermo Buoy
9.3 Directional Command Activated
9.4 Data Link Communications
9.5 Directional Frequency Analysis and Recording
9.6 Low Frequency Analysis and Recording
9.7 Extended Echo Ranging
9.8 Air Deployable Active Receiver
9.9 Vertical Line Array Directional Frequency Analysis and Recording
10 Sonobuoy Market, By Deployment (Page No. - 73)
10.1 Introduction
10.1.1 Report, By Deployment, 2013-2020, (USD Million)
10.1.2 Report, By Deployment, 2013-2020, (Units)
10.2 Spring
10.3 Pneumatic
10.4 Free-Fall
10.5 Cartridge
11 Sonobuoy Market, By Size (Page No. - 76)
11.1 Introduction
11.1.1 Report, By Size, 2013-2015, (USD Million)
11.1.2 Report, By Size, 2013-2015, (Unit)
11.2 A
11.3 B
11.4 C
11.5 Others
12 Sonobuoy Market, By Range (Page No. - 79)
12.1 Introduction
12.2 Short Range
12.3 Long Range
13 Sonobuoy Market, By Platform (Page No. - 80)
13.1 Introduction
13.2 Market, By Platform, 2013-2020 (USD Million)
13.3 North America
13.3.1 North America: Market, By Platform, 2013-2020 (USD Million)
13.3.2 U.S.
13.3.2.1 U.S.: Market, By Platform, 2013-2020 (USD Million)
13.4 Europe
13.4.1 Europe: Market, By Platform, 2013-2020 (USD Million)
13.4.2 U.K.
13.4.2.1 U.K.: Market, By Platform, 2013-2020 (USD Million)
13.4.3 Germany
13.4.3.1 Germany: Market, By Platform, 2013-2020 (USD Million)
13.4.4 France
13.4.4.1 France: Market, By Platform, 2013-2020 (USD Million)
13.4.5 Russia
13.4.5.1 Russia: Market, By Platform, 2013-2020 (USD Million)
13.5 Asia-Pacific
13.5.1 Asia-Pacific: Market, By Platform, 2013-2020 (USD Million)
13.5.2 China
13.5.2.1 China: Market, By Platform, 2013-2020 (USD Million)
13.5.3 India
13.5.3.1 India: Market, By Platform, 2013-2020 (USD Million)
13.5.4 Japan
13.5.4.1 Japan: Market, By Platform, 2013-2020 (USD Million)
13.5.5 Australia
13.5.5.1 Australia: Market, By Platform, 2013-2020 (USD Million)
14 Sonobuoy Market, By Geography (Page No. - 87)
14.1 North America
14.1.1 North America: Sonobuoy Market, By Technology, 2013-2020 (USD Million)
14.1.2 North America: Market, By Function, 2013-2020 (USD Million)
14.1.3 North America: Market, By Application, 2013-2020 (USD Million)
14.1.4 North America: Market, By Size, 2013-2020 (USD Million)
14.1.5 North America: Market, By Deployment, 2013-2020 (USD Million)
14.1.6 U.S.
14.1.6.1 U.S.: Sonobuoy Market, By Technology, 2013-2020 (USD Million)
14.1.6.2 U.S.: Market, By Function, 2013-2020 (USD Million)
14.1.6.3 U.S.: Market, By Application, 2013-2020 (USD Million)
14.1.6.4 U.S.: Market, By Size, 2013-2020 (USD Million)
14.1.6.5 U.S.: Market, By Deployment, 2013-2020 (USD Million)
14.2 Asia-Pacific
14.2.1 Asia-Pacific: Sonobuoy Market, By Technology, 2013-2020 (USD Million)
14.2.2 Asia-Pacific: Market, By Function, 2013-2020 (USD Million)
14.2.3 Asia-Pacific: Market, By Application, 2013-2020 (USD Million)
14.2.4 Asia-Pacific: Market, By Size, 2013-2020 (USD Million)
14.2.5 Asia-Pacific: Market, By Deployment, 2013-2020 (USD Million)
14.2.6 China
14.2.6.1 China: Sonobuoy Market, By Technology, 2013-2020 (USD Million)
14.2.6.2 China: Market, By Function, 2013-2020 (USD Million)
14.2.6.3 China: Market, By Application, 2013-2020 (USD Million)
14.2.6.4 China: Market, By Size, 2013-2020 (USD Million)
14.2.6.5 China: Market, By Deployment, 2013-2020 (USD Million)
14.2.7 India
14.2.7.1 India: Sonobuoy Market, By Technology, 2013-2020 (USD Million)
14.2.7.2 India: Market, By Function, 2013-2020 (USD Million)
14.2.7.3 India: Market, By Application, 2013-2020 (USD Million)
14.2.7.4 India: Market, By Size, 2013-2020 (USD Million)
14.2.7.5 India: Market, By Deployment, 2013-2020 (USD Million)
14.2.8 Japan
14.2.8.1 Japan: Sonobuoy Market, By Technology, 2013-2020 (USD Million)
14.2.8.2 Japan: Market, By Function, 2013-2020 (USD Million)
14.2.8.3 Japan: Market, By Application, 2013-2020 (USD Million)
14.2.8.4 Japan: Market, By Size, 2013-2020 (USD Million)
14.2.8.5 Japan: Market, By Deployment, 2013-2020 (USD Million)
14.2.9 Australia
14.2.9.1 Australia: Sonobuoy Market, By Technology, 2013-2020 (USD Million)
14.2.9.2 Australia: Market, By Function, 2013-2020 (USD Million)
14.2.9.3 Australia: Market, By Application, 2013-2020 (USD Million)
14.2.9.4 Australia: Market, By Size, 2013-2020 (USD Million)
14.2.9.5 Australia: Market, By Deployment, 2013-2020 (USD Million)
14.3 Europe
14.3.1 Europe: Sonobuoy Market, By Technology, 2013-2020 (USD Million)
14.3.2 Europe: Market, By Function, 2013-2020 (USD Million)
14.3.3 Europe: Market, By Application, 2013-2020 (USD Million)
14.3.4 Europe: Market, By Size, 2013-2020 (USD Million)
14.3.5 Europe: Market, By Deployment, 2013-2020 (USD Million)
14.3.6 U.K.
14.3.6.1 U.K.: Sonobuoy Market, By Technology, 2013-2020 (USD Million)
14.3.6.2 U.K.: Market, By Function, 2013-2020 (USD Million)
14.3.6.3 U.K.: Market, By Application, 2013-2020 (USD Million)
14.3.6.4 U.K.: Market, By Size, 2013-2020 (USD Million)
14.3.6.5 U.K.: Market, By Deployment, 2013-2020 (USD Million)
14.3.7 Germany
14.3.7.1 Germany: Sonobuoy Market, By Technology, 2013-2020 (USD Million)
14.3.7.2 Germany: Market, By Function, 2013-2020 (USD Million)
14.3.7.3 Germany: Market, By Application, 2013-2020 (USD Million)
14.3.7.4 Germany: Market, By Size, 2013-2020 (USD Million)
14.3.7.5 Germany: Market, By Deployment, 2013-2020 (USD Million)
14.3.8 France
14.3.8.1 France: Sonobuoy Market, By Technology, 2013-2020 (USD Million)
14.3.8.2 France: Market, By Function, 2013-2020 (USD Million)
14.3.8.3 France: Market, By Application, 2013-2020 (USD Million)
14.3.8.4 France: Market, By Size, 2013-2020 (USD Million)
14.3.8.5 France: Market, By Deployment, 2013-2020 (USD Million)
14.3.9 Russia
14.3.9.1 Russia: Sonobuoy Market, By Technology, 2013-2020 (USD Million)
14.3.9.2 Russia: Market, By Function, 2013-2020 (USD Million)
14.3.9.3 Russia: Market, By Application, 2013-2020 (USD Million)
14.3.9.4 Russia: Market, By Size, 2013-2020 (USD Million)
14.3.9.5 Russia: Market, By Deployment, 2013-2020 (USD Million)
14.4 Middle East
14.4.1 Middle East: Sonobuoy Market, By Technology
14.4.2 Middle East: Market, By Function
14.4.3 Middle East: Market, By Application
14.4.4 Middle East: Market, By Size
14.4.5 Middle East: Market, By Deployment
14.4.6 U.A.E.
14.4.6.1 U.A.E.: Sonobuoy Market, By Technology
14.4.6.2 U.A.E.: Market, By Function
14.4.6.3 U.A.E.: Market, By Application
14.4.6.4 U.A.E.: Market, By Size
14.4.6.5 U.A.E.: Market, By Deployment
14.4.7 Saudi Arabia
14.4.7.1 Saudi Arabia: Sonobuoy Market, By Technology
14.4.7.2 Saudi Arabia: Market, By Function
14.4.7.3 Saudi Arabia: Market, By Application
14.4.7.4 Saudi Arabia: Market, By Size
14.4.7.5 Saudi Arabia: Market, By Deployment
14.4.8 Israel
14.4.8.1 Israel: Sonobuoy Market, By Technology
14.4.8.2 Israel: Market, By Function
14.4.8.3 Israel: Market, By Application
14.4.8.4 Israel: Market, By Size
14.4.8.5 Israel: Market, By Deployment
14.5 Latin America
14.5.1 Latin America: Sonobuoy Market, By Function
14.5.2 Latin America: Market, By Technology
14.5.3 Latin America: Market, By Application
14.5.4 Latin America: Market, By Size
14.5.5 Latin America: Market, By Deployment
14.5.6 Brazil:
14.5.6.1 Brazil: Sonobuoy Market, By Function
14.5.6.2 Brazil: Market, By Technology
14.5.6.3 Brazil: Market, By Application
14.5.6.4 Brazil: Market, By Size
14.5.6.5 Brazil: Market, By Deployment
14.5.7 Argentina
14.5.7.1 Argentina: Sonobuoy Market, By Function
14.5.7.2 Argentina: Market, By Technology
14.5.7.3 Argentina: Market, By Application
14.5.7.4 Argentina: Market, By Size
14.5.7.5 Argentina: Market, By Deployment
14.6 Africa
14.6.1 Africa: Sonobuoy Market, By Function
14.6.2 Africa: Market, By Technology
14.6.3 Africa: Market, By Application
14.6.4 Africa: Market, By Size
14.6.5 Africa: Market, By Deployment
14.6.6 South Africa
14.6.6.1 South Africa: Market, By Function
14.6.6.2 South Africa: Market, By Technology
14.6.6.3 South Africa: Market, By Application
14.6.6.4 South Africa: Market, By Size
14.6.6.5 South Africa: Market, By Deployment
15 Competitive Landscape (Page No. - 188)
15.1 Overview
15.1.1 Sonobuoy Market
15.2 Market Share Analysis
15.2.1 Sonobuoy: Market Share Analysis
15.3 Competitive Scenario
15.3.1 Sonobuoy: Supply Contracts
15.3.2 Sonobuoy: New Product Launches
15.3.3 Sonobuoy: Acquisitions, Collaborations, Partnerships & Agreements
16 Company Profile (Page No. - 193)
(Overview, Financials, Products & Services, Strategy, and Developments)*
16.1 Sparton Corporation
16.2 Thales Group
16.3 Ultra Electronics Group
16.4 Sealandaire Technologies Inc.
16.5 Radixon Group
16.6 Lone Star Electronics Co.
16.7 General Dynamics Mission Systems
16.8 Sigma-Pi Power Sources Pvt Ltd.
*Details on Overview, Financials, Product & Services, Strategy, and Developments Might Not Be Captured in Case of Unlisted Companies.
17 Appendix (Page No. - 204)
17.1 Discussion Guide
17.2 Introducing RT: Real Time Market Intelligence
17.3 Available Customization
17.4 Related Reports
List of Tables (132 Tables)
Table 1 Sonobuoy Market, By Function, 2015-2020 (USD Million)
Table 2 Market, By Function, 2015-2020 (Units)
Table 3 Market, By Application, 2013-2020, (USD Million)
Table 4 Market, By Application, 2013-2020, (Unit)
Table 5 Market, By Technology, 2013-2020, (USD Million)
Table 6 Market, By Application, 2013-2020, (Unit)
Table 7 Market, By Deployment, 2013-2020, (USD Million)
Table 8 Market, By Deployment, 2013-2020, (Units)
Table 9 Market, By Size, 2013-2015, (USD Million)
Table 10 Market, By Size, 2013-2015, (Unit)
Table 11 Sonobuoy Market, By Platform, 2013-2020 (USD Million)
Table 12 North America: Market, By Platform, 2013-2020 (USD Million)
Table 13 U.S.: Market, By Platform, 2013-2020 (USD Million)
Table 14 Europe: Market, By Platform, 2013-2020 (USD Million)
Table 15 U.K.: Market, By Platform, 2013-2020 (USD Million)
Table 16 Germany: Market, By Platform, 2013-2020 (USD Million)
Table 17 France: Market, By Platform, 2013-2020 (USD Million)
Table 18 Russia: Market, By Platform, 2013-2020 (USD Million)
Table 19 Asia-Pacific: Market, By Platform, 2013-2020 (USD Million)
Table 20 China: Market, By Platform, 2013-2020 (USD Million)
Table 21 India: Market, By Platform, 2013-2020 (USD Million)
Table 22 Japan: Market, By Platform, 2013-2020 (USD Million)
Table 23 Australia: Market, By Platform, 2013-2020 (USD Million)
Table 24 Market, By Region, 2013-2020 (USD Million)
Table 25 North America: Market, By Technology, 2013-2020 (USD Million)
Table 26 North America: Market, By Platform, 2013-2020 (USD Million)
Table 27 North America: Market, By Application, 2013-2020 (USD Million)
Table 28 North America: Market, By Size, 2013-2020 (USD Million)
Table 29 North America: Market, By Deployment, 2013-2020 (USD Million)
Table 30 U.S.: Sonobuoy Market, By Technology, 2013-2020 (USD Million)
Table 31 U.S.: Market, By Function, 2013-2020 (USD Million)
Table 32 U.S.: Market, By Application, 2013-2020 (USD Million)
Table 33 U.S.: Market, By Size, 2013-2020 (USD Million)
Table 34 U.S.: Market, By Deployment, 2013-2020 (USD Million)
Table 35 Asia-Pacific: Sonobuoy Market, By Technology, 2013-2020 (USD Million)
Table 36 Asia-Pacific: Market, By Function, 2013-2020 (USD Million)
Table 37 Asia-Pacific: Market, By Application, 2013-2020 (USD Million)
Table 38 Asia-Pacific: Market, By Size, 2013-2020 (USD Million)
Table 39 Asia-Pacific: Market, By Deployment, 2013-2020 (USD Million)
Table 40 China: Sonobuoy Market, By Technology, 2013-2020 (USD Million)
Table 41 China: Market, By Function, 2013-2020 (USD Million)
Table 42 China: Market, By Application, 2013-2020 (USD Million)
Table 43 China: Market, By Size, 2013-2020 (USD Million)
Table 44 China: Market, By Deployment, 2013-2020 (USD Million)
Table 45 India: Sonobuoy Market, By Technology, 2013-2020 (USD Million)
Table 46 India: Market, By Function, 2013-2020 (USD Million)
Table 47 India: Market, By Application, 2013-2020 (USD Million)
Table 48 India: Market, By Size, 2013-2020 (USD Million)
Table 49 India: Market, By Deployment, 2013-2020 (USD Million)
Table 50 Japan: Sonobuoy Market, By Technology, 2013-2020 (USD Million)
Table 51 Japan: Market, By Function, 2013-2020 (USD Million)
Table 52 Japan: Market, By Application, 2013-2020 (USD Million)
Table 53 Japan: Market, By Size, 2013-2020 (USD Million)
Table 54 Japan: Market, By Deployment, 2013-2020 (USD Million)
Table 55 Australia: Sonobuoy Market, By Technology, 2013-2020 (USD Million)
Table 56 Australia: Market, By Function, 2013-2020 (USD Million)
Table 57 Australia: Market, By Application, 2013-2020 (USD Million)
Table 58 Australia: Market, By Size, 2013-2020 (USD Million)
Table 59 Australia: Market, By Deployment, 2013-2020 (USD Million)
Table 60 Europe: Sonobuoy Market, By Technology, 2013-2020 (USD Million)
Table 61 Europe: Market, By Function, 2013-2020 (USD Million)
Table 62 Europe: Market, By Application, 2013-2020 (USD Million)
Table 63 Europe: Market, By Size, 2013-2020 (USD Million)
Table 64 Europe: Market, By Deployment, 2013-2020 (USD Million)
Table 65 U.K.: Sonobuoy Market, By Technology, 2013-2020 (USD Million)
Table 66 U.K.: Market, By Function, 2013-2020 (USD Million)
Table 67 U.K.: Market, By Application, 2013-2020 (USD Million)
Table 68 U.K.: Market, By Size, 2013-2020 (USD Million)
Table 69 U.K.: Market, By Deployment, 2013-2020 (USD Million)
Table 70 Germany: Sonobuoy Market, By Technology, 2013-2020 (USD Million)
Table 71 Germany: Market, By Function, 2013-2020 (USD Million)
Table 72 Germany: Market, By Application, 2013-2020 (USD Million)
Table 73 Germany: Market, By Size, 2013-2020 (USD Million)
Table 74 Germany: Market, By Deployment, 2013-2020 (USD Million)
Table 75 France: Market, By Technology, 2013-2020 (USD Million)
Table 76 France: Market, By Function, 2013-2020 (USD Million)
Table 77 France: Market, By Application, 2013-2020 (USD Million)
Table 78 France: Market, By Size, 2013-2020 (USD Million)
Table 79 France: Market, By Deployment, 2013-2020 (USD Million)
Table 80 Russia: Sonobuoy Market, By Technology, 2013-2020 (USD Million)
Table 81 Russia: Market, By Function, 2013-2020 (USD Million)
Table 82 Russia: Market, By Application, 2013-2020 (USD Million)
Table 83 Russia: Market, By Size, 2013-2020 (USD Million)
Table 84 Russia: Market, By Deployment, 2013-2020 (USD Million)
Table 85 Middle East: Sonobuoy Market, By Technology, 2013-2020 (USD Million)
Table 86 Middle East: Market, By Function, 2013-2020 (USD Million)
Table 87 Middle East: Market, By Application, 2013-2020 (USD Million)
Table 88 Middle East: Market, By Size, 2013-2020 (USD Million)
Table 89 Middle East: Market, By Deployment, 2013-2020 (USD Million)
Table 90 U.A.E.: Sonobuoy Market, By Technology, 2013-2020 (USD Million)
Table 91 U.A.E.: Market, By Function, 2013-2020 (USD Million)
Table 92 U.A.E.: Market, By Application, 2013-2020 (USD Million)
Table 93 U.A.E.: Market, By Size, 2013-2020 (USD Million)
Table 94 U.A.E.: Market, By Deployment, 2013-2020 (USD Million)
Table 95 Saudi Arabia: Sonobuoy Market, By Technology, 2013-2020 (USD Million)
Table 96 Saudi Arabia: Market, By Function, 2013-2020 (USD Million)
Table 97 Saudi Arabia: Market, By Application, 2013-2020 (USD Million)
Table 98 Saudi Arabia: Market, By Size, 2013-2020 (USD Million)
Table 99 Saudi Arabia: Market, By Deployment, 2013-2020 (USD Million)
Table 100 Israel: Sonobuoy Market, By Technology, 2013-2020 (USD Million)
Table 101 Israel: Market, By Function, 2013-2020 (USD Million)
Table 102 Israel: Market, By Application, 2013-2020 (USD Million)
Table 103 Israel: Market, By Size, 2013-2020 (USD Million)
Table 104 Israel: Market, By Deployment, 2013-2020 (USD Million)
Table 105 Latin America: Sonobuoy Market, By Function, 2013-2020 (USD Million)
Table 106 Latin America: Market, By Technology, 2013-2020 (USD Million)
Table 107 Latin America: Market, By Application, 2013-2020 (USD Million)
Table 108 Latin America: Market, By Size, 2013-2020 (USD Million)
Table 109 Latin America: Market, By Deployment, 2013-2020 (USD Million)
Table 110 Brazil: Sonobuoy Market, By Function, 2013-2020 (USD Million)
Table 111 Brazil: Market, By Technology, 2013-2020 (USD Million)
Table 112 Brazil: Market, By Application, 2013-2020 (USD Million)
Table 113 Brazil: Market, By Size, 2013-2020 (USD Million)
Table 114 Brazil: Market, By Deployment, 2013-2020 (USD Million)
Table 115 Argentina: Sonobuoy Market, By Function, 2013-2020 (USD Million)
Table 116 Argentina: Market, By Technology, 2013-2020 (USD Million)
Table 117 Argentina: Market, By Application, 2013-2020 (USD Million)
Table 118 Argentina: Market, By Size, 2013-2020 (USD Million)
Table 119 Argentina: Market, By Deployment, 2013-2020 (USD Million)
Table 120 Africa: Sonobuoy Market, By Function, 2013-2020 (USD Million)
Table 121 Africa: Market, By Technology, 2013-2020 (USD Million)
Table 122 Africa: Market, By Application, 2013-2020 (USD Million)
Table 123 Africa: Market, By Size, 2013-2020 (USD Million)
Table 124 Africa: Market, By Deployment, 2013-2020 (USD Million)
Table 125 South Africa: Sonobuoy Market, By Function, 2013-2020 (USD Million)
Table 126 South Africa: Market, By Technology, 2013-2020 (USD Million)
Table 127 South Africa: Market, By Application, 2013-2020 (USD Million)
Table 128 South Africa: Market, By Size, 2013-2020 (USD Million)
Table 129 South Africa: Market, By Deployment, 2013-2020 (USD Million)
Table 130 Sonobuoy: Supply Contracts, 2012-2015
Table 131 Sonobuoy: New Product Launches, 2012-2015
Table 132 Sonobuoy: Acquisitions, Collaborations, Partnerships & Agreements, 2012-2015
List of Figures (158 Figures)
Figure 1 Sonobuoy Market Segmentation
Figure 2 Study Years
Figure 3 Limitations
Figure 4 Research Design
Figure 5 Bottom-Up Approach
Figure 6 Top-Down Approach
Figure 7 Market Breakdown and Data Triangulation
Figure 8 Limitations of the Research Study
Figure 9 Geographic Analysis: Sonobuoy Market Share, 2014
Figure 10 Investments in the Passive Sonobuoy Segment are Expected to Rise During the Forecast Period
Figure 11 The DIFAR Segment is Expected to Grow at A Robust Rate Due to Their Superior Detection Capability in A Littoral Zone
Figure 12 Increasing Demand for Highly Efficient and Technologically-Advanced Sonobuoy Systems are Expected to Provide Various Growth Opportunities for the Sonobuoy Market, 2015-2020
Figure 13 DIFAR the Fastest Growing Segment During the Forecast Period
Figure 14 The Special Purpose Segment is Expected to Witness the Most Lucrative Growth in the Sonobuoy Market, 2015 & 2020
Figure 15 The U.S. is Expected to Dominate the North American Sonobuoy Market While the A Size Sonobuoy Segment is Expected to Account for the Major Market Share
Figure 16 The Defense Sector is Expected to Witness the Highest Growth in the Sonobuoy Market, 2015 & 2020
Figure 17 The Pneumatic System is Expected to Grow at the Highest CAGR in the Sonobuoy Market, 2015 & 2020
Figure 18 Asia-Pacific is Expected to Grow at the Highest CAGR During the Forecast Period, 2014
Figure 19 The Asia-Pacific Sonobuoy Market is Expected to Witness A Significant Growth
Figure 20 Sonobuoy Market Segmentation
Figure 21 Market, By Technology
Figure 22 Market, By Size
Figure 23 Market, By Deployment
Figure 24 Market, By Function
Figure 25 Market, By Application
Figure 26 Market, By Range
Figure 27 Market, By Geography
Figure 28 Market Dynamics for the Sonobuoy Market
Figure 29 Value Chain Analysis: Global Sonobuoy Market
Figure 30 Supply Chain Analysis: Sonobuoy Market
Figure 31 Porter’s Five Forces Analysis:
Figure 32 Passive the Largest Segment in 2015 (USD Million)
Figure 33 Sonobuoy Market, By Function, 2015-2020 (Units)
Figure 34 Defense the Largest Applications in 2015, (USD Million)
Figure 35 DIFAR the Largest Segment in 2015, (USD Million)
Figure 36 Pneumatic the Largest Segment Within the Sonobuoy Market in 2015, (USD Million)
Figure 37 Sonobuoy Market, By Deployment, 2013-2020, (Units)
Figure 38 Market, By Size 2015-2020, (USD Million)
Figure 39 Market, By Size, 2015-2020, (Unit)
Figure 40 Sonobuoy Market Share, By Region, 2015
Figure 41 North America: Market Snapshot
Figure 42 North America: Sonobuoy Market, By Technology (USD Million)
Figure 43 North America: Market, By Pfunction (USD Million)
Figure 44 North America: Market, By Application (USD Million)
Figure 45 North America: Market, By Size (USD Million)
Figure 46 North America: Market, By Deployment (USD Million)
Figure 47 U.S.: Sonobuoy Market, By Technology (USD Million)
Figure 48 U.S.: Market, By Function (USD Million)
Figure 49 U.S.: Market, By Application (USD Million)
Figure 50 U.S.: Market, By Size (USD Million)
Figure 51 U.S.: Market, By Deployment (USD Million)
Figure 52 Asia-Pacific: Market Snapshot
Figure 53 Asia-Pacific: Sonobuoy Market, By Technology (USD Million)
Figure 54 Asia-Pacific: Market, By Function (USD Million)
Figure 55 Asia-Pacific: Market, By Application (USD Million)
Figure 56 Asia-Pacific: Market, By Size (USD Million)
Figure 57 Asia-Pacific: Market, By Deployment (USD Million)
Figure 58 China: Sonobuoy Market, By Technology (USD Million)
Figure 59 China: Market, By Function (USD Million)
Figure 60 China: Market, By Application (USD Million)
Figure 61 China: Market, By Size (USD Million)
Figure 62 China: Market, By Deployment (USD Million)
Figure 63 India: Sonobuoy Market, By Technology (USD Million)
Figure 64 India: Market, By Function (USD Million)
Figure 65 India: Market, By Application (USD Million)
Figure 66 India: Market, By Size (USD Million)
Figure 67 India: Market, By Deployment (USD Million)
Figure 68 Japan: Sonobuoy Market, By Technology (USD Million)
Figure 69 Japan: Market, By Function (USD Million)
Figure 70 Japan: Market, By Application (USD Million)
Figure 71 Japan: Market, By Size (USD Million)
Figure 72 Japan: Market, By Deployment (USD Million)
Figure 73 Australia: Sonobuoy Market, By Technology (USD Million)
Figure 74 Australia: Market, By Function (USD Million)
Figure 75 Australia: Market, By Application (USD Million)
Figure 76 Australia: Market, By Size (USD Million)
Figure 77 Australia: Market, By Deployment (USD Million)
Figure 78 Europe: Market Snapshot
Figure 79 Europe: Sonobuoy Market, By Technology (USD Million)
Figure 80 Europe: Market, By Function (USD Million)
Figure 81 Europe: Market, By Application (USD Million)
Figure 82 Europe: Market, By Size (USD Million)
Figure 83 Europe: Market, By Deployment (USD Million)
Figure 84 U.K.: Sonobuoy Market, By Deployment (USD Million)
Figure 85 U.K.: Market, By Function (USD Million)
Figure 86 U.K.: Market, By Application (USD Million)
Figure 87 U.K.: Market, By Size (USD Million)
Figure 88 U.K.: Market, By Deployment (USD Million)
Figure 89 Germany: Sonobuoy Market, By Technology (USD Million)
Figure 90 Germany: Market, By Function (USD Million)
Figure 91 Germany: Market, By Application (USD Million)
Figure 92 Germany: Market, By Size (USD Million)
Figure 93 Germany: Market, By Deployment (USD Million)
Figure 94 France: Sonobuoy Market, By Technology (USD Million)
Figure 95 France: Market, By Function (USD Million)
Figure 96 France: Market, By Application (USD Million)
Figure 97 France: Market, By Size (USD Million)
Figure 98 France: Market, By Deployment (USD Million)
Figure 99 Russia: Sonobuoy Market, By Technology (USD Million)
Figure 100 Russia: Market, By Function (USD Million)
Figure 101 Russia: Market, By Application (USD Million)
Figure 102 Russia: Market, By Size (USD Million)
Figure 103 Russia: Market, By Deployment (USD Million)
Figure 104 Middle East: Market Snapshot
Figure 105 Middle East: Sonobuoy Market, By Technology, 2015-2020 (USD Million)
Figure 106 Middle East: Market, By Function 2015-2020 (USD Million)
Figure 107 Middle East: Market, By Application, 2015-2020 (USD Million)
Figure 108 Middle East: Market, By Size, 2015-2020 (USD Million)
Figure 109 Middle East: Market, By Deployment, 2015-2020 (USD Million)
Figure 110 U.A.E.: Sonobuoy Market, By Technology, 2015-2020 (USD Million)
Figure 111 U.A.E.: Market, By Function, 2015-2020 (USD Million)
Figure 112 U.A.E.: Market, By Application, 2015-2020 (USD Million)
Figure 113 U.A.E.: Market, By Size, 2015-2020 (USD Million)
Figure 114 U.A.E.: Market, By Deployment, 2015-2020 (USD Million)
Figure 115 Saudi Arabia: Sonobuoy Market, By Technology, 2015-2020 (USD Million)
Figure 116 Saudi Arabia: Market, By Function, 2015-2020 (USD Million)
Figure 117 Saudi Arabia: Market, By Application, 2015-2020 (USD Million)
Figure 118 Saudi Arabia: Market, By Size, 2015-2020 (USD Million)
Figure 119 Saudi Arabia: Market, By Deployment, 2015-2020 (USD Million)
Figure 120 Israel: Sonobuoy Market, By Technology, 2015-2020 (USD Million)
Figure 121 Israel: Market, By Function, 2015-2020 (USD Million)
Figure 122 Israel: Market, By Application, 2015-2020 (USD Million)
Figure 123 Israel: Market, By Size 2015-2020 (USD Million)
Figure 124 Israel: Market, By Deployment, 2015-2020 (USD Million)
Figure 125 Latin America: Market Snapshot
Figure 126 Latin America: Sonobuoy Market, By Function, 2015-2020 (USD Million)
Figure 127 Latin America: Market, By Technology, 2015-2020 (USD Million)
Figure 128 Latin America: Market, By Application, 2015-2020 (USD Million)
Figure 129 Latin America: Market, By Size, 2015-2020 (USD Million)
Figure 130 Latin America: Market, By Deployment, 2015-2020 (USD Million)
Figure 131 Brazil: Sonobuoy Market, By Function, 2015-2020 (USD Million)
Figure 132 Brazil: Market, By Technology, 2015-2020 (USD Million)
Figure 133 Brazil: Market, By Application, 2015-2020 (USD Million)
Figure 134 Brazil: Market, By Size, 2015-2020 (USD Million)
Figure 135 Brazil: Market, By Deployment, 2015-2020 (USD Million)
Figure 136 Argentina: Sonobuoy Market, By Function, 2015-2020 (USD Million)
Figure 137 Argentina: Market, By Technology, 2015-2020 (USD Million)
Figure 138 Argentina: Market, By Application, 2015-2020 (USD Million)
Figure 139 Argentina: Market, By Size, 2015-2020 (USD Million)
Figure 140 Argentina: Market, By Deployment, 2015-2020 (USD Million)
Figure 141 Africa Market Snapshot
Figure 142 Africa: Sonobuoy Market, By Function, 2015-2020 (USD Million)
Figure 143 Africa: Market, By Technology, 2015-2020 (USD Million)
Figure 144 Africa: Market, By Application, 2015-2020 (USD Million)
Figure 145 Africa: Market, By Size, 2015-2020 (USD Million)
Figure 146 Africa: Market, By Deployment, 2015-2020 (USD Million)
Figure 147 South Africa: Sonobuoy Market, By Function, 2015-2020 (USD Million)
Figure 148 South Africa: Market, By Technology, 2015-2020 (USD Million)
Figure 149 South Africa: Market, By Application, 2015-2020 (USD Million)
Figure 150 South Africa: Market, By Size, 2015-2020 (USD Million)
Figure 151 South Africa: Market, By Deployment, 2015-2020 (USD Million)
Figure 152 Companies Adopted Acquisitions and Supply Contracts as the Key Growth Strategy During the Studied Period (2012-2015)
Figure 153 Sonobuoy Market Share, By Key Player, 2014
Figure 154 Sonobuoy Market Evolution Framework, 2012-2015
Figure 155 Sonobuoy: Acquisition is the Key Growth Strategy
Figure 156 Sparton Corporation: Company Snapshot
Figure 157 Thales Group: Company Snapshot
Figure 158 Ultra Electronics: Company Snapshot
The market size estimations for the various segments and sub segments of this market were arrived at through extensive secondary research, corroboration with primaries, and further market triangulation with the help of statistical techniques using econometric tools.
To know about the assumptions considered for the study, download the pdf brochure
The ecosystem of the sonobuoy market comprises raw material suppliers, manufacturers, distributors, and end users. The key end users of the sonobuoy market are naval forces and environmental research organizations. The sonobuoy market is characterized by direct distribution channels and the presence of mainly OEMs and Tier 1 & Tier 2 companies. Some of the key players of the market include Ultra Electronics (U.K.) and Sparton Corporation (U.K.).
This report would help the sonobuoy manufacturers, suppliers, retailers, wholesalers, distributers, and sub-component manufacturers to identify hot revenue pockets in this market.
Furthermore, this study answers several questions for the stakeholders; primarily which segments to focus over the next five years for prioritizing efforts and investments.
Target Audience
- Sonobuoy Manufacturers
- Original Equipment Manufacturers
- Sub-component Manufacturers
- Technology Support Providers
Scope of the Report
Sonobuoy Market, By Function
- Active
- Passive
- Special Purpose
Sonobuoy Market, By Application
- Defense
- Civil
Sonobuoy Market, By Technology
- Bathythermo Buoy,
- Search & Rescue Buoy
- Directional Command Activated
- Data Link Communications
- Directional Frequency Analysis and Recording
- Low Frequency Analysis and Recording
- Extended Echo Ranging
- Air Deployable Active Receiver
- Vertical Line Array Directional Frequency Analysis and Recording
Sonobuoy Market, By Deployment
- Spring
- Pneumatic
- Free-fall
- Cartridge
Sonobuoy Market, By Region
- North America
- Europe
- Middle East
- Asia-Pacific
- Latin America
- Africa
Available Customization
With the given market data, MarketsandMarkets offers customizations in accordance to company-specific needs. The following customization options are available for the report:
Geographic Analysis
- Geographic Analysis
Further breakdown of the Rest of Asia-Pacific market into North America – Canada and Asia-Pacific - Japan


Growth opportunities and latent adjacency in Sonobuoy Market
We want to know about Sonobuoy Market by Technology. Please let me know! Please send to me the PDF File ASAP. Best Regards, Solomon Min