Starch Recovery Systems Market By Component (Refining sieves, Hydrocyclones and centrifuges, Vacuum filters, Screw conveyors, and Filling stations), Plant size (Large, Medium, and Small), Application, and Region - Global Forecast To 2023


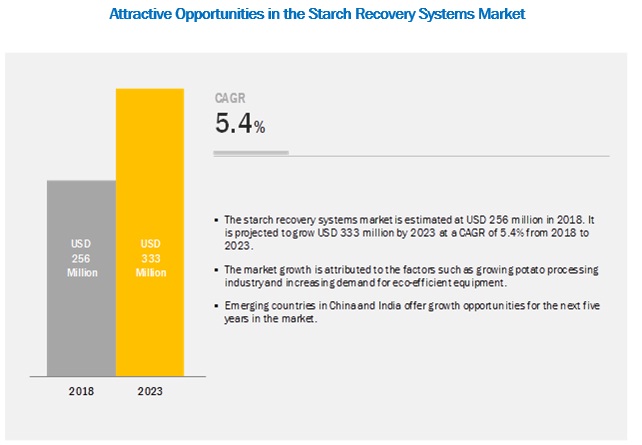
[131 Pages Report] The overall starch recovery systems market is projected to grow from USD 256 million in 2018 to USD 333 million by 2023, at a CAGR of 5.4%.The study involved four major activities in estimating the current market size for starch recovery systems. Exhaustive secondary research was done to collect information on the market, including the peer market. The next step was to validate these findings, assumptions, and sizing with industry experts across the value chain through primary research. Both the top-down and bottom-up approaches were employed to estimate the complete market size. Thereafter, market breakdown and data triangulation were used to estimate the market size of segments and subsegments.
Secondary Research
In the secondary research process, various secondary sources have been referred to, to identify and collect information for this study. The secondary sources included the annual reports such as the Potatoes USA Annual Report, the ICAR-Central Potato Research Institute Annual Report, press releases, and investor presentations of companies; white papers; certified publications; articles by recognized authors and regulatory bodies such as the USDA, the Potato Processing Association Of Australia (PPAA), the International Potato Center (CIP), and the Potato Association of America (PAA); trade directories; and databases, for instance, the European Cultivated Potato Database, ECPGR: The ECPGR Wild Potato Database, etc.
Secondary research has mainly been used to obtain key information about the industry’s value chain and supply chain, the total pool of key players, market classification & segmentation according to industry trends to the bottom-most level, and geographical markets. It has also been used to obtain information on the key developments from a market-oriented perspective.
Primary Research
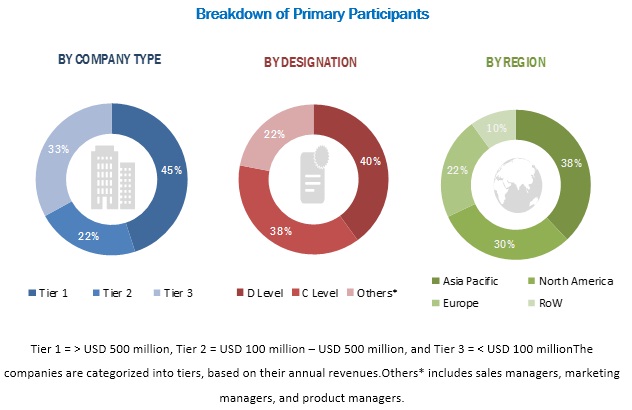
The starch recovery systems market includes several stakeholders in the supply chain-suppliers, R&D institutes, and end-product manufacturers. The demand side of the market is characterized by the presence of importers/exporters; distributors; and manufacturers of potato-based products. The supply side is characterized by the presence of key providers of starch recovery systems. Various primary sources from the supply and demand sides have been interviewed to obtain qualitative and quantitative information.
To know about the assumptions considered for the study, download the pdf brochure
Market Size Estimation:
Both the top-down and bottom-up approaches were used to estimate and validate the total size of the market. These approaches were also used extensively to estimate the size of various dependent submarkets. The research methodology used to estimate the market size includes the following:
- The key players in the industry and markets were identified through extensive secondary research.
- The industry’s supply chain and market size were determined through primary and secondary research.
- All percentage shares, splits, and breakdowns were determined using secondary sources and verified through primary sources.
- All possible parameters that affect the market covered in this research study were accounted for, viewed in extensive detail, verified through primary research, and analyzed to obtain the final quantitative and qualitative data.
- The research included the study of reports, reviews, and newsletters of top market players, along with extensive interviews for key opinions from leaders such as CEOs, directors, and marketing executives.
Data Triangulation:
After arriving at the overall market size from the estimation process explained above, the total market was split into several segments and subsegments. In order to complete the overall market engineering process and arrive at the exact statistics for all segments and subsegments, data triangulation & market breakdown procedures have been employed, wherever applicable. The data has been triangulated by studying various factors and trends from both the demand- and supply-sides. Along with this, the market size has been validated using both the top-down and bottom-up approaches.
Report Objectives:
Market Intelligence
- Determining and projecting the size of the starch recovery systems market, with respect to component, application, plant size, and regional markets over a five-year period, spanning from 2018 to 2023
- Identifying the attractive opportunities in the market by determining the largest and fastest-growing segments across the key regions
Competitive Intelligence
- Identifying and profiling the prominent market players in the starch recovery systems market
- Determining the share of key players operating in the starch recovery systems market
- Providing a comparative analysis of the market leaders, on the basis of the following:
- Product offerings
- Business strategies
- Strengths, weaknesses, opportunities, and threats
- Key financials
- Understanding the competitive landscape and identifying the key growth strategies adopted by the players across the key regions
- Analyzing the regulatory frameworks across regions and their impact on the prominent market players
- Providing insights on key innovations and investments in technology
Scope of the report:
|
Report Metric |
Details |
|
Market size available for years |
2016-2023 |
|
Base year considered |
2017 |
|
Forecast period |
2018-2023 |
|
Forecast period |
Value (USD million) |
|
Segments covered |
Components, application, plant size |
|
Geographies covered |
North America, Europe, Asia Pacific, and RoW |
|
Companies covered |
GEA (Germany), Alfa Laval (Sweden), Andritz (Austria), NivobaHovex (Netherlands), MICROTEC ENGINEERING GROUP (Australia), Myande Group (China), Larsson Sweden (Sweden), Sino-Food Machinery (China), Flo-Mech (UK), Hiller GmbH (Germany), Flottweg (Germany), Stamex Technology (Thailand), and HAUS Centrifuge Technologies (Turkey) |
This research report categorizes the starch recovery systems market, based on component, application, plant size, and region.
By Component
- Refining sieves
- Hydrocyclones and centrifuges
- Vacuum filters
- Screw conveyors
- Filling stations
- Others (spray dryer, plate heat exchanger, and desander)
By Application
- Frozen products
- Chips & snack pellets
- Dehydrated products
- Others (canned potato and potato flour)
By Plant size
- Large scale
- Medium scale
- Small scale
By Geography
- North America
- Europe
- Asia Pacific (APAC)
- RoW (South America, Middle East & Africa)
Available Customizations
Based on the given market data, MarketsandMarkets offers customizations in the reports as per client-specific requirements. The available customization options are as follows:
Product Analysis
- Product matrix, which gives a detailed comparison of the product portfolio of each company
Segmental Analysis
- Further breakdown of starch recovery systems, by key country
- Further breakdown of starch recovery systems, by application
Geographic Analysis
- Further breakdown of the Rest of Asia Pacific starch recovery systems market, by country
- Further breakdown of Rest of the World starch recovery systems market, by key country
Company Information
- Detailed analysis and profiling of additional market players (Up to 5)
The overall starch recovery systems market is projected to grow from USD 256 million in 2018 to USD 333 million by 2023, at a CAGR of 5.4%. The growing potato processing industry is driving the starch recovery systems market. Moreover, the need for eco-efficiency in the food industry is also an important factor that is driving the growth of the starch recovery systems market.
By component, the hydrocyclones and centrifuges segment is projected to be the largest contributor to the overall starch recovery systems market during the forecast period, in terms of market share.
The starch recovery systems market has been segmented, on the basis of component, into refining sieves, hydrocyclones and centrifuges, vacuum filters, screw conveyors, filling stations, and others (spray dryer, plate heat exchanger, and desander). The hydrocyclones and centrifuges segment is projected to dominate the market during the forecast period, in terms of value; it is projected to grow at the highest CAGR between 2018 and 2023. The growing potato processing industry and preferences for eco-efficient processing are driving the starch recovery systems market.
On the basis of application, the frozen products segment dominates the global starch recovery systems market.
The starch recovery systems market is segmented, on the basis of application, into frozen products, chips & snack pellets, dehydrated products, and others (canned potato and potato flour). The market for the frozen segment is projected to grow at a significant CAGR between 2018 and 2023. The increased demand for frozen potato products is positively impacting the growth of the starch recovery systems market.
By plant size, the large-scale potato processing industries are dominating the starch recovery systems market.
The starch recovery systems market is segmented, on the basis of plant size, into large, medium, and small. Large-scale plants are focusing on an eco-efficient process of generating starch from potato wastewater, creating a demand for starch recovery systems. The availability of budgets is one of the major factors due to which the large-scale industries have become early adopters of starch recovery systems. The need to reduce wastewater treatment costs and to earn additional profits by selling the recovered starch are some of the reasons to install the starch recovery systems. These factors are boosting the demand for starch recovery systems in the market.
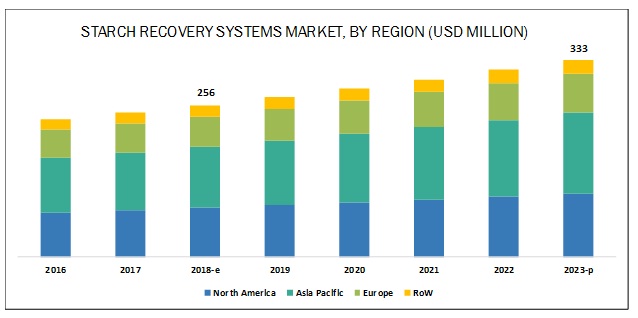
Asia Pacific is projected to account for the largest market size during the forecast period.
Asia Pacific is projected to dominate the global starch recovery systems market during the forecast period. Expansion of the potato processing industry is driving the demand for starch recovery systems market in the Asia Pacific region. The potato processing industry in the Asia Pacific region is experiencing growth, owing to the increasing demand for processed potato products. Additionally, the potato processing industries have developed an inclination toward eco-efficient processing systems with better quality products and a reduced amount of industrial discharge, in recent years; this is also driving the market in this region. These factors are expected to create a potential market for starch recovery systems in the potato processing industry. Promising markets such as India and China, along with other Asian countries, hold great potential for the growth of starch recovery systems.
Key Market Players:
Key players in the market include GEA (Germany), Alfa Laval (Sweden), Andritz (Austria), NivobaHovex (Netherlands), MICROTEC ENGINEERING GROUP (Australia), Myande Group (China), LARSSON SWEDEN (Sweden), Sino-Food Machinery (China), Flo-Mech (UK), Hiller GmbH (Germany), Flottweg (Germany), Stamex Technology (Thailand), and HAUS Centrifuge Technologies (Turkey). These players are increasingly undertaking new product launches, expansions & investments, and acquisitions & mergers to introduce and develop new technologies and products in the market and to expand their product portfolios in the untapped regions.
Recent Developments:
- In January 2018, Nivoba BV (Netherlands) and Hovex (Netherlands) announced the merger of the companies. This merger would enable the company to develop and strengthen its position in the global starch recovery systems market.
- In February 2017, Larsson Sweden (Sweden) launched a new range of rotary drum vacuum filters. The new filters are easy to clean and involve low maintenance cost and nominal operating care because of their highest automation and hygienic design.
- In March 2018, Alfa Laval (Sweden) opened a new production unit for brazed heat exchangers in Virginia, US. The new production plant would strengthen the company’s position in the North American market.
- In June 2018, Alfa Laval (Sweden) announced the launch of a new disc stack separator—UniDisc. This disc technology would increase the separation efficiency by 30%, due to the low spacing between the disc.
- In September 2018, Ferrum (Switzerland) announced the acquisition of Hiller GmbH (Germany). This acquisition would help Hiller GmbH to strengthen its position in the economically volatile market, as well as to expand its business in the Asian and North American regions.
Critical questions the report answers:
- Where will all these developments take the industry in the mid to long term?
- What are the upcoming industry applications for starch recovery systems?
- What is the impact of the potato processing industry on the starch recovery systems market?
- What are the new technologies introduced in starch recovery systems?
- What are the latest trends in the starch recovery systems market?
Frequently Asked Questions (FAQ):
What is the leading application in the starch recovery systems market?
The frozen products segment was the highest revenue contributor to the market, with USD 135.6 million in 2017, and is estimated to reach USD 182.6 million by 2023, with a CAGR of 5.1%.
What is the estimated industry size of starch recovery systems?
The global starch recovery systems market was valued at USD 243.4 million in 2017, and is projected to reach USD 333.0 million by 2023, registering a CAGR of 5.4% from 2018 to 2023.
What is the leading component of starch recovery systems market?
The hydrocyclones and centrifuges segment was the highest revenue contributor to the market, with USD 144.5 million in 2017, and is estimated to reach USD 205.9 million by 2023, with a CAGR of 6.1%. .
To speak to our analyst for a discussion on the above findings, click Speak to Analyst
 Exclusive indicates content/data unique to MarketsandMarkets and not available with any competitors.
Table of Contents
1 Introduction (Page No. - 15)
1.1 Objectives of the Study
1.2 Market Definition
1.3 Study Scope
1.3.1 Markets Covered
1.3.2 Geographic Segmentation
1.4 Periodization Considered
1.5 Currency Considered
1.6 Stakeholders
2 Research Methodology (Page No. - 19)
2.1 Research Data
2.1.1 Secondary Data
2.1.2 Primary Data
2.1.2.1 Breakdown of Primary Interviews
2.2 Market Size Estimation
2.3 Data Triangulation
2.4 Research Assumptions
2.5 Research Limitations
3 Executive Summary (Page No. - 27)
4 Premium Insights (Page No. - 30)
4.1 Opportunities in the Starch Recovery Systems Market
4.2 Starch Recovery Systems Market, By Key Country
4.3 Starch Recovery Systems Market, By Application and Region
4.4 Developed vs. Developing Markets for Starch Recovery Systems
4.5 Asia Pacific: Starch Recovery Systems Market, By Component and Country, 2017
5 Market Overview (Page No. - 35)
5.1 Introduction
5.2 Market Dynamics
5.2.1 Drivers
5.2.1.1 Diversified Applications of Starch & Its Derivatives for Food Nutrition and Industrial Purposes
5.2.1.1.1 Native Starch
5.2.1.1.2 Modified Starch
5.2.1.1.3 Maltodextrin
5.2.1.1.4 Cyclodextrin
5.2.1.1.5 Glucose Syrup
5.2.1.2 Growing Potato Processing Industry
5.2.1.3 Growing Need for Eco-Efficiency in the Food Processing Industry
5.2.1.3.1 Starch Recovery From Potato Processed Wastewater
5.2.2 Restraints
5.2.2.1 High R&D Cost
5.2.3 Opportunities
5.2.3.1 Developing High Yielding Equipment With A Low Operating Cost
5.2.4 Challenges
5.2.4.1 Lack of Infrastructure Facilities in Developing Countries
6 Starch Recovery Systems Market, By Component (Page No. - 42)
6.1 Introduction
6.2 Refining Sieves
6.2.1 the Flexibility in Size and Design Makes the Refining Sieves Favorable for Separation of Starch
6.3 Hydrocyclones & Centrifuges
6.3.1 Multifunctionality of Hydrocyclones & Centrifuges Drives their Demand in Starch Recovery Process
6.4 Vacuum Filters
6.4.1 Vacuum Filters are Preferred in Starch Recovery Due to their Easy Operation
6.5 Screw Conveyors
6.5.1 Increase in Potato Processing is Driving the Growth of Screw Conveyors
6.6 Filling Stations
6.6.1 Filling Stations are Preferred By the Potato Processing Industry to Minimize Product Contamination and Increase Accuracy During Packaging of Starch48
6.7 Others
6.7.1 Desanders and Plate Heat Exchangers are Other Components That Witness Demand in Starch Recovery
7 Starch Recovery Systems Market, By Application (Page No. - 50)
7.1 Introduction
7.2 Frozen Products
7.2.1 Increasing Demand for Frozen Potato Products to Drive the Growth of the Potato Processing Industry and the Adoption for Starch Recovery Systems
7.3 Chips & Snack Pellets
7.3.1 Increasing Demand for Chips and Snack Pellets in Emerging Countries to Drive the Market Growth of Starch Recovery Systems
7.4 Dehydrated Products
7.4.1 Multifunctionality of Dehydrated Potato Products Driving the Demand for the Dehydrated Products Segment
7.5 Others
7.5.1 Increasing Preference for Eco-Efficient Potato Processing Equipment Among Key Players to Drive the Starch Recovery Systems Market
8 Starch Recovery Systems Market, By Plant Size (Page No. - 57)
8.1 Introduction
8.2 Large
8.2.1 Large Plants Have Become the Early Adopters of Starch Recovery Systems in the Potato Processing Space Due to the Availability of Big Space
8.3 Medium
8.3.1 Starch Recovery Systems Can Generate Extra Income for Medium-Sized Enterprises
8.4 Small
8.4.1 Process Equipment Manufacturers Offering Starch Recovery Systems Suitable for Small Scale Potato Processing Plants
9 Starch Recovery Systems Market, By Region (Page No. - 60)
9.1 Introduction
9.2 North America
9.2.1 US
9.2.1.1 Increase in Production of Chips & Snack Pellets is Leading the Potato Starch Industry in the US
9.2.2 Canada
9.2.2.1 High Cultivation of Potato Crop and Production of Potato Products Such as French Fries is Fueling the Growth of Starch Recovery Systems
9.2.3 Mexico
9.2.3.1 Consumer Trend of Opting Canned and Frozen Potato Foods is Leading the Way for Starch Recovery Systems in the Country
9.3 Europe
9.3.1 Germany
9.3.1.1 Rising Demand for Processed Potato Food is Fueling the Potato Starch Market
9.3.2 France
9.3.2.1 Growth of the Potato Processing Industry Paved the Way for Starch Recovery in the Country
9.3.3 UK
9.3.3.1 Increased Capacities of Potato Production Plants Due to the Rising Consumer Demand for Potato Processed Foods is Fueling the Growth of 73
9.3.4 Italy
9.3.4.1 Increased Consumer Demand for Processed Potato Items is Driving the Starch Recovery
9.3.5 Spain
9.3.5.1 Increase in the Demand for Starch and Its Derivative in the End-Use Applications is Driving the Starch Industry in Spain
9.3.6 Rest of Europe
9.3.6.1 Rise in the Cultivation and Processing of Potato and Potato Processed Products is Driving the Market for Potato Starch in the Region
9.4 Asia Pacific
9.4.1 China
9.4.1.1 Regulating the Wastage of Starch Through Waste Water Compelled the Growth of Starch Recovery Systems Along With Demand for Frozen French Fries
9.4.2 Japan
9.4.2.1 Growing Demand for Eco-Efficient Processing Led the Demand for Starch Recovery Systems Market
9.4.3 India
9.4.3.1 Investments and Expansions By Major Potato Processing Industries Paved the Way for Starch Recovery Systems Market
9.4.4 Australia
9.4.4.1 Increase in Demand for Processed Potato Items Such as Frozen Fries is Encouraging the Demand for Starch Recovery Systems
9.4.5 Rest of Asia Pacific
9.4.5.1 Rapid Urbanization and Increasing Convenience Foods Have Led the Market for Starch Production
9.5 Rest of the World
9.5.1 South America
9.5.1.1 Consumer Inclination Toward Processed Food Items is Leading the Starch Recovery Systems Market in South America
9.5.2 Middle East & Africa
9.5.2.1 the Government Initiatives Led the Market for Food & Beverage Industry, Especially Potato Processing
10 Competitive Landscape (Page No. - 93)
10.1 Overview
10.2 Ranking of Key Players, 2017
10.3 Competitive Scenario
10.3.1 New Product Launches
10.3.2 Expansions and Investments
10.3.3 Acquisitions
10.3.4 Mergers
11 Company Profiles (Page No. - 100)
(Business Overview, Products Offered, Recent Developments, SWOT Analysis & MnM View)*
11.1 Andritz
11.2 GEA
11.3 Alfa Laval
11.4 Nivobahovex
11.5 Microtec Engineering Group
11.6 Myande Group
11.7 Larsson Sweden
11.8 Sino-Food Machinery
11.9 Flo-Mech
11.10 Hiller GmbH
11.11 Flottweg
11.12 Stamex Technology
11.13 Haus Centrifuge Technologies
*Details on Business Overview, Products Offered, Recent Developments, SWOT Analysis & MnM View Might Not Be Captured in Case of Unlisted Companies.
12 Appendix (Page No. - 125)
12.1 Discussion Guide
12.2 Knowledge Store: Marketsandmarkets’ Subscription Portal
12.3 Available Customizations
12.4 Related Reports
12.5 Author Details
List of Tables (63 Tables)
Table 1 US Dollar Exchange Rate Considered for the Study, 2014–2017
Table 2 Wastewater Quality in Different Applied Peeling Methods in Potato Processing Plants
Table 3 Starch Recovery Systems Market Size, By Component, 2016–2023 (USD Million)
Table 4 Refining Sieves Market Size, By Region, 2016–2023 (USD Million)
Table 5 Hydrocyclones & Centrifuges Market Size, By Region, 2016–2023 (USD Million)
Table 6 Vacuum Filters Market Size, By Region, 2016–2023 (USD Million)
Table 7 Screw Conveyors Market Size, By Region, 2016–2023 (USD Million)
Table 8 Filling Stations Market Size, By Region, 2016–2023 (USD Million)
Table 9 Other Components Market Size, By Region, 2016–2023 (USD Million)
Table 10 Starch Recovery Systems Market Size, By Application, 2016–2023 (USD Million)
Table 11 Frozen Products: Starch Recovery Systems Market Size, By Region, 2016–2023 (USD Million)
Table 12 Chips & Snack Pellets: Starch Recovery Systems Market Size, By Region, 2016–2023 (USD Million)
Table 13 Dehydrated Products: Starch Recovery Systems Market Size, By Region, 2016–2023 (USD Million)
Table 14 Others: Starch Recovery Systems Market Size, By Region, 2016–2023 (USD Million)
Table 15 Starch Recovery Systems Market Size, By Region, 2016–2023 (USD Million)
Table 16 North America: Starch Recovery Systems Market Size, By Country, 2016–2023 (USD Million)
Table 17 North America: Starch Recovery Systems Market Size, By Component, 2016–2023 (USD Million)
Table 18 North America: Starch Recovery Systems Market Size, By Application, 2016–2023 (USD Million)
Table 19 US: Starch Recovery Systems Market Size, By Component, 2016–2023 (USD Million)
Table 20 US: Starch Recovery Systems Market Size, By Application, 2016–2023 (USD Million)
Table 21 Canada: Starch Recovery Systems Market Size, By Component, 2016–2023 (USD Million)
Table 22 Canada: Starch Recovery Systems Market Size, By Application, 2016–2023 (USD Million)
Table 23 Mexico: Starch Recovery Systems Market Size, By Component, 2016–2023 (USD Million)
Table 24 Mexico: Starch Recovery Systems Market Size, By Application, 2016–2023 (USD Million)
Table 25 Europe: Starch Recovery Systems Market Size, By Country, 2016–2023 (USD Million)
Table 26 Europe: Starch Recovery Systems Market, By Application, 2016–2023 (USD Million)
Table 27 Europe: Starch Recovery Systems Market, By Component, 2016–2023 (USD Million)
Table 28 Germany: Starch Recovery Systems Market, By Component, 2016–2023 (USD Million)
Table 29 Germany: Starch Recovery Systems Market, By Application, 2016–2023 (USD Million)
Table 30 France: Starch Recovery Systems Market, By Component, 2016–2023 (USD Million)
Table 31 France: Starch Recovery Systems Market, By Application, 2016–2023 (USD Million)
Table 32 UK: Starch Recovery Systems Market, By Component, 2016–2023 (USD Million)
Table 33 UK: Starch Recovery Systems Market, By Application, 2016–2023 (USD Million)
Table 34 Italy: Starch Recovery Systems Market, By Component, 2016–2023 (USD Million)
Table 35 Italy: Starch Recovery Systems Market, By Application, 2016–2023 (USD Million)
Table 36 Spain: Starch Recovery Systems Market, By Component, 2016–2023 (USD Million)
Table 37 Spain: Starch Recovery Systems Market, By Application, 2016–2023 (USD Million)
Table 38 Rest of Europe: Starch Recovery Systems Market, By Component, 2016–2023 (USD Million)
Table 39 Rest of Europe: Starch Recovery Systems Market, By Application, 2016–2023 (USD Million)
Table 40 Asia Pacific: Starch Recovery Systems Market Size, By Country, 2016–2023 (USD Million)
Table 41 Asia Pacific: Starch Recovery Systems Market Size, By Component, 2016–2023 (USD Million)
Table 42 Asia Pacific: Starch Recovery Systems Market Size, By Application, 2016–2023 (USD Million)
Table 43 China: Starch Recovery Systems Market Size, By Component, 2016–2023 (USD Million)
Table 44 China: Starch Recovery Systems Market Size, By Application, 2016–2023 (USD Million)
Table 45 Japan: Starch Recovery Systems Market Size, By Component, 2016–2023 (USD Million)
Table 46 Japan: Starch Recovery Systems Market Size, By Application, 2016–2023 (USD Million)
Table 47 India: Starch Recovery Systems Market Size, By Component, 2016–2023 (USD Million)
Table 48 India: Starch Recovery Systems Market Size, By Application, 2016–2023 (USD Million)
Table 49 Australia: Starch Recovery Systems Market Size, By Component, 2016–2023 (USD Million)
Table 50 Australia: Starch Recovery Systems Market Size, By Application, 2016–2023 (USD Million)
Table 51 Rest of Asia Pacific: Starch Recovery Systems Market Size, By Component, 2016–2023 (USD Million)
Table 52 Rest of Asia Pacific: Starch Recovery Systems Market Size, By Application, 2016–2023 (USD Million)
Table 53 Row: Starch Recovery Systems Market Size, By Country, 2016–2023 (USD Million)
Table 54 Row: Starch Recovery Systems Market, By Application, 2016–2023 (USD Million)
Table 55 Row: Starch Recovery Systems Market, By Component, 2016–2023 (USD Million)
Table 56 South America: Starch Recovery Systems Market, By Application, 2016–2023 (USD Million)
Table 57 South America: Starch Recovery Systems Market, By Component, 2016–2023 (USD Million)
Table 58 Middle East & Africa: Starch Recovery Systems Market, By Application, 2016–2023 (USD Million)
Table 59 Middle East & Africa: Starch Recovery Systems Market, By Component, 2016–2023 (USD Million)
Table 60 New Product Launches, 2012–2018
Table 61 Expansions and Investments, 2012-2018
Table 62 Acquisitions, 2012-2018
Table 63 Mergers, 2012–2018
List of Figures (36 Figures)
Figure 1 Starch Recovery Systems Market Snapshot
Figure 2 Starch Recovery Systems Market, By Region
Figure 3 Starch Recovery Systems Market: Research Design
Figure 4 Breakdown of Primary Interviews: By Company Type, Designation, and Region
Figure 5 Market Size Estimation Methodology: Bottom-Up Approach
Figure 6 Market Size Estimation Methodology: Top-Down Approach
Figure 7 Data Triangulation Methodology
Figure 8 Starch Recovery Systems Market Size, By Component, 2018 vs. 2023 (USD Million)
Figure 9 Starch Recovery Systems Market Size, By Application, 2018 vs. 2023 (USD Million)
Figure 10 Starch Recovery Systems Market, By Region, 2017
Figure 11 Growing Demand for Processed Potato Drives the Growth Ofthe Starch Recovery Systems Market
Figure 12 China to Be the Fastest-Growing Country in the Starch Recovery Systems Market By 2023
Figure 13 Frozen Products Segment to Dominate the Market Through 2023
Figure 14 Developing Countries to Emerge at the Highest Growth Rates During the Forecast Period
Figure 15 China Accounted for the Largest Share in 2017
Figure 16 Starch Recovery Systems Market Dynamics
Figure 17 Percentage of Potato Processing in the Major Countries
Figure 18 Potato Processing Sales in the US
Figure 19 The Hydrocyclones & Centrifuges Segment is Projected to LeadDuring the Forecast Period
Figure 20 Starch Recovery Systems Market, By Application, 2018 vs. 2023
Figure 21 Starch Recovery Systems Market Share, By Plant Size, 2017
Figure 22 Asia Pacific is Estimated to Dominate the Global Starch Recovery Systems Market By 2023
Figure 23 North American Starch Recovery Systems Market Snapshot: High Sales & Demand in the Mature Market
Figure 24 Asia Pacific: Market Snapshot
Figure 25 China: Fresh Potato Consumption, 2017
Figure 26 Key Developments of the Leading Players in the Starch Recovery Systems Market, 2012-2018
Figure 27 Andritz, Led the Starch Recovery Systems Market In, 2017
Figure 28 Market Evaluation Framework
Figure 29 Andritz: Company Snapshot
Figure 30 Andritz: SWOT Analysis
Figure 31 GEA: Company Snapshot
Figure 32 GEA: SWOT Analysis
Figure 33 Alfa Laval: Company Snapshot
Figure 34 Alfa Laval: SWOT Analysis
Figure 35 Nivobahovex: SWOT Analysis
Figure 36 Microtec Engineering Group: SWOT Analysis


Growth opportunities and latent adjacency in Starch Recovery Systems Market