Thermal Interface Pads & Material Market by Type (Phase Change Material, Thermal Grease, Thermal Pads), Products (MOSFET, Thyristor, IGBT), Application (Consumer Electronics, Telecom Equipment, Power Supply Units) - Forecast to 2020


The thermal interface pads & material market comprises products used for transferring heat from electronic components to heat sinks in a wide range of electronic applications in different industries. Thermal interface pads & materials are widely used in consumer electronics, telecom equipment, power supply unit, aerospace, and other industries. The thermal interface pads & materials market was value at $850.06 Million in 2014 and is expected to grow at a rate of 8.47% in the near future.
The market has been segmented based on type, product, application, and geography. Based on application, the market has been segmented into consumer electronics, telecom equipment, power supply units, and others.
The global thermal interface pads & materials market is estimated to grow from $850.06 Million in 2014 to $1379.02 Million by 2020, at a CAGR of 8.47% from 2015 to 2020. The PCM market is expected to grow at a CAGR of 9.67%; its growth is expected to be driven by consumer electronics and telecom equipment industries.
This report also details the entire value chain and supply chain of the thermal interface pads & materials market. It also focuses on the parent market and identifies the potential applications for thermal interface pads & materials. The report also covers drivers, restraints, and opportunities for the said market.
The report is based on an extensive research study of the global thermal interface pads & materials market and aims to identify the market for various applications of thermal interface pads & material based systems. The report covers the overall market and sub-segment markets through extensively detailed classifications, in terms of market size.
This report aims to provide a bird�s eye-view of the entire thermal interface pads & materials market with detailed market segmentations, combined with the qualitative analysis of the various classifications done on the basis of type, product, application, and geography. The market has been estimated and forecasted till 2020 to provide a glimpse into its growth prospects and potential.
Some of the prominent companies in thermal interface pads & materials market include 3M (U.S.), Dow Corning (U.S.), Parker Chomerics (U.S.), and Laird Technologies (U.K.).Market scope:
In this report, the global thermal interface pads & material market has been segmented into the following categories, in addition to the industry trends which have also been detailed below:
- Thermal Interface Pads Market by Type: phase change material (PCM), thermal grease, thermal pads, and others.
- Thermal Interface Pads Market by Application: consumer electronics, telecom equipment, power supply units, and others.
- Thermal Interface Pads Market by Geography: North America (sub-segmentation by the U.S., Canada, and Mexico), Europe (sub-segmentation by the U.K., Germany, France, Italy and Spain), Asia-Pacific (sub-segmentation by China, Japan, South Korea, India and others), and Rest of the Word (sub-segmentation of Latin America, Middle East, and others)
- Thermal Interface Pads Market � Competitive Landscape: Market share analysis
- Thermal Interface Pads Market � Company Profiles: Detailed analysis of the major companies present in the thermal interface pads & material market.
The thermal interface pads & material market comprises products used for transferring heat from electronic components to heat sinks in a wide range of electronic applications. The thermal interface pads & material market is a highly competitive market with a few leading market players including mid-tier companies and start-up firms. This market is supplier driven due to which, the bargaining power of suppliers is high, while that of the buyers is low.
This research report categorizes the thermal interface pads & material market into four different segments on the basis of type, product, application, and geography. The market has been segmented based on type into phase change material (PCM), thermal grease, thermal pads, and others. Based on application, the market has been segmented into consumer electronics, telecom equipment, power supply units, and others. The market has been segmented based on geography into North America, Europe, APAC, and RoW.
The thermal interface pads & material market is expected to reach $1379.02 Million by 2020. Consumer electronics and telecom equipment are the two major applications of Thermal Interface Pads Market products which are currently available. APAC holds the largest share in the thermal interface pads & material market and is also expected to register a higher growth rate among the other regions.
The report also details the key high growth markets, thereby underlining the growth trend in the global thermal interface pads & materials market. Furthermore, the report analyzes the competitive scenario, geographic, trends and opportunities in the macro- and micro-markets with respect to North America, Europe, Asia-Pacific, and RoW.
Thermal Interface Pads & Materials Market 2015 - 2020 ($Million)
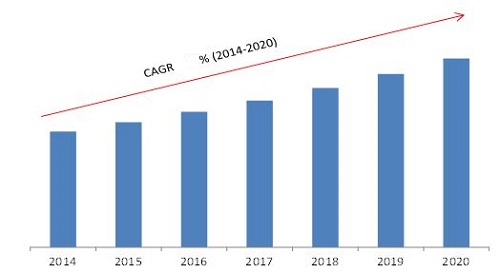
Source: MarketsandMarkets Analysis
The global thermal interface pads & material market is estimated to grow from $850.06 Million in 2014 to $1379.02 Million by 2020, at a CAGR of 8.47% from 2014 to 2020. The PCM market is expected witness highest growth; its growth is expected to be driven by consumer electronics and telecom equipment industries. Thermal pads and PCM are widely used in components such as microprocessors, memory units, chipsets, GPUs, customized ASICS, chipsets, and power modules. Such components are widely used in telecommunication equipment, consumer electronics, and computer peripherals.
 Exclusive indicates content/data unique to MarketsandMarkets and not available with any competitors.
Table of Contents
1 Introduction (Page No. - 12)
1.1 Objectives of the Study
1.2 Thermal Interface Pads Market Definition
1.3 Study Scope
1.3.1 Markets Covered
1.3.2 Year Consideration
1.3.3 Years Considered for Currency
1.4 Limitations
1.5 Stakeholders
2 Research Design (Page No. - 15)
2.1 Demand-Side Analysis
2.1.1 Increasing Demand for PCS, Laptops, & Tablets
2.1.2 Growing Thermal Management Solutions Market
2.2 Thermal Interface Pads Market Size Estimation
2.3 Thermal Interface Pads Market Breakdown and Data Triangulation
2.4 Thermal Interface Pads Market Share Estimation
2.4.1 Key Data From Secondary Sources
2.4.2 Key Data From Primary Sources
2.4.3 Assumptions
3 Executive Summary (Page No. - 23)
4 Premium Insides (Page No. - 27)
4.1 Attractive Opportunities for the Thermal Interface Materials Market
4.2 Thermal Interface Materials Market � Major Applications
4.3 Thermal Interface Materials Market, By Region
4.4 the U.S. and APAC Dominate the Global Thermal Interface Materials Market
4.5 Global Thermal Interface Materials Market Size, By Region
5 Market Overview (Page No. - 32)
5.1 Introduction
5.2 Thermal Interface Pads Market Segmentation
5.3 Thermal Interface Pads Market Dynamics
5.3.1 Drivers
5.3.1.1 Growing Demand for Thermal Management Solutions in the Computer and Telecom Equipment Industry
5.3.1.2 Increase in Demand for Thermal Pads and Thermal Interface Materials in Led Lighting
5.3.1.3 Need for Energy Efficient Devices to Limit the Energy Consumption
5.3.2 Restraints
5.3.2.1 High Costs
5.3.3 Opportunities
5.3.3.1 the Growing Demand for Thermal Interface Material & Thermal Pads From the Emerging Economies of the World
5.3.4 Challenges
5.3.4.1 Stability Issues Related to Thermal Interface Material While Downsizing
6 Industry Trends (Page No. - 39)
6.1 Value Chain Analysis
6.1.1 Research & Product Development
6.1.2 Manufacturing & Assembly
6.1.3 Distribution, Marketing, & Sales
6.2 Supply Chain Analysis
6.2.1 Key Influencers
6.3 Porter�s Five Forces Model
6.3.1 Threats of New Entrants
6.3.2 Threats of Substitutes
6.3.3 Bargaining Power of Suppliers
6.3.4 Bargaining Power of Buyers
6.3.5 Degree of Competition
7 Thermal Interface Material Market, By Type (Page No. - 49)
7.1 Introduction
7.2 Thermal Grease
7.3 Phase Change Material
7.4 Thermal Pads
7.5 Others
8 Thermal Interface Pads Market, By Material Type (Page No. - 58)
8.1 Introduction
8.2 Gap Pads
8.2.1 Elastomer
8.3 Phase Change Material
9 Thermal Interface Material Market, By Product (Page No. - 64)
9.1 Introduction
9.2 Thyristor
9.3 IGBT
9.4 Mosfet
9.5 Power Transistors
10 Thermal Interface Pads Market, By Application (Page No. - 70)
10.1 Introduction
10.2 Consumer Electronics
10.3 Telecom Equipment
10.4 Power Supply Units
10.5 Others
11 Thermal Interface Materials Market, By Geography (Page No. - 76)
11.1 Introduction
11.2 North America
11.3 Europe
11.4 APAC
11.5 Rest of the World (RoW)
12 Competitive Landscape (Page No. - 98)
12.1 Overview
12.2 Market Share Analysis, Thermal Interface Material Market
12.3 Competitive Situation and Trends
12.4 New Product Launches
12.5 Agreements, Collaborations, Contract & Joint Ventures
12.6 Mergers and Acquisitions
12.7 Expansions
13 Company Profiles (Page No. - 104)
(Overview, Products and Services, Financials, Strategy & Development)*
13.1 Introduction
13.2 3M
13.3 DOW Corning
13.4 Henkel AG
13.5 Laird Technologies
13.6 Parker Hannifin Corp
13.7 Honeywell International Inc.
13.8 The Bergquist Company
13.9 Stockwell Elastomerics, Inc.
13.10 Fujipoly
13.11 Graftech International Holdings Inc.
*Details on Overview, Products and Services, Financials, Strategy & Development Might Not Be Captured in Case of Unlisted Companies.
14 Appendix (Page No. - 128)
14.1 Insights of Industry Experts
14.3 Introducing RT: Real Time Market Intelligence
14.4 Related Reports
List of Tables (80 Tables)
Table 1 Thermal Interface Materials Market, By Type, 2014-2020 ($Million)
Table 2 Thermal Interface Material Market, By Application 2014-2020 ($Million)
Table 3 Driver Analysis
Table 4 Restraint Analysis
Table 5 Opportunity Analysis
Table 6 Challenge Analysis
Table 7 Thermal Interface Materials Market, By Type, 2014-2020 ($Million)
Table 8 Thermal Grease Market, By Application, 2014-2020 ($Million)
Table 9 Thermal Grease Market, By Product 2014-2020 ($Million)
Table 10 Thermal Grease Market, By Geography, 2014-2020 ($Million)
Table 11 PCM Market, By Application, 2014-2020 ($Million)
Table 12 PCM Market, By Product, 2014-2020 ($Million)
Table 13 PCM Market, By Geography, 2014-2020 ($Million)
Table 14 Thermal Pads Market, By Type, 2014-2020 ($Million)
Table 15 Others Thermal Interface Pads Market, By Application, 2014-2020 ($Million)
Table 16 Others Thermal Interface Pads Market, By Product, 2014-2020 ($Million)
Table 17 Others Thermal Interface Pads Market, By Geography, 2014-2020 ($Million)
Table 18 Thermal Interface Pads Market, By Type, 2014-2020 ($Million)
Table 19 Thermal Interface Pads Market, By Application, 2014-2020 ($Million)
Table 20 Thermal Interface Pads Market, By Product 2014-2020 ($Million)
Table 21 Elastomer Thermal Pads Market, By Application, 2014-2020 ($Million)
Table 22 Elastomer Thermal Pads Market, By Geography, 2014-2020 ($Million)
Table 23 PCM Thermal Pads Market, By Application 2014-2020 ($Million)
Table 24 Thermal Interface Material Market, By Product, 2014-2020 ($Million)
Table 25 Thyristor Market, By Thickness, 2014-2020 ($Million)
Table 26 IGBT Market, By Thickness, 2014-2020 ($Million)
Table 27 Mosfet Market, By Thickness, 2014-2020 ($Million)
Table 28 Power Transistor Market, By Thickness, 2014-2020 ($Million)
Table 29 Thermal Interface Pads Market, By Application 2014-2020 ($Million)
Table 30 Consumer Electronics Market, By Region 2014-2020 ($Million)
Table 31 Telecom Equipment Market, By Region 2014-2020 ($Million)
Table 32 Power Supply Units Market, By Product, 2014-2020 ($Million)
Table 33 Others Thermal Interface Pads Market, By Products 2014-2020 ($Million)
Table 34 Thermal Interface Materials Market, By Geography 2014-2020 ($Million)
Table 35 North American Thermal Interface Pads Market, By Type, 2014-2020 ($Million)
Table 36 North American TIM Market, By Application 2014-2020 ($Million)
Table 37 North American TIM Market, By Country 2014-2020 ($Million)
Table 38 U.S. Thermal Interface Pad Market, By Application, 2014-2020 ($Million)
Table 39 Canada Thermal Interface Pad Market, By Application, 2014�2020 ($Million)
Table 40 Mexico Thermal Interface Pad Market, By Application, 2014�2020 ($Million)
Table 41 European TIM Market, By Type, 2014-2020 ($Million)
Table 42 Europe TIM Market, By Application, 2014�2020 ($Million)
Table 43 European Thermal Interface Pads Market, By Country, 2014-2020 ($Million)
Table 44 U.K. Thermal Interface Pads Market, By Application, 2014-2020 ($Million)
Table 45 Germany Thermal Interface Pads Market, By Application, 2014-2020 ($Million)
Table 46 French Thermal Interface Pad Market, By Application, 2014-2020 ($Million)
Table 47 Italy Thermal Interface Pads Market, By Application, 2014�2020 ($Million)
Table 48 Spain Thermal Interface Pad Market, By Application, 2014�2020 ($Million)
Table 49 Others Thermal Interface Pad Market, By Application, 2014�2020 ($Million)
Table 50 APAC Thermal Interface Pads Market, By Type, 2014-2020 ($Million)
Table 51 APAC Thermal Interface Pad Market, By Application, 2014�2020 ($Million)
Table 52 APAC Thermal Interface Pad Market, By Country, 2014�2020 ($Million)
Table 53 Japan Thermal Interface Pad Market, By Application, 2014�2020 ($Million)
Table 54 China Thermal Interface Pad Market, By Application, 2014�2020 ($Million)
Table 55 South Korea Thermal Interface Pad Market, By Application, 2014�2020 ($Million)
Table 56 India Thermal Interface Pad Market, By Application, 2014�2020 ($Million)
Table 57 Others Thermal Interface Pad Market, By Application, 2014�2020 ($Million)
Table 58 RoW Thermal Interface Pad Market, By Type, 2014�2020 ($Million)
Table 59 RoW Thermal Interface Pad Market, By Application, 2014�2020 ($Million)
Table 60 RoW Thermal Interface Pad Market, By Region, 2014�2020 ($Million)
Table 61 Latin American Thermal Interface Pad Market, By Country, 2014�2020 ($Million)
Table 62 Latin American Thermal Interface Pad Market, By Application, 2014�2020 ($Million)
Table 63 Middle Eastern Thermal Interface Pad Market, By Country, 2014�2020 ($Million)
Table 64 Middle Eastern Thermal Interface Pad Market, By Application, 2014�2020 ($Million)
Table 65 Top Companies for Thermal Interface Material Market, By Application
Table 66 New Product Launches, 2010-2015
Table 67 Agreements, Collaborations, & Joint Ventures, 2015
Table 68 Mergers and Acquisitions, 2012-2014
Table 69 Expansions, 2014
Table 70 3M Product Portfolio
Table 71 DOW Corning: Product Portfolio
Table 72 DOW Corning: Recent Developments
Table 73 Laird Technologies: Product Portfolio
Table 74 Laird Technologies: Recent Developments
Table 75 Parker Hannifin Corporation: Product Portfolio
Table 76 The Bergquist Company: Product Portfolio
Table 77 The Bergquist Company: Recent Developments
Table 78 Stockwell Elastomerics Inc.: Product Portfolio
Table 79 Fujipoly: Product Portfolio
Table 80 Fujipoly: Recent Developments
List of Figures (51 Figures)
Figure 1 Thermal Interface Pad Market Covered
Figure 2 Research Design
Figure 3 PCS, Laptops, & Tablets Demand (2010-2013)
Figure 4 Thermal Management Solutions Market (2010-2013)
Figure 5 Thermal Interface Material & Thermal Pads Market Size Estimation Methodology: Bottom-Up Approach
Figure 6 Thermal Interface Material & Thermal Pads Market Size Estimation Methodology: Top-Down Approach
Figure 7 Breakdown of Primary Interviews: By Company Type, Designation, and Region
Figure 8 Thermal Interface Material Market Snapshot (2014-2020): PCM is Expected to Grow at the Highest CAGR During the Forecast Period
Figure 9 Global Thermal Interface Material Application Canvas, 2014:APAC Holds the Largest Share in the Thermal Interface Pad Market
Figure 10 Attractive Opportunities for the Thermal Interface Materials Market
Figure 11 Consumer Electronics is Expected to Witness A High Growth Rate During the Forecast Period
Figure 12 APAC Held the Highest Share in the Global Thermal Interface Materials Market
Figure 13 The U.S. & APAC Together Account for 57% of the Overall Thermal Interface Materials Market
Figure 14 APAC Holds the Maximum Share in the Global Thermal Interface Materials Market in 2014
Figure 15 Consumer Electronics Held the Highest Share in the Global Thermal Interface Materials Market in 2014
Figure 16 Thermal Interface Material & Thermal Pads Market - Segmentation
Figure 17 Drivers, Restraints, Opportunities, and Challenges for the Thermal Interface Material & Thermal Pads
Figure 18 Value Chain Analysis
Figure 19 Supply Chain Analysis
Figure 20 Porter�s Five Forces Analysis
Figure 21 Porters Analysis: Thermal Interface Materials & Thermal Pads
Figure 22 Threats of New Entrants
Figure 23 Threats of Substitutes
Figure 24 Bargaining Power of Suppliers
Figure 25 Bargaining Power of Buyers
Figure 26 Degree of Competition
Figure 27 PCM Based Products Likely to Drive the TIM Market During the Forecast Period
Figure 28 APAC is Expected to Drive the Thermal Grease Market During the Forecast Period, 2015-2020
Figure 29 Increased Demand From the Consumer Electronics Industry Will Fuel the Growth of PCM During the Forecast Period
Figure 30 Telecom Equipment Industry is Driving the Thermal Pads Market
Figure 31 IGBT is Expected to Drive the Thermal Interface Materials Market During the Forecast Period
Figure 32 Consumer Electronics and Telecom Equipment Will Fuel the Growth of the TIM and Thermal Pads Market During the Forecast Period
Figure 33 Geographic Snapshot (2014)- Emerging Economies are the New Hot Spots
Figure 34 APAC is the Fastest Growing Region for the Thermal Interface Pad Market
Figure 35 North American Thermal Interface Pad Market Snapshot: Demand Will Be Driven By PCM
Figure 36 Germany and U.K. Accounted for the Majority of the Demand for Thermal Interface Materials in Europe, 2014
Figure 37 APAC Thermal Interface Pad Market Snapshot: Demand Will Be Driven By the Consumer Electronics and Telecom Equipment Industries
Figure 38 Top Companies Adopted Mergers & Acquisitions and New Product Launches as the Key Growth Strategies During 2011-2014
Figure 39 Global Thermal Interface Material Market Share, By Key Player, 2014
Figure 40 Battle for Market Share: Acquisitions Was the Key Strategy
Figure 41 Key Players-Geographic Analysis
Figure 42 3M: Company Snapshot
Figure 43 3M: SWOT Analysis
Figure 44 DOW Corning Corporation: SWOT Analysis
Figure 45 Henkel AG: Company Snapshot
Figure 46 Henkel AG: SWOT Analysis
Figure 47 Laird Technologies: Company Snapshot
Figure 48 Laird Technologies: SWOT Analysis
Figure 49 Parker Hannifin Corp: Company Snapshot
Figure 50 Parker Hannifin Corp.: SWOT Analysis
Figure 51 Honeywell International Inc.: Company Snapshot


Growth opportunities and latent adjacency in Thermal Interface Pads & Material Market