
Smart Factory Market Size, Share & Trends

Smart Factory Market Size, Share & Trends by Component (Industrial Sensors, Industrial Robots, Industrial 3D Printing, Machine Vision Systems), Solution (SCADA, Manufacturing Execution Systems (MES), Plant Asset Management (PAM), Industrial Safety) - Global Forecast to 2030


SMART FACTORY MARKET SIZE, SHARE & TRENDS
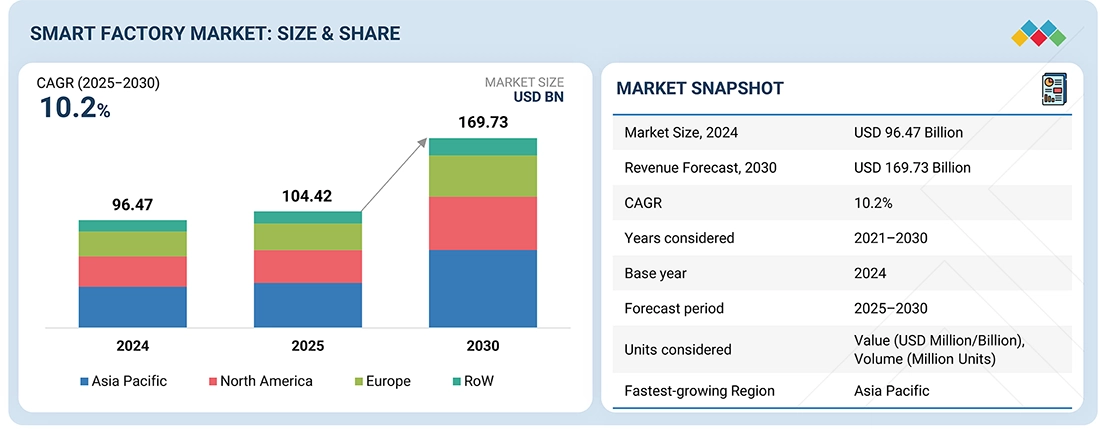
According to Marketsandmarkets, the global smart factory market size was valued at USD 96.47 billion in 2025 and is projected to reach USD 169.73 billion by 2030, growing at a CAGR of CAGR of 10.2% from 2025 to 2030. The growing need for automation, heightened emphasis on operational efficiency, and the requirement for immediate data insights propel market expansion. Advances in industrial IoT, artificial intelligence, robotics, and digital twin technologies are boosting productivity, facilitating predictive maintenance, and optimizing manufacturing processes in industries such as automotive, electronics, and pharmaceuticals.
MARKET SNAPSHOT TABLE SCOPE
| REPORT METRIC | DETAILS |
|---|---|
| Market Size, 2025 (Value) | USD 96.47 Billion |
| Market Forecast, 2030 (Value) | USD 169.73 Billion |
| Growth Rate | CAGR of 10.2% from 2025 to 2030 |
| Years Considered | 2021–2030 |
| Base Year | 2024 |
| Forecast Period | 2025–2030 |
| Units Considered | Value (USD Million/Billion), Volume (Million Units) |
| Report Coverage | Revenue Forecast, Company Ranking, Competitive Landscape, Growth Factors, and Trends |
| Segments Covered |
|
| Regional Scope | North America, Asia Pacific, Europe, the Middle East & Africa, Latin America |
| Top Companies |
|
| Growth Drivers |
|
Market Size & Forecast
SMART FACTORY MARKET KEY TAKEAWAYS
-
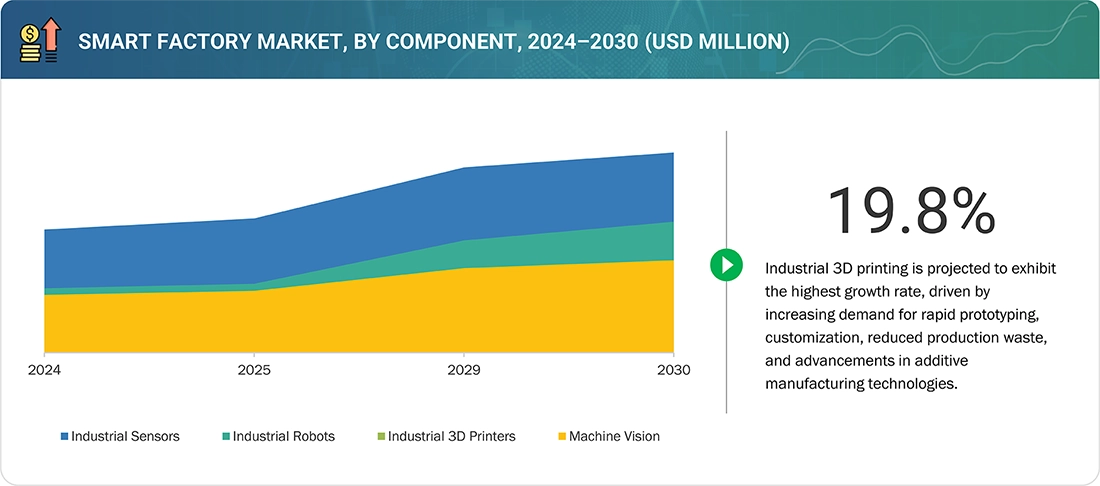
BY COMPONENTIndustrial sensors account for the largest market share, owing to their ability to enable real-time data acquisition, condition monitoring, and process optimization across connected manufacturing systems. Industrial 3D Printers are projected to register the fastest growth, driven by their increasing adoption for rapid prototyping, customized part production, and design flexibility across automotive, aerospace, and electronics industries.
-
BY SOLUTIONManufacturing execution systems (MES) dominate the market, as these systems play a central role in managing production operations, quality control, and process optimization. Plant asset management (PAM) is expected to grow at the highest rate, fueled by the rising need for predictive maintenance and lifecycle management of industrial equipment.
-
BY INDUSTRYProcess industries hold the largest market share, driven by extensive adoption of automation and control systems in sectors such as oil & gas, chemicals, food & beverage, and pharmaceuticals to enhance process safety, efficiency, and regulatory compliance. The medical devices segment is projected to witness the fastest growth, supported by rising demand for high-precision manufacturing, stringent quality standards, and increasing digital transformation in healthcare equipment production.
-
BY REGIONAsia Pacific is projected to dominate and record the fastest growth due to rapid industrialization, strong electronics manufacturing bases, and government initiatives supporting smart manufacturing in China, Japan, South Korea, and India. Europe and North America are early adopters, driven by Industry 4.0 frameworks and the presence of major automation players.
-
COMPETITIVE LANDSCAPEKey players in the smart factory companies include ABB (Switzerland), Emerson Electric Co. (US), Honeywell International Inc. (US), Rockwell Automation (US), and Schneider Electric (France). These companies focus on developing integrated automation and digitalization solutions, leveraging partnerships, acquisitions, and R&D investments to expand their product portfolios and strengthen their global presence in smart manufacturing ecosystems.
The smart factory market size is expected to witness substantial growth over the next decade, driven by the increasing adoption of automation, digitalization, and industrial IoT (IIoT) across manufacturing industries. Smart factories integrate advanced technologies. These technologies enhance productivity, reduce downtime, optimize resource utilization, and enable real-time decision-making, making smart factories the cornerstone of Industry 4.0 transformation.
Source: Secondary Research, Interviews with Experts, MarketsandMarkets Analysis
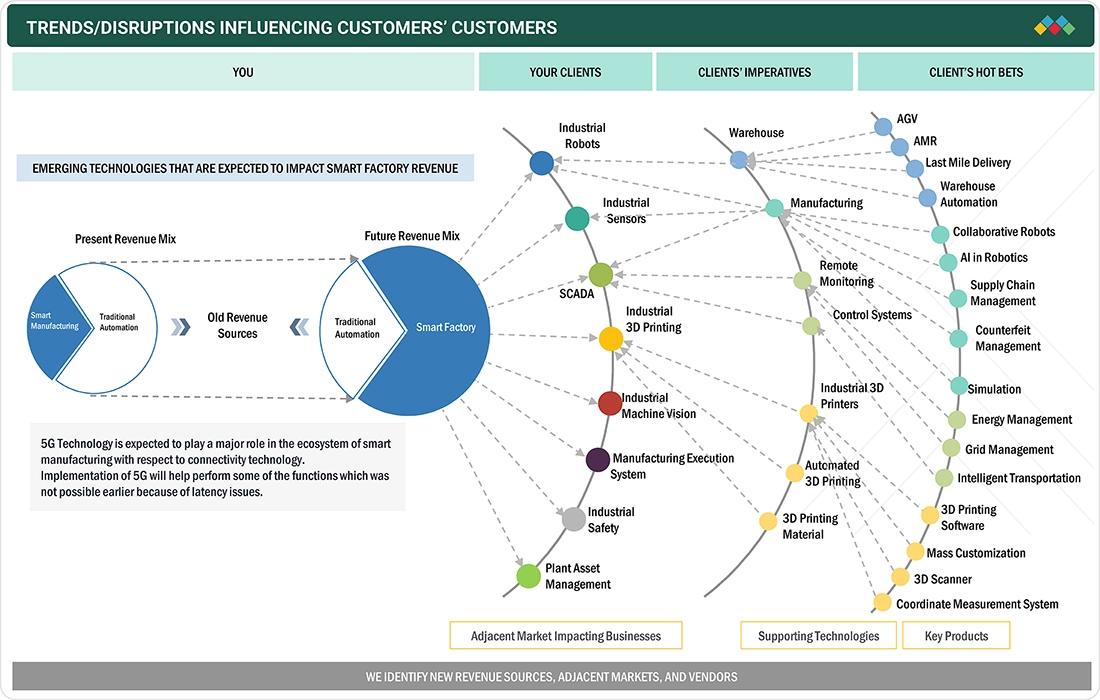
TRENDS & DISRUPTIONS IMPACTING CUSTOMERS' CUSTOMERS
The smart factory market share is shaped by rapid digital transformation and evolving manufacturing priorities. OEMs and industrial producers increasingly adopt IIoT, AI-based analytics, and robotics to enhance production efficiency and flexibility. Shifts such as predictive maintenance, real-time data utilization, and sustainable manufacturing practices directly impact operational costs and productivity for end users. These technological and process disruptions drive greater reliance on connected automation and integration platforms, influencing demand for smart factory solutions and accelerating growth across the industrial automation ecosystem.
Source: Secondary Research, Interviews with Experts, MarketsandMarkets Analysis
SMART FACTORY MARKET GROWTH DYNAMICS
Level
-
Growing emphasis on improving energy efficiency, optimizing resource utilization, and minimizing production costs

-
Growing adoption of industrial robots

Level
-
High capital investment requirements

-
Cybersecurity threats linked to cyber-physical systems

Level
-
Adoption of 5G in next-generation smart factories

-
Advancements in wireless sensor technologies and their integration into intelligent manufacturing

Level
-
Bridging the gap between IT and OT systems

-
Exposure to cyber threats

Source: Secondary Research, Interviews with Experts, MarketsandMarkets Analysis
Driver: Growing emphasis on improving energy efficiency, optimizing resource utilization, and minimizing production costs
Rising awareness and the importance of conserving energy are expected to be of prime importance in the coming years. Also, increasing energy efficiency and resource optimization offered by components and solutions in the smart factory market are expected to boost growth.
Restraint: High capital investment requirements
High investments are required to upgrade smart factory systems. This makes it difficult for small- and mid-sized enterprises (SMEs) to enter the smart factory market. Skilled professionals are needed for the proper installation of smart factory components and solutions integrated with industrial processes, which again adds to the cost of system installation.
Opportunity: Adoption of 5G in next-generation smart factories
The installation of 5G networks in factories eliminates the need for wired connectivity, enabling a high-speed manufacturing environment with high flexibility and less downtime. It becomes crucial for industries to have a network capable of supporting them in terms of speed, coverage, and reliability. The emergence of 5G networks will provide a one-stop solution for factories and create significant opportunities for smart factories.
Challenge: Bridging the gap between IT and OT systems
The biggest challenge for the implementation of a smart factory is the lack of interoperability between informational technology (IT) and operational technology (OT); IT and OT use different protocols and architectures, which significantly increases the complexity and costs associated with the adoption of smart factories. Most OT systems today work in silos.
Smart Factory Market Trends: COMMERCIAL USE CASES ACROSS INDUSTRIES
| COMPANY | USE CASE DESCRIPTION | BENEFITS |
|---|---|---|
 |
Intelligent automation systems, robotics, and digital twins to optimize manufacturing and assembly lines | Increased operational efficiency, predictive maintenance, reduced downtime, scalable smart factory deployment |
 |
Advanced process control, industrial IoT (IIoT) platforms, and real-time data analytics for production lines | Enhanced productivity, real-time visibility, improved decision-making, reduced operational costs |
 |
Connected factory solutions integrating sensors, analytics, and cybersecurity for end-to-end automation | Improved plant safety, better asset management, energy efficiency, and enhanced regulatory compliance |
 |
Smart manufacturing systems using edge computing, industrial control, and AI-based analytics | Faster time to market, real-time optimization, agile production, reduced waste |
 |
EcoStruxure platform enabling smart energy management and automation across manufacturing environments | Sustainable operations, lower energy consumption, improved machine uptime, integrated systems control |
Logos and trademarks shown above are the property of their respective owners. Their use here is for informational and illustrative purposes only.
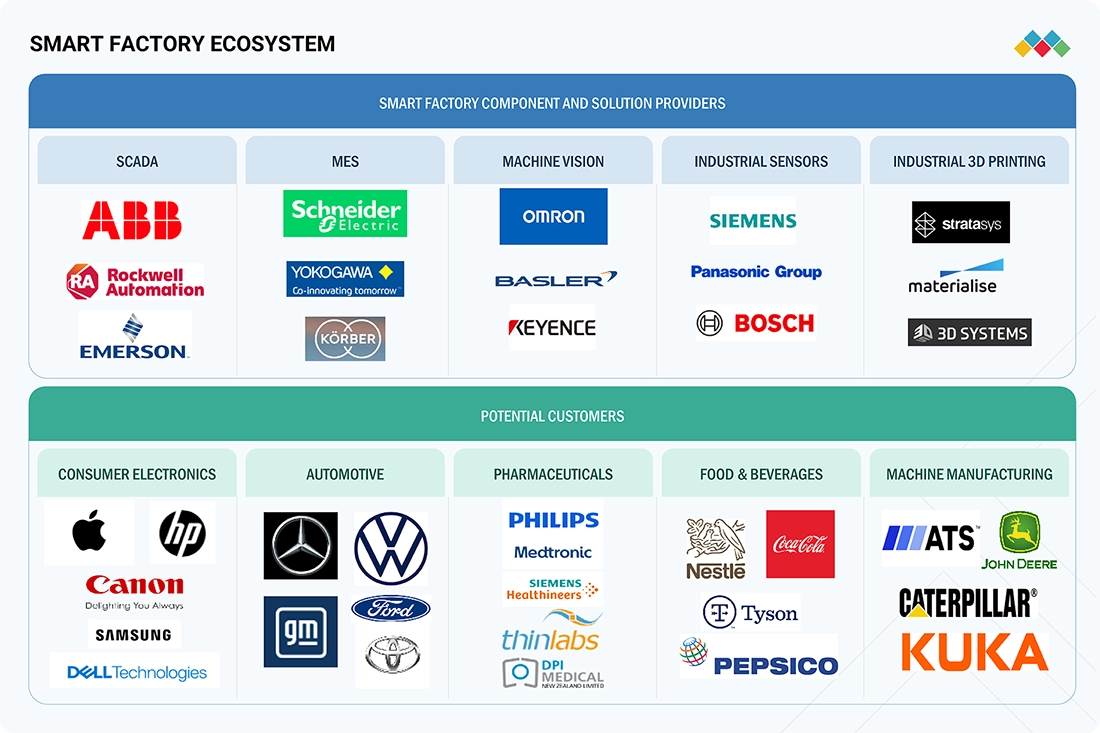
SMART FACTORY MARKET SHARE ECOSYSTEM
The smart factory market growth is supported by a well-established ecosystem of solution providers spanning hardware, software, and services. Key players include ABB (Switzerland), Siemens (Germany), Schneider Electric (France), Rockwell Automation (US), Honeywell International Inc. (US), Emerson Electric Co. (US), and General Electric (US). These companies offer integrated solutions combining automation, industrial IoT, cloud computing, and AI to transform traditional manufacturing environments. The strong footprint of these global technology leaders highlights the rising adoption of smart manufacturing practices to improve productivity, flexibility, and operational intelligence.
Logos and trademarks shown above are the property of their respective owners. Their use here is for informational and illustrative purposes only.
SMART FACTORY MARKET GROWTH SEGMENTS
Source: Secondary Research, Interviews with Experts, MarketsandMarkets Analysis
Smart Factory Market, by Component
The industrial sensors segment is estimated to account for the largest share of the smart factory market. Sensors are essential components of smart factory solutions. They detect and respond to several parameters (temperature, level, pressure, and moisture) in physical environments and convert them into signals. The growth of the industrial sensors segment is driven by the rising adoption of Industry 4.0 and IIoT, and the growing wireless sensors market. Smart factories enable connectivity throughout manufacturing operations by deploying sensors.
Smart Factory Market, by Solution
The MES segment accounted for the largest market share. MES is emerging as a strategic element for flexible and integrated production in different industries. It combines all the tasks of modern-day production management and forms a comprehensive software system for different industries and factories. Manufacturers are adopting MES as it saves costs, provides insights into ongoing manufacturing activities, and enables the high performance of production assets across the supply chain. The high adoption is leading to a high growth rate and the largest market share of the MES segment.
Smart Factory Market, By Industry
The oil & gas industry held a significant share of the smart factory market, driven by the growing need for operational efficiency, safety, and cost control across exploration, production, and refining operations. Companies in this sector increasingly adopt smart factory technologies to improve real-time monitoring, predictive maintenance, and remote asset management in both onshore and offshore environments.
SMART FACTORY MARKET SHARE REGION
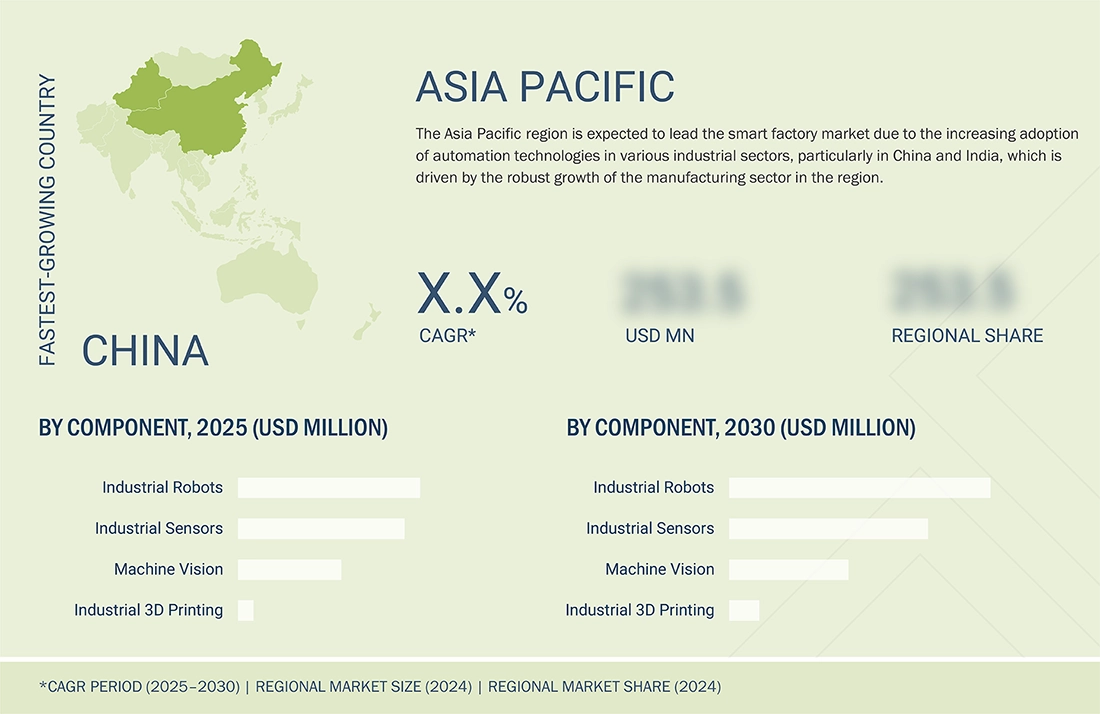
Asia Pacific to be the fastest-growing region in the global smart factory market during the forecast period
The Asia Pacific region is projected to lead the smart factory market trends, driven by the increasing adoption of automation technologies across industrial sectors in China and India. The market comprises China, Japan, and India, among others. The adoption of smart factory solutions in Asia Pacific is high due to the growing manufacturing sector in the region.
The North America smart factory market is estimated at USD 29.22 billion in 2025 and projected to reach USD 47.69 billion by 2030, growing at a CAGR of 10.3% during the forecast period. The North America smart factory market is growing as manufacturers invest heavily in advanced production facilities to address labor shortages and improve efficiency. The strong adoption of automation and industrial software enables companies to improve productivity and gain better visibility across their factory operations.
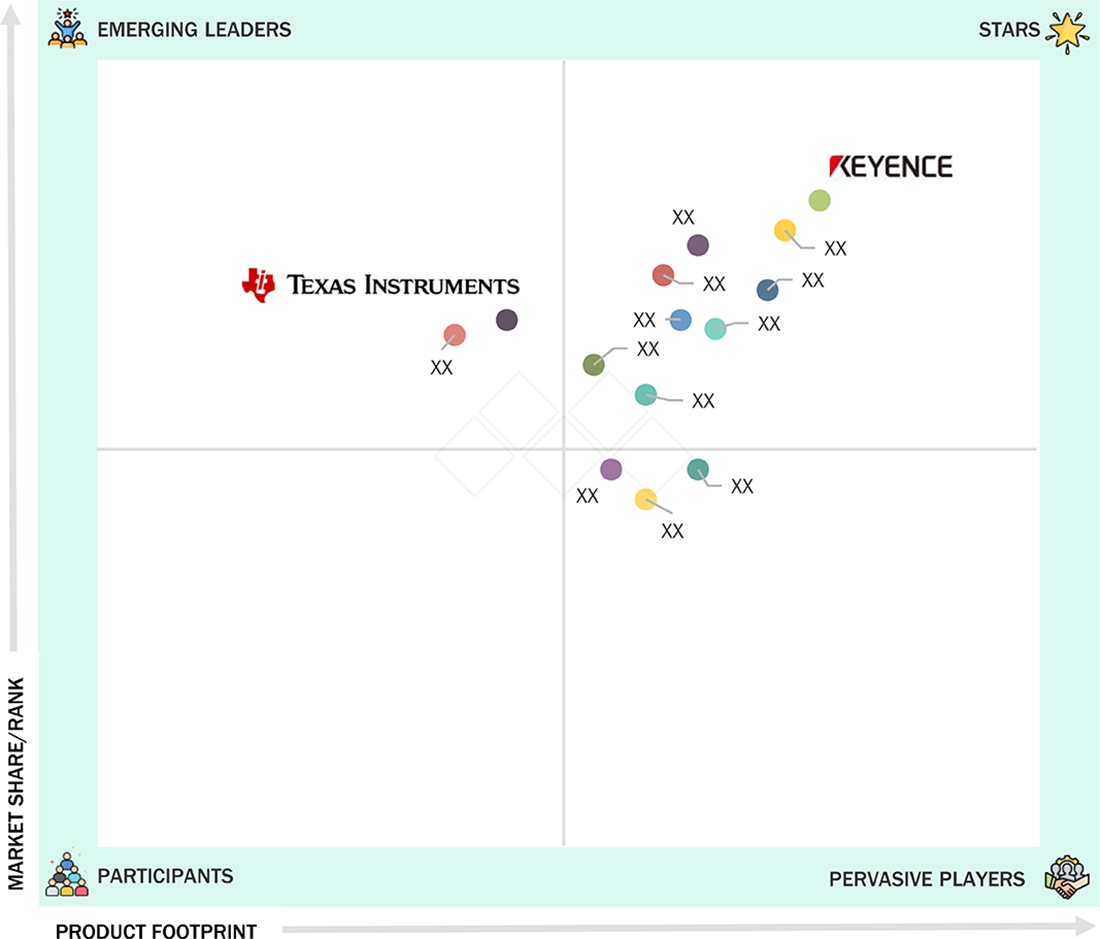
Smart Factory Market: COMPANY EVALUATION MATRIX
In the smart factory market matrix, KEYENCE CORPORATION (Star) and Texas Instruments Incorporated (Emerging Leader) hold strong positions with their broad product portfolios, global presence, and robust financial capabilities. Their continuous innovation and brand equity enable them to lead large-scale adoption of smart factory solutions worldwide.
Source: Secondary Research, Interviews with Experts, MarketsandMarkets Analysis
SMART FACTORY MARKET KEY PLAYERS
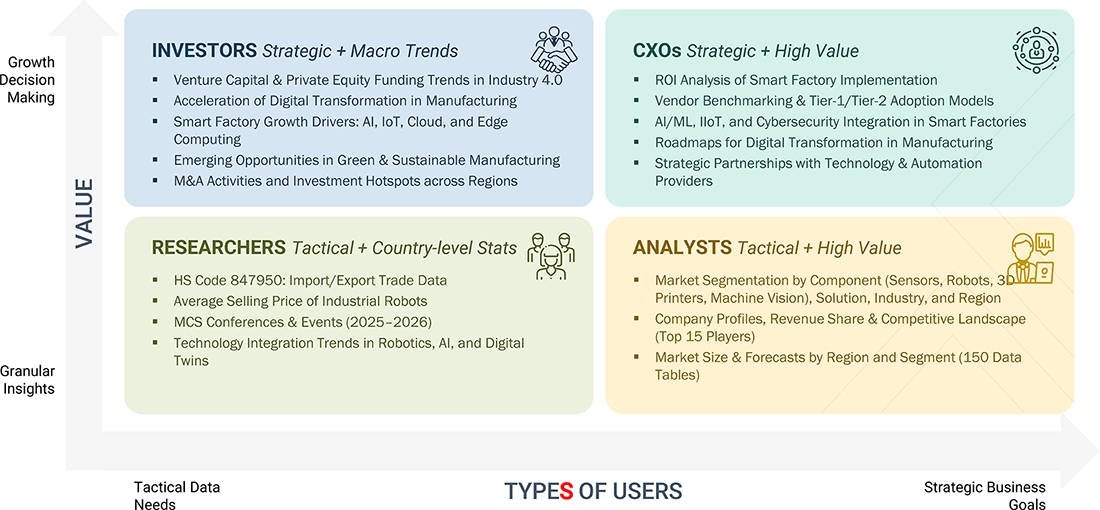
WHAT IS IN IT FOR YOU: Smart Factory Market REPORT CONTENT GUIDE
DELIVERED CUSTOMIZATIONS
We have successfully delivered the following deep-dive customizations:
| CLIENT REQUEST | CUSTOMIZATION DELIVERED | VALUE ADDS |
|---|---|---|
| European Automotive OEM |
|
|
| North American Electronics Manufacturer |
|
|
| APAC Industrial Automation Integrator |
|
|
RECENT DEVELOPMENTS
- April 2025 : Stratasys Ltd. launched PolyJet ToughONE White, a durable material for functional prototyping and end-use applications. It was designed for high-end PolyJet platforms and combines enhanced toughness with key features like a smooth surface finish, full-color realism, and multi-material versatility.
- April 2025 : Stratasys Ltd. launched the Neo800+ stereolithography (SLA) 3D printer. This next-generation model was built on the Neo800's success, offering up to 50% faster throughput, high part yield, and reduced production costs.
- April 2025 : Stratasys Ltd., a global leader in polymer 3D printing solutions, announced the completion of a strategic investment worth USD 120 million from Fortissimo Capital, a prominent Israeli private equity firm. This investment aimed to strengthen Stratasys' balance sheet and support its future growth initiatives.
- January 2025 : Mitsubishi Electric India acquired a stake in Gervigreind Data Science (Itanta Analytics), an Indian software startup, to co-develop no-code data analysis and report generation applications. This strategic move aimed to enhance Mitsubishi Electric’s SCADA offerings by integrating these applications with its FA equipment and GENESIS64 SCADA software, developed by US-based ICONICS.
- October 2024 : Yokogawa Electric Corporation launched OpreX Batch MES, a product in the OpreX Asset Operations and Optimization family. This MES software package was intended for batch plants producing specialty and fine chemicals.
Table of Contents
 Exclusive indicates content/data unique to MarketsandMarkets and not available with any competitors.
Methodology
The research study involved four major steps in estimating the size of the smart factory market. Exhaustive secondary research has been done to collect important information about the market and peer markets. The next step has been to validate these findings and assumptions and size them with the help of primary research with industry experts across the value chain. Both top-down and bottom-up approaches have been used to estimate the market size. After this, the market breakdown and data triangulation approaches have been adopted to estimate the market sizes of segments and subsegments.
Secondary Research
Various secondary sources were referred to in the secondary research process to identify and collect the information required for this study. These sources include annual reports, press releases, investor presentations of companies, white papers, and articles from recognized authors. Secondary research was mainly done to obtain key information about the market’s value chain, the pool of key market players, market segmentation according to industry trends, regional outlook, and developments from market and technology perspectives.
In the smart factory market report, the global market size has been estimated using the top-down and bottom-up approaches, along with several other dependent submarkets. The major players in the market were identified using extensive secondary research, and their presence in the market was determined using secondary and primary research. All the percentage splits and breakdowns have been determined using secondary sources and verified through primary sources.
Primary Research
Extensive primary research has been conducted after understanding the smart factory market scenario through secondary research. Several primary interviews have been conducted with key opinion leaders from demand- and supply-side vendors across four major regions—North America, Europe, Asia Pacific, and RoW. Approximately 40% of the primary interviews were conducted with the demand-side vendors and 60% with the supply-side vendors. Primary data has been collected mainly through telephonic interviews, which consist of 80% of the total primary interviews; questionnaires and emails have also been used to collect the data.
After successful interaction with industry experts, brief sessions were conducted with highly experienced independent consultants to reinforce the findings of our primary research. This, along with the in-house subject matter experts’ opinions, led us to the findings described in the report. The breakdown of primary respondents is as follows:

Note: Others include sales, marketing, and product managers. RoW comprises the Middle East, Africa, and South America. Three tiers of companies have been defined based on their total revenue as of 2024: tier 3: revenue less than USD 500 million; tier 2: revenue between USD 500 million and USD 1 billion; and tier 1: revenue more than USD 1 billion.
To know about the assumptions considered for the study, download the pdf brochure
Market Size Estimation
In the complete market engineering process, top-down and bottom-up approaches and several data triangulation methods have been used to estimate and forecast the overall market segments and subsegments listed in this report. The key players in the market have been identified through secondary research, and their market shares in the respective regions have been determined through primary and secondary research. This entire procedure includes the study of annual and financial reports of the top market players and extensive interviews for key insights (quantitative and qualitative) with industry experts (CEOs, VPs, directors, and marketing executives).
All percentage shares, splits, and breakdowns have been determined using secondary sources and verified through primary sources. All the parameters affecting the markets covered in this research study have been accounted for, viewed in detail, verified through primary research, and analyzed to obtain the final quantitative and qualitative data. This data has been consolidated and supplemented with detailed inputs and analysis from MarketsandMarkets and presented in this report.
Bottom-Up Approach
- Identifying various industries using or expected to deploy different types of smart factory solutions at their facilities
- Analyzing use cases across regions and companies
- Estimating the size of the smart factory market based on the demand from these industries and companies
- Tracking the ongoing and upcoming installation contracts, acquisitions, expansions, and product launches by various companies, and forecasting the market based on these developments and other critical parameters
- Conducting multiple discussions with key opinion leaders to understand smart factory components and solutions by companies in these industries, and analyzing the breakdown of the scope of work carried out by each major company providing smart factory components
- Arriving at the market estimates by analyzing the country-wise sales of smart factory solutions to companies, and combining this data to get the regional market estimates
- Verifying and cross-checking the estimates at each level through discussions with key opinion leaders, including CEOs, directors, operations managers, and domain experts at MarketsandMarkets
- Studying various paid and unpaid information sources, such as annual reports, press releases, and white papers
Top-Down Approach
- Information related to the revenue of key manufacturers and providers of smart factory components and solutions was studied and analyzed to estimate the global size of the smart factory market.
- Multiple discussions were conducted with key opinion leaders to understand the demand for smart factory components and analyze the break-up of the scope of work carried out by each major company.
- Revenue, geographic presence, key industries served, and the diverse offerings of all identified players in the smart factory market were studied to estimate and arrive at the percentage split of different market segments.
- All major players in the smart factory market were identified through secondary research and verified through brief discussions with industry experts.
- Multiple discussions were conducted with key opinion leaders of all major companies involved in developing smart factory solutions to validate the market split based on component, solution, industry, and region.
- Geographic splits were estimated through secondary sources based on factors such as the number of players offering smart factory solutions in a specific country or region, and the industries for which these players offer solutions.
Smart Factory Market : Top-Down and Bottom-Up Approach

Data Triangulation
After arriving at the overall market size from the estimation process explained above, the overall market has been split into several segments and subsegments. The data triangulation procedure has been employed wherever applicable to complete the overall market engineering process and arrive at the exact statistics for all segments and subsegments. The data has been triangulated by studying various factors and trends from both the demand and supply sides. Additionally, the market size has been validated using top-down and bottom-up approaches.
Market Definition
A smart factory is a highly digitalized and automated production system connected throughout all the production processes in a facility. It can self-optimize performance across a broad network, self-adapt to changing production conditions and requirements in real time, and autonomously run an entire production system. The main advantage of a smart factory is its ability to evolve with the changing needs of the organization. A smart factory uses a network to connect the virtual and physical elements of the production process to manufacturing operations. It represents an autonomous manufacturing environment that can handle any technical issues in real time during production using fragmented information and communication structures for the optimum management of production processes.
Key Stakeholders
- End Users
- Government Bodies, Venture Capitalists, and Private Equity Firms
- Smart Factory Manufacturers
- Smart Factory Solution & Component Distributors
- Smart Factory Industry Associations
- Professional Service/Solution Providers
- Research Institutions and Organizations
- Standards, Organizations, and Regulatory Authorities in Smart Factory Market
- System Integrators
- Technology Consultants
Report Objectives
- To describe and forecast the smart factory market, in terms of value, based on component, solution, and industry, in terms of value
- To forecast the market size for the four main regions—North America, Europe, Asia Pacific, and the Rest of the World (RoW), in terms of value
- To provide detailed information regarding the drivers, restraints, opportunities, and challenges influencing market growth
- To provide a detailed overview of the smart factory value chain and ecosystem
- To strategically analyze micromarkets with respect to individual growth trends, prospects, and contributions to the total market
- To strategically profile the key players and comprehensively analyze their market positions in terms of ranking and core competencies
- To analyze competitive developments, such as product launches, acquisitions, collaborations, agreements, and partnerships, in the smart factory market
- To provide ecosystem analysis, case study analysis, patent analysis, technology analysis, key conferences and events, Porter’s five forces analysis, regulatory landscape, impact of AI/Gen AI, and impact of the 2025 US Tariff on the smart factory market
- To provide a macroeconomic outlook for all the regions in the region chapter
Available customizations:
With the given market data, MarketsandMarkets offers customizations according to the specific requirements of companies. The following customization options are available for the report:
- Detailed analysis and profiling of additional market players based on various blocks of the supply chain
Key Questions Addressed by the Report
What is the current size of the Smart Factory Market?
The global Smart Factory Market is valued at USD 104.42 billion in 2025.
What is the projected market size of the Smart Factory Market by 2030?
The Smart Factory Market is expected to reach USD 169.73 billion by 2030.
What is the expected CAGR of the Smart Factory Market?
The market is forecast to grow at a CAGR of 10.2% during 2025–2030.
What are the key growth drivers of the Smart Factory Market?
Major growth drivers include increasing adoption of industrial automation, rising demand for operational efficiency, implementation of Industrial IoT (IIoT), AI integration, digital twins, energy efficiency initiatives, and real-time data analytics.
Which region dominates the Smart Factory Market?
Asia Pacific dominates the Smart Factory Market and is expected to register the highest growth due to rapid industrialization, government support for smart manufacturing, and increasing investments in Industry 4.0 technologies.
Which industry segment accounts for the largest share of the Smart Factory Market?
The process industries segment, including oil & gas, chemicals, pharmaceuticals, food & beverages, and energy & power, accounts for the largest market share due to extensive automation requirements.
Which component segment holds the largest market share in the Smart Factory Market?
Industrial sensors hold the largest market share as they are critical for real-time monitoring, predictive maintenance, process control, and data collection in smart manufacturing environments.
Which solution segment leads the Smart Factory Market?
Manufacturing Execution Systems (MES) lead the market as they facilitate production monitoring, quality management, workflow optimization, and real-time operational visibility.
Who are the major companies operating in the Smart Factory Market?
Key market participants include ABB, Emerson Electric Co., Honeywell International Inc., Rockwell Automation, and Schneider Electric.
What are the major trends shaping the Smart Factory Market?
Key trends include AI-powered manufacturing, Industrial IoT, digital twin technology, predictive maintenance, collaborative robotics, machine vision systems, industrial 3D printing, sustainability initiatives, and smart energy management solutions.
Need a Tailored Report?
Customize this report to your needs
Get 10% FREE Customization
Customize This ReportPersonalize This Research
- Triangulate with your Own Data
- Get Data as per your Format and Definition
- Gain a Deeper Dive on a Specific Application, Geography, Customer or Competitor
- Any level of Personalization
Let Us Help You
- What are the Known and Unknown Adjacencies Impacting the Smart Factory Market
- What will your New Revenue Sources be?
- Who will be your Top Customer; what will make them switch?
- Defend your Market Share or Win Competitors
- Get a Scorecard for Target Partners

Custom Market Research Services
We Will Customise The Research For You, In Case The Report Listed Above Does Not Meet With Your Requirements
Get 10% Free CustomisationTESTIMONIALS

Tetsuya Ohhira
Business Development Manager-Technology Business
Nikon Corporation,
Leading Japanese MNC specializing in optics and imaging productswww.nikon.com
MarketsandMarkets™ response
is quick. Their attitude is flexible and positive. Analyst Insights are globally considered and
significant. Client Services quickly respond to our inquiry and demand. Their wide range of global
surveys help us make our strategic plan.
We hope Knowledge Store will be easier to search
for a report.
VP - Marketing & Business Development
Leading Provider of Process Control Solutions
We engaged with MarketsandMarkets on a study to perform an analysis and recommend a Go-To-Market strategy for metrology and process control in the semiconductor market. The study was tailored to our targets and needs with well-defined milestones. Our overall experience with the MarketsandMarkets team was very good throughout the project in all aspects including the analysis methodologies used, the quality and depth of primary and secondary data sets, the professionalism and flexibility of the team and the ability to meet the target schedule and milestones. We want to thank MarketsandMarkets team for a job well done.
- North America Smart Factory Market
- Europe Smart Factory Market
- Asia Pacific Smart Factory Market
- Rest of World Smart Factory Market
- Industrial Sensors Smart Factory Market
- Industrial Robots Smart Factory Market
- Industrial 3D Printing Smart Factory Market
- Machine Vision Smart Factory Market
- Mes Smart Factory Market
- Scada Smart Factory Market
- Pam Smart Factory Market
- Industrial Safety Smart Factory Market
- Canada Smart Factory Market
- Mexico Smart Factory Market
- US Smart Factory Market
- France Smart Factory Market
- Germany Smart Factory Market
- Italy Smart Factory Market
- Nordics Smart Factory Market
- Poland Smart Factory Market
- Rest Of Europe Smart Factory Market
- Spain Smart Factory Market
- UK Smart Factory Market
- Australia Smart Factory Market
- China Smart Factory Market
- India Smart Factory Market
- Indonesia Smart Factory Market
- Japan Smart Factory Market
- Malaysia Smart Factory Market
- Rest Of Asia Pacific Smart Factory Market
- South Korea Smart Factory Market
- Thailand Smart Factory Market
- Vietnam Smart Factory Market
Growth opportunities and latent adjacency in Smart Factory Market


Barry
Apr, 2026
Why do industrial sensors account for the largest market share in smart factories?.
Andrew
Apr, 2026
Why do manufacturing execution systems (MES) dominate smart factory operations?.
Donghyun
Jul, 2022
Could you explain why in Technology(solution) parts no more include PLM, ERP, PLC and DCS as your previous report 2018 ? I want to buy this repot in continuous point, so confusing .
Chris
Sep, 2022
Looking to understand the smart factory market at the intersection of technology, software, and services.
Kento
Sep, 2022
I would like to know the market trend of Smart factory, especially in Europe and Asia region. .
Randy
Sep, 2022
New and competitive smart factory product information. We are an automation products distributor. .
Jaewon
Sep, 2022
The current condition of the manufacturing market in the view of digital transformation .
Gabrielle
Sep, 2022
Interested in smart factory report. Please provide pricing.
Travis
Sep, 2022
Leveraging the NOW through a Designed National Economics and Infrastructure. Integrated Technology Platforms by region for all citizens as a business service - public and free provided by the EDC. Integrated across Community. Predesigned value chains for the Geography. Automated Value Generation after Value Design (Drag and Drop) of Physical Process components to Design and Create Physical Products within a Region. Export excess of specialization - surplus. Eliminate Tax. Increase Size and Scope of Revenue Generation, allowing for continuously growing Public Services. .