The study involved four major activities in estimating the current size of the EMC shielding and test equipment market. Exhaustive secondary research collected information on the market, peer, and parent markets. The next step was to validate these findings, assumptions, and sizing with industry experts across the value chain through primary research. Both top-down and bottom-up approaches were employed to estimate the complete market size. After that, market breakdown and data triangulation were used to estimate the market size of segments and subsegments.
Secondary Research
Various secondary sources have been referred to in the secondary research process for identifying and collecting information important for this study. The secondary sources include annual reports, press releases, and investor presentations of companies; white papers; journals and certified publications; and articles from recognized authors, websites, directories, and databases. Secondary research has been conducted to obtain critical information about the industry’s supply chain, the market’s value chain, the total pool of key players, market segmentation according to the industry trends (to the bottom-most level), regional markets, and key developments from market- and technology-oriented perspectives. The secondary data has been collected and analyzed to determine the overall market size, further validated by primary research.
List of major secondary sources
|
Segment
|
Subsegment
|
|
American Society for Testing and Materials (ASTM)
|
https://www.astm.org/
|
|
Institute of Electrical and Electronics Engineers (IEEE)
|
https://www.ieee.org/
|
|
International Electrotechnical Commission (IEC)
|
https://www.oica.net/
|
|
Federal Communications Commission
|
https://www.fcc.gov/
|
|
International Electrotechnical Commission (IEC)
|
https://iec.ch/
|
Primary Research
Extensive primary research was conducted after gaining knowledge about the current scenario of the EMC shielding and test equipment market through secondary research. Several primary interviews were conducted with experts from both the demand and supply sides across four major regions—North America, Europe, Asia Pacific, and RoW. This primary data was collected through questionnaires, emails, and telephonic interviews.

To know about the assumptions considered for the study, download the pdf brochure
Market Size Estimation
In the complete market engineering process, top-down and bottom-up approaches have been used, along with several data triangulation methods, to perform market estimation and forecasting for the overall market segments and subsegments listed in this report. Key players in the market have been identified through secondary research, and their market shares in the respective regions have been determined through primary and secondary research. This entire procedure includes the study of annual and financial reports of the top market players and extensive interviews for key insights (quantitative and qualitative) with industry experts (CEOs, VPs, directors, and marketing executives).
All percentage shares, splits, and breakdowns have been determined using secondary sources and verified through primary sources. All the parameters affecting the markets covered in this research study have been accounted for, viewed in detail, verified through primary research, and analyzed to obtain the final quantitative and qualitative data. This data has been consolidated and supplemented with detailed inputs and analysis from MarketsandMarkets and presented in this report. The following figure represents this study’s overall market size estimation process.
Bottom-Up Approach
The bottom-up approach was used to arrive at the overall size of the EMC shielding and test equipment market from the revenues of the key players and their shares in the market. The overall market size was calculated based on the revenues of the key players identified in the market.
-
Identifying entities in the EMC shielding and test equipment value chain influencing the entire EMC shielding and test equipment industry
-
Analyzing each entity along with related major companies identifying technology providers for the implementation of products
-
Estimating the market for these EMC shielding and test equipment end users
-
Tracking ongoing and upcoming implementation of EMC shielding and test equipment developments by various companies and forecasting the market based on these developments and other critical parameters
-
Arriving at the market size by analyzing EMC shielding and test equipment companies based on their countries and then combining it to get the market estimate by region
-
Verifying estimates and crosschecking them through a discussion with key opinion leaders, including Chief Experience Officers (CXOs), directors, and operation managers

Top-Down Approach
In the top-down approach, the overall market size has been used to estimate the size of individual markets (mentioned in the market segmentation) through percentage splits from secondary and primary research.
The most appropriate immediate parent market size has been used to implement the top-down approach to calculate the market size of specific segments. The top-down approach has been implemented for the data extracted from the secondary research to validate the market size obtained.
Each company’s market share has been estimated to verify the revenue shares used earlier in the top-down approach. This study has determined and confirmed the overall parent market and individual market sizes by the data triangulation method and data validation through primaries. The data triangulation method in this study is explained in the next section.
-
Focusing initially on topline investments by market players in the EMC shielding and test equipment ecosystem
-
Calculating the market size based on the revenue generated by market players through the sales of EMC shielding and test equipment
-
Mapping the use of EMC shielding and test equipment in different technologies
-
Building and developing the information related to the revenue generated by market players through key products
-
Estimating the geographic split using secondary sources considering factors, such as the number of players in a specific country and region, the role of major players in developing innovative products, and adoption and penetration rates for various methods, and end-user industries in a particular country.

Data Triangulation
After arriving at the overall market size from the estimation process explained above, the overall market has been split into several segments and subsegments. The data triangulation procedure has been employed wherever applicable to complete the overall market engineering process and arrive at the exact statistics for all segments and subsegments. The data has been triangulated by studying various factors and trends from both the demand and supply sides. Additionally, the market size has been validated using top-down and bottom-up approaches.
Market Definition
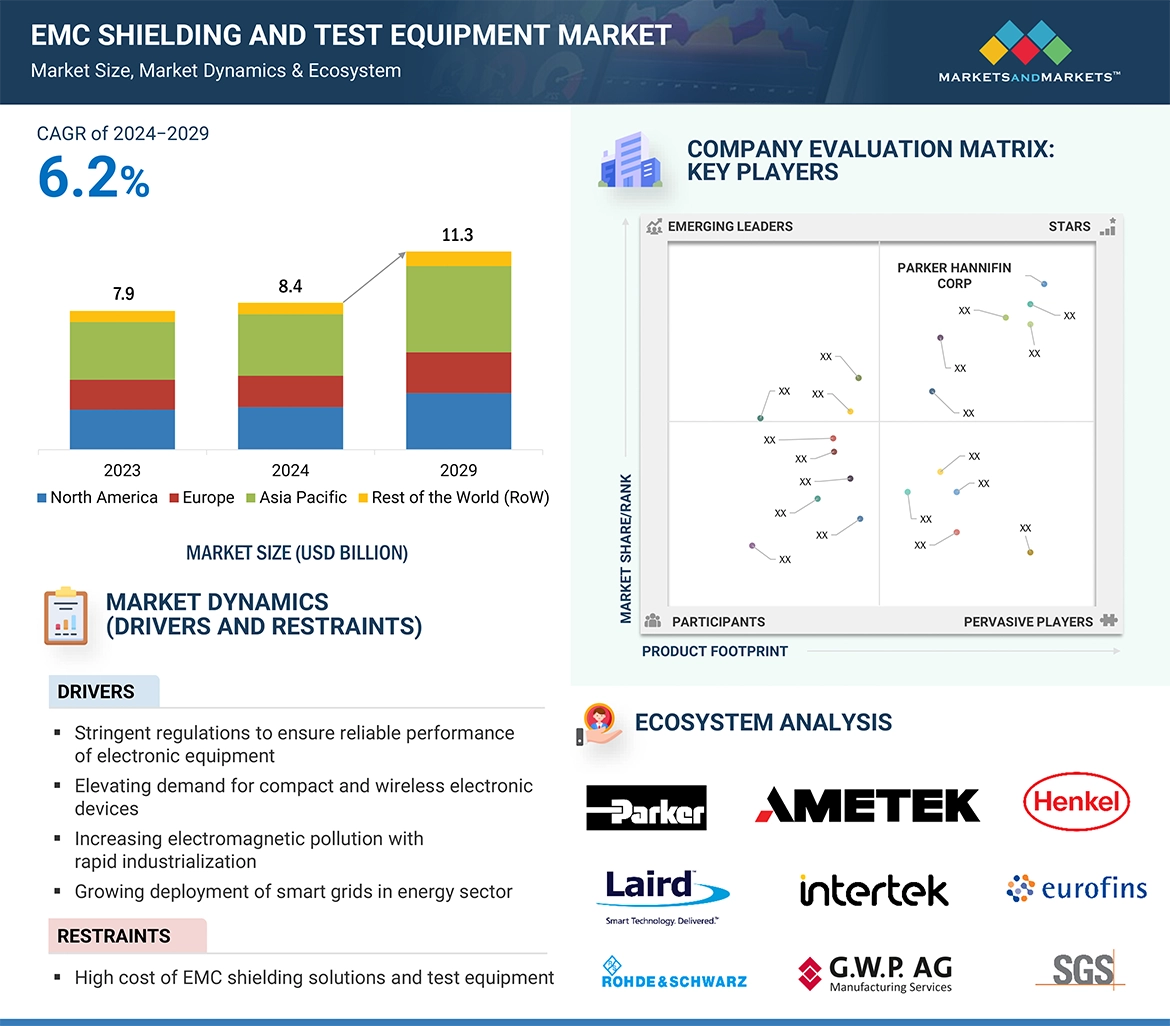
EMC shielding, or Electromagnetic Compatibility shielding, refers to the use of materials and techniques to protect electronic devices and systems from electromagnetic interference (EMI) and radiofrequency interference (RFI). The primary goal of EMC shielding is to prevent unwanted electromagnetic emissions from interfering with the operation of electronic devices or systems and to protect them from external electromagnetic influences. EMC shielding materials can include conductive foils, metal coatings, conductive polymers, and ferrite materials. These materials are strategically applied to electronic components, enclosures, or entire devices to create a barrier that attenuates or absorbs electromagnetic radiation.
EMC test equipment refers to various instruments and devices used to assess and measure the electromagnetic compatibility of electronic products and systems. These tools ensure that electronic devices comply with industry standards and regulations related to electromagnetic emissions and susceptibility. EMC test equipment includes spectrum analyzers, EMI receivers, amplifiers, ESD generators, and RF signal generators. Each type of equipment is designed to assess different aspects of electromagnetic compatibility.
Key Stakeholders
-
EMC shielding system suppliers
-
EMC test equipment suppliers
-
EMC shielding component suppliers
-
EMC testing service providers
-
EMC regulatory bodies
-
Semiconductor component manufacturers
-
Advanced chemical material suppliers
-
End users who want to know more about EMC shielding and test equipment and the latest technological developments in this market
-
Banks, financial institutions, investors, and venture capitalists
-
Technology investors
-
Governments and financial institutions
-
Research institutes and organizations
-
Market research and consulting firms
Report Objectives
-
To describe and forecast the EMC shielding and test equipment market, in terms of value, based on type, and region
-
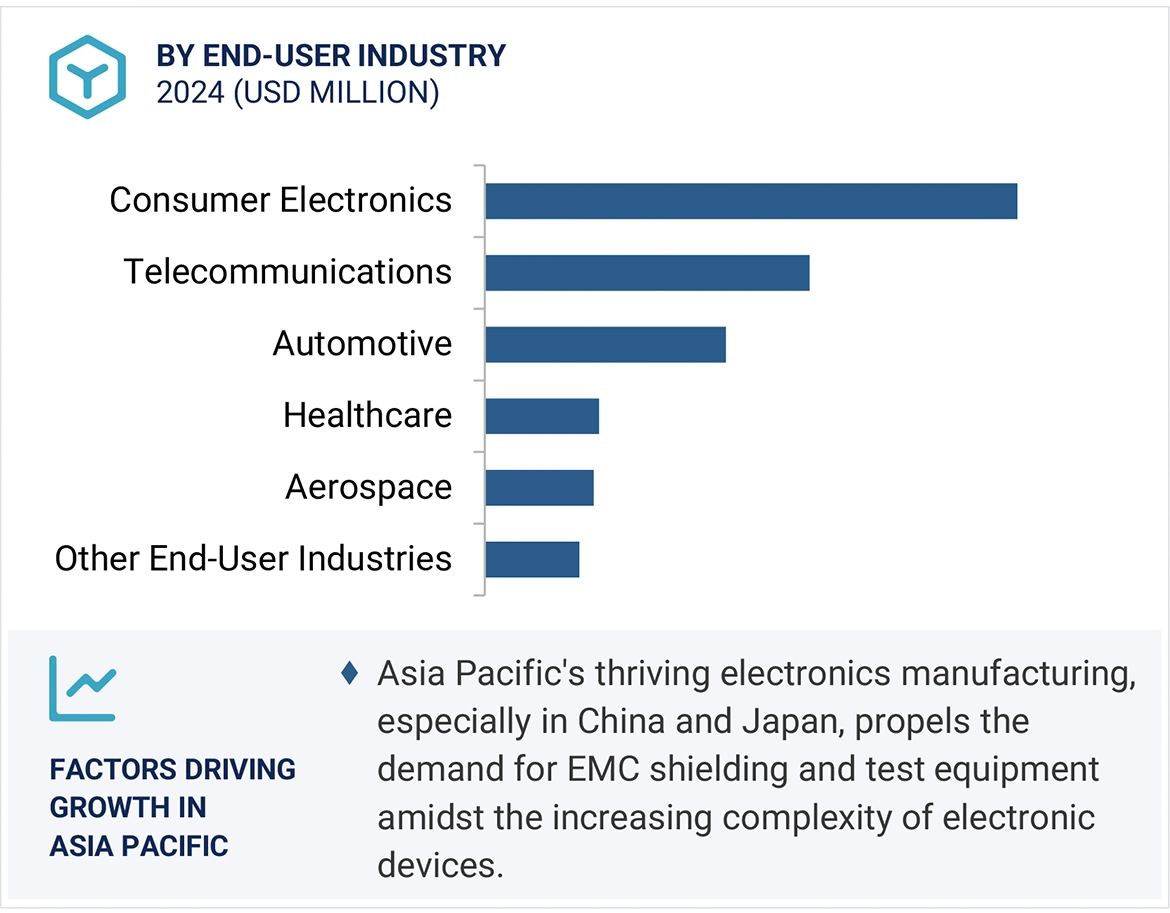
To define, describe, and forecast the global EMC shielding market on the basis of end-user industry
-
To define, describe, and forecast the global EMC test equipment market on the basis of end-user industry
-
To forecast the EMC test equipment market in terms of volume for equipment type
-
To forecast the market size, in terms of value, for various segments with regard to 4 main regions, namely, North America, Europe, Asia Pacific, and the Rest of the World (RoW)
-
To provide detailed information regarding the major factors influencing the growth of the EMC shielding and test equipment market (drivers, restraints, opportunities, and industry-specific challenges)
-
To analyze the micromarkets1 with respect to individual growth trends, prospects, and contributions to the total market
-
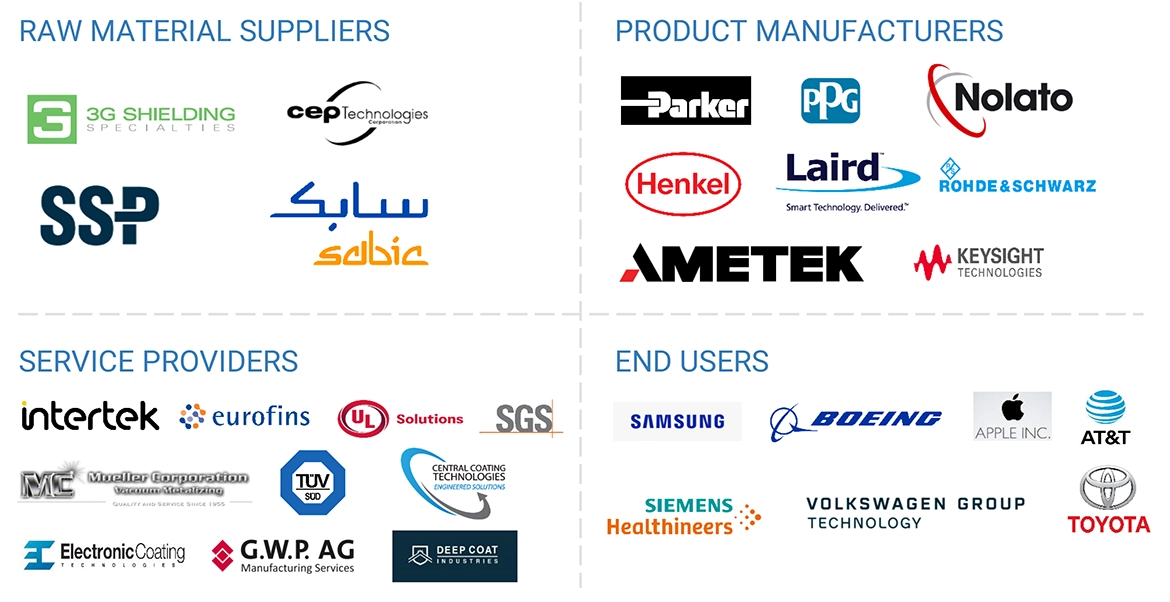
To study the complete value chain and allied industry segments, and perform a value chain analysis of the EMC shielding and test equipment landscape
-
To analyze the opportunities in the market for various stakeholders by identifying the high-growth segments of the EMC shielding and test equipment market
-
To profile the key players and comprehensively analyze their market position in terms of ranking and core competencies2, along with detailing the competitive landscape for the market leaders
-
To analyze competitive developments, such as partnerships and joint ventures, mergers and acquisitions, new product developments, expansions, and research and development, in the EMC shielding and test equipment market
-
To track and analyze competitive developments, such as partnerships, collaborations, agreements, joint ventures, mergers and acquisitions, expansions, product/service launches, and other developments in the market.
Available Customizations
With the given market data, MarketsandMarkets offers customizations according to the specific requirements of companies. The following customization options are available for the report:
-
Detailed analysis and profiling of additional market players (up to 5)
-
Additional country-level analysis of the EMC shielding and test equipment market
Product Analysis
-
Product matrix, which provides a detailed comparison of the product portfolio of each company in the EMC shielding and test equipment market.


Growth opportunities and latent adjacency in EMC Shielding and Test Equipment Market