Time-of-Flight (ToF) Sensor Market by Resolution (QQVGA, HQVGA, QVGA, & VGA), Application (Augmented Reality & Virtual Reality, LIDAR, Machine Vision, 3D Imaging & Scanning, and Robotics & Drone), Product Type, Vertical and Geography - Global Forecast to 2025


Time-of-Flight (ToF) Sensor Market Summary
The global Time-of-Flight (ToF) Sensor Market is experiencing substantial growth due to increasing demand for advanced 3D sensing technologies across consumer electronics, automotive, industrial automation, robotics, and healthcare sectors. The market was valued at approximately USD 5.4 billion in 2025 and is projected to reach nearly USD 15.8 billion by 2036, expanding at a CAGR of around 10.2% during the forecast period 2025–203.8 billion by 2036, expanding at a CAGR of around 10.2% during the forecast period 2025–2036. The rapid adoption of AI-enabled imaging systems, smart devices, autonomous vehicles, augmented reality (AR), virtual reality (VR), and industrial automation solutions is accelerating the deployment of Time-of-Flight (ToF) sensors worldwide.
The rising integration of IoT-connected devices, machine vision technologies, and intelligent sensing platforms is significantly transforming the global Time-of-Flight (ToF) Sensor Market. Manufacturers are increasingly incorporating ToF sensors into smartphones, robotics, drones, automotive safety systems, and smart factory applications to improve depth sensing, gesture recognition, object detection, and spatial awareness capabilities. In addition, digital transformation initiatives and the growth of Industry 4.0 ecosystems are driving demand for high-precision sensing technologies capable of supporting automation and real-time analytics.
The Time-of-Flight (ToF) Sensor Market is also benefiting from advancements in semiconductor manufacturing, AI-powered imaging algorithms, cloud-connected vision systems, and edge computing technologies. Increasing investments in smart infrastructure, intelligent transportation systems, and next-generation consumer electronics are expected to create significant long-term growth opportunities for market participants.
Key Market Trends & Insights
North America currently dominates the Time-of-Flight (ToF) Sensor Market due to strong adoption of AI-enabled consumer electronics, industrial automation technologies, and autonomous mobility systems.
Asia Pacific is projected to be the fastest-growing regional market owing to expanding smartphone manufacturing, increasing semiconductor production, and rising investments in smart factory infrastructure.
Indirect ToF sensors represent the dominant product segment because of their cost efficiency, compact design, and widespread adoption in smartphones and consumer electronics.
AI-powered imaging and machine vision integration are emerging as major technological trends across industrial robotics, automotive ADAS, and augmented reality applications.
The integration of ToF sensors with IoT platforms and cloud-based analytics systems is improving real-time object detection, facial recognition, and automation efficiency.
Automotive applications, particularly autonomous driving and driver monitoring systems, are expected to generate strong future demand for advanced ToF sensing technologies.
Market Size & Forecast
- Base year market size (2025): USD 5.4 billion
- Forecast market value by 2036: USD 15.8 billion
- CAGR (2025–2036): 10.2%
- Growth is driven by increasing adoption of AI, IoT, industrial automation, smart consumer electronics, and autonomous mobility technologies.
Time-of-Flight (ToF) Sensor Market Top 10 key takeaway
- North America remains the leading regional market for ToF sensors.
- Asia Pacific is expected to witness the highest growth rate through 2036.
- Consumer electronics continue to dominate application demand.
- AI-enabled imaging systems are transforming sensing capabilities.
- Industrial automation is accelerating adoption of machine vision technologies.
- Automotive ADAS integration is boosting demand for high-precision ToF sensors.
- Smart factories and Industry 4.0 are creating significant growth opportunities.
- Indirect ToF sensors account for the largest product market share.
- IoT-connected vision systems are improving real-time analytics and automation.
- Miniaturization and low-power sensor technologies are becoming major innovation priorities.
Product Insights
Indirect Time-of-Flight sensors currently dominate the Time-of-Flight (ToF) Sensor Market due to their compact size, lower production cost, and high compatibility with consumer electronic devices. These sensors are widely integrated into smartphones, tablets, laptops, gaming systems, and wearable devices for applications such as facial recognition, gesture control, portrait imaging, and augmented reality experiences. Their ability to deliver accurate depth sensing while maintaining energy efficiency has significantly contributed to their widespread adoption.
Direct ToF sensors are also gaining substantial momentum, particularly in industrial automation, automotive, robotics, and autonomous navigation applications. These sensors offer higher precision and longer-range measurement capabilities, making them suitable for LiDAR systems, industrial machine vision, warehouse automation, and advanced driver assistance systems (ADAS). As industries increasingly adopt AI-driven automation platforms, the demand for direct ToF sensing solutions is expected to rise steadily.
Emerging product categories within the Time-of-Flight (ToF) Sensor Market include ultra-low-power ToF sensors, AI-integrated imaging modules, and miniaturized 3D sensing solutions designed for next-generation IoT devices. Sensor manufacturers are focusing on integrating advanced semiconductor technologies, edge AI processing, and multi-camera synchronization capabilities to enhance performance and enable real-time environmental analysis.
The growing integration of ToF sensors with AR/VR devices, smart home systems, drones, and autonomous robots is expected to create substantial market opportunities during the forecast period. In addition, advancements in semiconductor packaging and photonics technologies are improving sensing range, accuracy, and power efficiency.
Technology / Component Insights
The Time-of-Flight (ToF) Sensor Market is driven by rapid advancements in 3D imaging technologies, semiconductor innovation, AI-powered analytics, and machine vision systems. Key technologies influencing the market include infrared illumination, CMOS image sensors, depth sensing algorithms, and laser-based ranging systems. Multi-zone sensing capabilities and high-speed image processing are becoming increasingly important for industrial and automotive applications.
Artificial intelligence plays a critical role in enhancing ToF sensor functionality. AI-based algorithms improve depth mapping, object classification, gesture recognition, facial authentication, and spatial analysis. Machine learning technologies are also enabling predictive automation, adaptive imaging optimization, and intelligent environmental sensing across multiple industries.
The integration of IoT and cloud computing technologies is significantly expanding the functionality of ToF sensors. Cloud-connected vision platforms enable real-time monitoring, remote diagnostics, and large-scale data analysis for smart manufacturing, logistics, and surveillance applications. Edge computing integration further enhances response times and reduces latency in autonomous systems.
Automation technologies are another major growth driver within the Time-of-Flight (ToF) Sensor Market. Smart factories increasingly rely on ToF-enabled robotics, autonomous guided vehicles (AGVs), and industrial inspection systems to improve productivity and operational accuracy. In healthcare, ToF sensors are supporting advanced medical imaging, patient monitoring, and contactless diagnostics solutions.
Future innovation trends are expected to include AI-assisted depth sensing, solid-state LiDAR integration, low-power photonic sensors, and next-generation 3D vision platforms for autonomous mobility and immersive digital experiences.
Application Insights
Consumer electronics remain the leading application segment in the Time-of-Flight (ToF) Sensor Market due to increasing integration of 3D sensing technologies in smartphones, tablets, laptops, gaming consoles, and wearable devices. Smartphone manufacturers are extensively using ToF sensors to enhance camera functionality, facial recognition accuracy, AR experiences, and photography quality. The continuous evolution of smart consumer devices is expected to sustain strong market demand.
The automotive segment is emerging as one of the fastest-growing application areas for ToF sensors. Advanced driver assistance systems, driver monitoring solutions, autonomous parking technologies, and collision avoidance systems increasingly rely on precise depth sensing capabilities. The transition toward autonomous vehicles and connected transportation ecosystems is expected to significantly accelerate demand for automotive-grade ToF sensors.
Industrial automation and robotics applications are also witnessing rapid growth. ToF sensors are widely used in warehouse automation, machine vision systems, industrial inspection, and collaborative robotics. The expansion of Industry 4.0 initiatives and smart manufacturing infrastructure is creating substantial opportunities for advanced sensing technologies.
Healthcare applications are gaining traction as hospitals and medical device manufacturers adopt ToF-enabled imaging and contactless monitoring systems. In addition, augmented reality, virtual reality, drones, and smart home systems are contributing to the expanding application landscape of the Time-of-Flight (ToF) Sensor Market.
Regional Insights
North America leads the global Time-of-Flight (ToF) Sensor Market due to strong technological infrastructure, high adoption of AI-driven imaging systems, and significant investments in autonomous mobility and industrial automation. The United States remains the primary contributor in the region, supported by leading semiconductor manufacturers, consumer electronics companies, and automotive technology innovators. Increasing adoption of smart devices and machine vision systems continues to drive regional market growth.
Europe maintains a strong market presence owing to rising deployment of industrial robotics, smart manufacturing technologies, and automotive safety systems. Countries such as Germany and France are investing heavily in Industry 4.0 infrastructure, intelligent transportation systems, and AI-powered automation platforms. The region also benefits from strong automotive engineering and semiconductor research capabilities.
Asia Pacific is projected to record the fastest growth during the forecast period due to expanding electronics manufacturing, rising smartphone demand, and increasing investments in semiconductor fabrication facilities. China, Japan, South Korea, and India are major contributors to regional market expansion. Government support for smart city initiatives, digital transformation programs, and industrial automation is further accelerating adoption of Time-of-Flight sensing technologies.
Latin America and the Middle East & Africa are gradually increasing adoption of ToF sensors across security systems, industrial automation, and smart infrastructure projects.
- North America dominates due to strong AI and semiconductor ecosystems.
- Asia Pacific is expected to achieve the highest CAGR through 2036.
- Europe benefits from advanced automotive and industrial automation industries.
- China and Japan remain major manufacturing hubs for ToF-enabled devices.
- Smart city development projects are accelerating global adoption.
Country-Specific Market Trends
China is witnessing rapid expansion in the Time-of-Flight (ToF) Sensor Market with a projected CAGR of approximately 11.8% through 2036. Strong electronics manufacturing capabilities, rising smartphone production, and government-backed semiconductor initiatives are driving market growth. Chinese companies are increasingly integrating ToF sensors into smartphones, robotics, and industrial automation systems.
Japan continues to invest heavily in robotics, automotive innovation, and advanced imaging technologies. Japanese manufacturers are incorporating ToF sensors into industrial robots, autonomous vehicles, and medical imaging equipment to enhance precision and automation capabilities.
The United States remains the largest individual market globally with a CAGR of around 9.5%, supported by strong investments in AI-enabled imaging systems, consumer electronics innovation, and autonomous driving technologies. The presence of leading semiconductor and technology companies further strengthens market development.
Canada is experiencing increasing demand for ToF sensing technologies across healthcare, industrial automation, and smart infrastructure projects. Government initiatives promoting AI research and digital transformation are supporting market growth.
Mexico is emerging as an important manufacturing hub for automotive electronics and smart sensor technologies due to increasing foreign investments in electronics production facilities.
Germany dominates the European market due to its leadership in automotive engineering, industrial automation, and smart factory technologies. German manufacturers are extensively deploying ToF sensors in robotics and machine vision systems.
France is witnessing growing adoption of ToF sensors in aerospace, healthcare, automotive, and industrial automation sectors. Government investments in digital innovation and AI research are supporting regional demand.
- China is the fastest-growing country market in Asia Pacific.
- The United States leads innovation in AI-enabled ToF sensing technologies.
- Germany remains a key hub for industrial automation applications.
- Japan is expanding ToF sensor integration in robotics and automotive systems.
- Mexico is strengthening its electronics manufacturing capabilities.
Key Time-of-Flight (ToF) Sensor Market Company Insights
Major companies operating in the Time-of-Flight (ToF) Sensor Market are focusing on AI integration, product miniaturization, semiconductor innovation, and strategic partnerships to strengthen their market position. Manufacturers are investing heavily in advanced 3D sensing technologies, low-power sensor architectures, and high-precision imaging systems to address increasing demand from consumer eleSony Group CorporationkeSTMicroelectronics",Infineon TechnologiesicTexas Instruments"SPanasonic Holdings Corporationtoams-OSRAMtiQualcommRAM","OmniVision Technologiescompany"]?, and ?entity?["company","OmniVision Technologies","Imaging technology company"]?.
These companies are increasingly emphasizing AI-assisted imaging, sensor fusion technologies, and integration with cloud-connected analytics platforms. Strategic collaborations with smartphone manufacturers, automotive OEMs, and industrial robotics companies are helping expand product deployment across multiple applications.
- Companies are investing heavily in AI-powered imaging solutions.
- Strategic partnerships are accelerating technology commercialization.
- Miniaturized sensor development remains a major innovation priority.
- Automotive and industrial automation sectors are key target markets.
- Cloud-connected vision systems are emerging as competitive differentiators.
Recent Developments
Several semiconductor manufacturers recently launched next-generation ToF sensor modules designed for automotive driver monitoring systems and industrial robotics applications. These solutions offer improved depth sensing accuracy, lower latency, and enhanced power efficiency.
Leading technology companies expanded AI integration capabilities within ToF imaging platforms to support advanced facial recognition, gesture detection, and autonomous navigation functionalities.
Strategic partnerships between semiconductor firms and smartphone manufacturers have increased significantly to accelerate deployment of advanced 3D sensing technologies in premium mobile devices and AR applications.
Market Segmentation
The Time-of-Flight (ToF) Sensor Market is segmented by product, technology/component, application, and region. By product, the market includes direct ToF sensors and indirect ToF sensors, with indirect ToF sensors accounting for the largest market share due to widespread adoption in consumer electronics.
Based on technology/component, the market is categorized into CMOS image sensors, infrared illumination systems, laser-based sensing technologies, and depth processing components. CMOS-based sensing technologies are widely adopted because of their scalability, cost efficiency, and integration capabilities.
By application, the market covers consumer electronics, automotive, industrial automation, healthcare, aerospace & defense, drones, robotics, and smart infrastructure. Consumer electronics currently dominate the application landscape, while automotive and industrial automation are emerging as high-growth segments.
Regionally, the market is segmented into North America, Europe, Asia Pacific, Latin America, and the Middle East & Africa. North America leads the global market, while Asia Pacific is projected to witness the fastest growth through 2036.
- Indirect ToF sensors dominate the product segment.
- CMOS technologies remain widely adopted across industries.
- Consumer electronics account for the largest application share.
- Automotive and robotics segments are growing rapidly.
- Asia Pacific is projected to deliver the highest regional growth.
Conclusion
The global Time-of-Flight (ToF) Sensor Market is poised for substantial growth through 2036 as industries increasingly adopt AI-enabled imaging systems, autonomous technologies, and smart automation platforms. The rapid expansion of consumer electronics, industrial robotics, automotive safety systems, and IoT-connected devices is significantly strengthening demand for advanced 3D sensing solutions.
Artificial intelligence, cloud computing, and edge processing technologies are expected to redefine the future capabilities of ToF sensors by enabling smarter, faster, and more precise environmental sensing. The integration of ToF technology into autonomous mobility, smart factories, healthcare imaging, and immersive digital experiences will continue to create significant business opportunities for market participants.
As digital transformation accelerates worldwide, Time-of-Flight sensing technologies will become strategically essential for enabling next-generation automation, intelligent vision systems, and real-time analytics across multiple industries.
FAQs
1. What is the current size of the Time-of-Flight (ToF) Sensor Market?
The global Time-of-Flight (ToF) Sensor Market was valued at approximately USD 5.4 billion in 2025.
2. What is the expected growth rate of the Time-of-Flight (ToF) Sensor Market?
The market is projected to grow at a CAGR of around 10.2% during the forecast period 2025–2036.
3. What are the key drivers of the Time-of-Flight (ToF) Sensor Market?
Major growth drivers include AI-enabled imaging systems, IoT expansion, industrial automation, autonomous vehicles, smart consumer electronics, and Industry 4.0 adoption.
4. Which region leads the Time-of-Flight (ToF) Sensor Market?
North America currently leads the market due to strong adoption of AI technologies, industrial automation systems, and advanced semiconductor infrastructure.
 Exclusive indicates content/data unique to MarketsandMarkets and not available with any competitors.
Table of Contents
1 Introduction (Page No. - 19)
1.1 Study Objectives
1.2 Market Definition and Scope
1.2.1 Inclusions and Exclusions
1.3 Study Scope
1.3.1 Geographic Scope
1.4 Years Considered
1.5 Currency
1.6 Limitations
1.7 Stakeholders
2 Research Methodology (Page No. - 23)
2.1 Research Data
2.1.1 Secondary Data
2.1.1.1 Major Secondary Sources
2.1.1.2 Secondary Sources
2.1.2 Primary Data
2.1.2.1 Primary Interviews With Experts
2.1.2.2 Key Data From Primary Sources
2.1.2.3 Key Industry Insights
2.1.2.4 Breakdown of Primaries
2.1.3 Secondary and Primary Research
2.2 Market Size Estimation
2.2.1 Bottom-Up Approach
2.2.1.1 Approach for Capturing Market Size By Bottom-Up Analysis(Demand Side)
2.2.2 Top-Down Approach
2.2.2.1 Approach for Capturing Market Size By Top-Down Analysis (Supply Side)
2.3 Market Breakdown and Data Triangulation
2.4 Research Assumptions
3 Executive Summary (Page No. - 33)
4 Premium Insights (Page No. - 37)
4.1 Attractive Opportunities in Time-of-Flight Sensor Market
4.2 Time-of-Flight Sensor Market, By Resolution
4.3 Time-of-Flight Sensor Market, By Application
4.4 Time-of-Flight Sensor Market in APAC, By Vertical and Country
4.5 Time-of-Flight Sensor Market, By Country
5 Market Overview (Page No. - 40)
5.1 Introduction
5.2 Market Dynamics
5.2.1 Drivers
5.2.1.1 Increasing Adoption of ToF Sensors in Automobile Applications
5.2.1.2 Increasing Demand for Smartphones Enabled With 3D Cameras
5.2.2 Restraints
5.2.2.1 Extra Costs Associated With Sensor Solutions
5.2.3 Opportunities
5.2.3.1 Increasing Adoption of 3D Machine Vision Systems Across Various Industries
5.2.3.2 Growing Deployment of Industry 4.0
5.2.4 Challenges
5.2.4.1 Fluctuations in Raw Material Prices
5.3 Value Chain Analysis
6 Time-of-Flight Sensor Market, By Device Type (Page No. - 46)
6.1 Introduction
6.2 RF-Modulated Light Sources With Phase Detectors
6.3 Range-Gated Imagers
6.4 Direct Time-of-Flight Imagers
7 Time-of-Flight Sensor Market, By Resolution (Page No. - 49)
7.1 Introduction
7.2 Quarter Quarter Video Graphics Array
7.2.1 Aptness of QQVGA ToF Sensors for Handheld Devices
7.3 Half Quarter Video Graphics Array
7.3.1 Emergence of HQVGA ToF Sensors in Smartphone and Gaming Applications
7.4 Quarter Video Graphics Array
7.4.1 High Adopttion of QVGA ToF Sensors in Electronic Devices
7.5 Video Graphics Array
7.5.1 VGA Holds Second-Largest Market for ToF Sensors
8 Time-of-Flight Sensor Market, By Application (Page No. - 53)
8.1 Introduction
8.2 AR and VR
8.2.1 Increasing Use of AR and VR Technology-Based Systems in Education, Healthcare, and Entertainment Applications Drives Demand for ToF Sensors
8.3 LiDAR
8.3.1 Increasing Adoption of LiDAR Technology in Automobiles, Retail Stores, and Manufacturing Plants to Surge Demand for ToF Sensors
8.4 Machine Vision
8.4.1 Growing Deployment of Time-of-Flight Sensors in 3D Machine Vision Systems Propel ToF Sensor Market Growth
8.5 3D Imaging and Scanning
8.5.1 Rising Deployment of ToF Sensors in 3D Imaging and Scanning Applications Would Enable This Application to Account for Largest Market Size
8.6 Robotics and Drone
8.6.1 Engaging Participation of Companies in Developing and Promoting 3D ToF Sensor-Based Industrial Robotics Driving Adoption of ToF Sensors for Robotics and Drone Applications
9 Time-of-Flight Sensor Market, By Vertical (Page No. - 68)
9.1 Introduction
9.2 Automotive
9.2.1 Adoption of ToF Sensors to Enhance In-Cab Applications
9.3 Consumer Electronics
9.3.1 Consumer Electronics Vertical to Witness Highest Growth Rate During Forecast Period
9.3.1.1 Smartphones and Tablets
9.3.1.2 Wearables
9.4 Gaming & Entertainment
9.4.1 Use of Gaming Consoles Enabled With Gesture and Motion Tracking Sensors to Accelerate ToF Sensor Market Growth
9.5 Industrial
9.5.1 Implementation of ToF Sensors in Industrial Automation Processes to Fuel ToF Sensor Market Growth During Forecast Period
9.6 Healthcare
9.6.1 Deployment of High-Resolution 3D Cameras in Increasing Number of Treatments and Procedures to Foster ToF Sensor Market Growth
9.7 Aerospace & Defense
9.7.1 Need for 3D Machine Vision Systems in Aerospace & Defense Vertical Boosts Adoption of ToF Sensors
10 Geographic Analysis (Page No. - 85)
10.1 Introduction
10.2 North America
10.2.1 US
10.2.1.1 US to Remain Largest Market for ToF Sensors in North America
10.2.2 Canada
10.2.2.1 Manufacturing and Automotive Industries Likely to Fuel Demand for ToF Sensors in Canada
10.2.3 Mexico
10.2.3.1 Improvement in Manufacturing Infrastructure in Mexico Create Demand for ToF Sensors
10.3 Europe
10.3.1 UK
10.3.1.1 Automotive Industry and Industrial Automation to Drive Growth of ToF Sensor Market in UK
10.3.2 Germany
10.3.2.1 Germany Held Largest Share of European ToF Sensor Market in 2019
10.3.3 France
10.3.3.1 Automotive and Healthcare Companies to Drive Growth of ToF Sensor Market in France
10.3.4 Rest of Europe
10.4 APAC
10.4.1 China
10.4.1.1 China Held Largest Share of ToF Sensor Market in APAC in 2019
10.4.2 Japan
10.4.2.1 Presence of Well-Established Automotive and Consumer Electronics Industries Projected to Augment Growth of ToF Sensor Market in Japan
10.4.3 South Korea
10.4.3.1 Flourished Consumer Electronics Industry in Country to Propel Growth of ToF Sensor Market in South Korea
10.4.4 India
10.4.4.1 ToF Sensor Market in India Expected to Grow at Highest Rate From 2020 to 2025
10.4.5 Rest of APAC
10.5 RoW
10.5.1 Middle East and Africa
10.5.1.1 ToF Sensor Market in Middle East and Africa Projected to Grow at Higher CAGR Than That of in South America From 2020 to 2025
10.5.2 South America
10.5.2.1 South America Held Smaller Share of ToF Sensor Market in 2019 Than That of Middle East and Africa
11 Competitive Landscape (Page No. - 114)
11.1 Introduction
11.2 Market Player Ranking Analysis
11.3 Competitive Leadership Mapping
11.3.1 Visionary Leaders
11.3.2 Dynamic Differentiators
11.3.3 Innovators
11.3.4 Emerging Companies
11.4 Competitive Benchmarking
11.4.1 Strength of Product Portfolio (25 Companies)
11.4.2 Business Strategy Excellence (25 Companies)
11.5 Competitive Scenario
11.6 Competitive Situations and Trends
11.6.1 Product Launches and Developments
11.6.2 Acquisitions
11.6.3 Collaborations/Agreements/Partnerships
11.6.4 Expansions
12 Company Profiles (Page No. - 127)
(Business Overview, Products Offered, Recent Developments, SWOT Analysis, and MnM View)*
12.1 Key Players
12.1.1 Texas Instruments Incorporated
12.1.2 STMicroelectronics N.V.
12.1.3 Infineon Technologies
12.1.4 Panasonic Corporation
12.1.5 Melexis
12.1.6 Teledyne Technologies Incorporated
12.1.7 pmd Technologies AG
12.1.8 Keyence Corporation
12.1.9 Sharp Corporation
12.1.10 Sony Corporation
12.2 Right to Win
12.2.1 STMicroelectronics (Switzerland)
12.2.2 Texas Instruments (US)
12.2.3 Infineon Technologies (Germany)
12.2.4 Panasonic Corporation (Japan)
12.2.5 Melexis (Belgium)
12.3 Other Companies
12.3.1 AMS AG
12.3.2 Broadcom Inc. (Avago)
12.3.3 Omron Corporation
12.3.4 Renesas Electronics
12.3.5 Espros Photonics
12.3.6 Adafruit Industries
12.3.7 Sparkfun Electronics
12.3.8 Terabee
12.3.9 Chirp Microsystems, Inc. (Tdk Corporation)
12.3.10 Lucid Vision Labs, Inc.
*Details on Business Overview, Products Offered, Recent Developments, SWOT Analysis, and MnM View Might Not Be Captured in Case of Unlisted Companies.
13 Appendix (Page No. - 168)
13.1 Discussion Guide
13.2 Knowledge Store: Marketsandmarkets’ Subscription Portal
13.3 Available Customizations
13.4 Related Reports
13.5 Author Details
List of Tables (105 Tables)
Table 1 Time-of-Flight Sensor Market, By Device Type, 2017–2025 (USD Million)
Table 2 Market, By Resolution, 2017–2025 (USD Million)
Table 3 Market, By Application, 2017–2025 (USD Million)
Table 4 Market for AR and VR Applications, By Region, 2017–2025 (USD Million)
Table 5 Market in North America for AR and VR Applications, By Country, 2017–2025 (USD Million)
Table 6 Market in Europe for AR and VR Applications, By Country, 2017–2025 (USD Million)
Table 7 Market in APAC for AR and VR Applications, By Country, 2017–2025 (USD Million)
Table 8 Market in RoW for AR and VR Applications, By Region, 2017–2025 (USD Million)
Table 9 Market for LiDAR Applications, By Region, 2017–2025 (USD Million)
Table 10 Market in North America for LiDAR Applications, By Country, 2017–2025 (USD Million)
Table 11 Market in Europe for LiDAR Application, By Country, 2017–2025 (USD Million)
Table 12 Market in APAC for LiDAR Applications, By Country, 2017–2025 (USD Million)
Table 13 Time-of-Flight Sensor Market in RoW for LiDAR Applications, By Region, 2017–2025 (USD Million)
Table 14 Market for Machine Vision Applications, By Region, 2017–2025 (USD Million)
Table 15 Market in North America for Machine Vision Applications, By Country, 2017–2025 (USD Million)
Table 16 Market in Europe for Machine Vision Applications, By Country, 2017–2025 (USD Million)
Table 17 Market in APAC for Machine Vision Applications, By Country, 2017–2025 (USD Million)
Table 18 Market in RoW for Machine Vision Applications, By Region, 2017–2025 (USD Million)
Table 19 Market for 3D Imaging and Scanning Applications, By Region, 2017–2025 (USD Million)
Table 20 Market in North America for 3D Imaging and Scanning Applications, By Country, 2017–2025 (USD Million)
Table 21 Market in Europe for 3D Imaging and Scanning Applications, By Country, 2017–2025 (USD Million)
Table 22 Market in APAC for 3D Imaging and Scanning Applications, By Country, 2017–2025 (USD Million)
Table 23 Market in RoW for 3D Imaging and Scanning Applications, By Region, 2017–2025 (USD Million)
Table 24 Market for Robotics and Drone Applications, By Region, 2017–2025 (USD Million)
Table 25 Market in North America for Robotics and Drone Applications, By Country, 2017–2025 (USD Million)
Table 26 Market in Europe for Robotics and Drone Applications, By Country, 2017–2025 (USD Million)
Table 27 Time-of-Flight Sensor Market in APAC for Robotics and Drone Applications, By Country, 2017–2025 (USD Million)
Table 28 Market in RoW for Robotics and Drone Applications, By Region, 2017–2025 (USD Million)
Table 29 Market, By Vertical, 2017–2025 (USD Million)
Table 30 Market for Automotive Vertical, By Region, 2017–2025 (USD Million)
Table 31 Market in North America for Automotive Vertical, By Country, 2017–2025 (USD Million)
Table 32 Market in Europe for Automotive Vertical, By Country, 2017–2025 (USD Million)
Table 33 Market in APAC for Automotive Vertical, By Country, 2017–2025 (USD Million)
Table 34 Market in RoW for Automotive Vertical, By Region, 2017–2025 (USD Million)
Table 35 Market for Consumer Electronics Vertical, By Region, 2017–2025 (USD Million)
Table 36 Time-of-Flight Sensor Market in North America for Consumer Electronics Vertical, By Country, 2017–2025 (USD Million)
Table 37 Market in Europe for Consumer Electronics Vertical, By Country, 2017–2025 (USD Million)
Table 38 Market in APAC for Consumer Electronics Vertical, By Country, 2017–2025 (USD Million)
Table 39 Market in RoW for Consumer Electronics Vertical, By Region, 2017–2025 (USD Million)
Table 40 Market for Gaming & Entertainment Vertical, By Region, 2017–2025 (USD Million)
Table 41 Time-of-Flight Sensor Market in North America for Gaming & Entertainment Vertical, By Country, 2017–2025 (USD Million)
Table 42 Time-of-Flight Sensor Market in Europe for Gaming & Entertainment Vertical, By Country, 2017–2025 (USD Million)
Table 43 Market in APAC for Gaming & Entertainment Vertical, By Country, 2017–2025 (USD Million)
Table 44 Time-of-Flight Sensor Market in RoW for Gaming & Entertainment Vertical, By Region, 2017–2025 (USD Million)
Table 45 Time-of-Flight Sensor Market for Industrial Vertical, By Region, 2017–2025 (USD Million)
Table 46 Market in North America for Industrial Vertical, By Country, 2017–2025 (USD Million)
Table 47 Market in Europe for Industrial Vertical, By Country, 2017–2025 (USD Million)
Table 48 Time-of-Flight Sensor Market in APAC for Industrial Vertical, By Country, 2017–2025 (USD Million)
Table 49 Time-of-Flight Sensor Market in RoW for Industrial Vertical, By Region, 2017–2025 (USD Million)
Table 50 Time-of-Flight Sensor Market for Healthcare Vertical, By Region, 2017–2025 (USD Million)
Table 51 Time-of-Flight Sensor Market in North America for Healthcare Vertical, By Country, 2017–2025 (USD Million)
Table 52 Time-of-Flight Sensor Market in Europe for Healthcare Vertical, By Country, 2017–2025 (USD Million)
Table 53 Time-of-Flight Sensor Market in APAC for Healthcare Vertical, By Country, 2017–2025 (USD Million)
Table 54 Time-of-Flight Sensor Market in RoW for Healthcare Vertical, By Region, 2017–2025 (USD Million)
Table 55 Time-of-Flight Sensor Market for Aerospace & Defense Vertical, By Region, 2017–2025 (USD Million)
Table 56 Time-of-Flight Sensor Market in North America for Aerospace & Defense Vertical, By Country, 2017–2025 (USD Million)
Table 57 Time-of-Flight Sensor Market in Europe for Aerospace & Defense Vertical, By Country, 2017–2025 (USD Million)
Table 58 Time-of-Flight Sensor Market in APAC for Aerospace & Defense Vertical, By Country, 2017–2025 (USD Million)
Table 59 Time-of-Flight Sensor Market in RoW for Aerospace & Defense Vertical, By Region, 2017–2025 (USD Million)
Table 60 Time-of-Flight Sensor Market, in Terms of Value and Volume, 2017–2025
Table 61 Time-of-Flight Sensor Market, By Region, 2017–2025 (USD Million)
Table 62 Time-of-Flight Sensor Market in North America, By Application, 2017–2025 (USD Million)
Table 63 Time-of-Flight Sensor Market in North America, By Vertical, 2017–2025 (USD Million)
Table 64 Time-of-Flight Sensor Market in North America, By Country, 2017–2025 (USD Million)
Table 65 Time-of-Flight Sensor Market in US, By Application, 2017–2025 (USD Million)
Table 66 Time-of-Flight Sensor Market in US, By Vertical, 2017–2025 (USD Million)
Table 67 Time-of-Flight Sensor Market in Canada, By Application, 2017–2025 (USD Million)
Table 68 Time-of-Flight Sensor Market in Canada, By Vertical, 2017–2025 (USD Million)
Table 69 Time-of-Flight Sensor Market in Mexico, By Application, 2017–2025 (USD Million)
Table 70 Time-of-Flight Sensor Market in Mexico, By Vertical, 2017–2025 (USD Million)
Table 71 Time-of-Flight Sensor Market in Europe, By Application, 2017–2025 (USD Million)
Table 72 Time-of-Flight Sensor Market in Europe, By Vertical, 2017–2025 (USD Million)
Table 73 Time-of-Flight Sensor Market in Europe, By Country, 2017–2025 (USD Million)
Table 74 Time-of-Flight Sensor Market in UK, By Application, 2017–2025 (USD Million)
Table 75 Time-of-Flight Sensor Market in UK, By Vertical, 2017–2025 (USD Million)
Table 76 Time-of-Flight Sensor Market in Germany, By Application, 2017–2025 (USD Million)
Table 77 Time-of-Flight Sensor Market in Germany, By Vertical, 2017–2025 (USD Million)
Table 78 Time-of-Flight Sensor Market in France, By Application, 2017–2025 (USD Million)
Table 79 Time-of-Flight Sensor Market in France, By Vertical, 2017–2025 (USD Million)
Table 80 Time-of-Flight Sensor Market in Rest of Europe, By Application, 2017–2025 (USD Million)
Table 81 Time-of-Flight Sensor Market in Rest of Europe, By Vertical, 2017–2025 (USD Million)
Table 82 Time-of-Flight Sensor Market in APAC, By Application, 2017–2025 (USD Million)
Table 83 Time-of-Flight Sensor Market in APAC, By Vertical, 2017–2025 (USD Million)
Table 84 Time-of-Flight Sensor Market in APAC, By Country, 2017–2025 (USD Million)
Table 85 Time-of-Flight Sensor Market in China, By Application, 2017–2025 (USD Million)
Table 86 Time-of-Flight Sensor Market in China, By Vertical, 2017–2025 (USD Million)
Table 87 Time-of-Flight Sensor Market in Japan, By Application, 2017–2025 (USD Million)
Table 88 Time-of-Flight Sensor Market in Japan, By Vertical, 2017–2025 (USD Million)
Table 89 Time-of-Flight Sensor Market in South Korea, By Application, 2017–2025 (USD Million)
Table 90 Time-of-Flight Sensor Market in South Korea, By Vertical, 2017–2025 (USD Million)
Table 91 Time-of-Flight Sensor Market in India, By Application, 2017–2025 (USD Million)
Table 92 Time-of-Flight Sensor Market in India, By Vertical, 2017–2025 (USD Million)
Table 93 Time-of-Flight Sensor Market in Rest of APAC, By Application, 2017–2025 (USD Million)
Table 94 Time-of-Flight Sensor Market in Rest of APAC, By Vertical, 2017–2025 (USD Million)
Table 95 Time-of-Flight Sensor Market in RoW, By Application, 2017–2025 (USD Million)
Table 96 Time-of-Flight Sensor Market in RoW, By Vertical, 2017–2025 (USD Million)
Table 97 Time-of-Flight Sensor Market in RoW, By Region, 2017–2025 (USD Million)
Table 98 Time-of-Flight Sensor Market in Middle East & Africa, By Application, 2017–2025 (USD Million)
Table 99 Time-of-Flight Sensor Market in Middle East & Africa, By Vertical, 2017–2025 (USD Million)
Table 100 Time-of-Flight Sensor Market in South America, By Application, 2017–2025 (USD Million)
Table 101 Time-of-Flight Sensor Market in South America, By Vertical, 2017–2025 (USD Million)
Table 102 Product Launches and Developments (2016–2019)
Table 103 Acquisitions (2017)
Table 104 Collaborations/Agreements/Partnerships (2016–2019)
Table 105 Expansions (2016–2019)
List of Figures (44 Figures)
Figure 1 Time-of-Flight Sensor Market Segmentation
Figure 2 Time-of-Flight) Sensor Market: Research Design
Figure 3 Market Size Estimation Methodology: Bottom-Up Approach
Figure 4 Market Size Estimation Methodology: Top-Down Approach
Figure 5 Data Triangulation
Figure 6 Assumptions for Research Study
Figure 7 Time-of-Flight Sensor Market, 2017–2025 (USD Billion)
Figure 8 Time-of-Flight Sensor Market, By Resolution (2020 vs 2025)
Figure 9 3D Imaging and Scanning Application to Capture Largest Size of Time-of-Flight Sensor Market in 2025
Figure 10 Time-of-Flight Sensor Market for Consumer Electronics Vertical to Grow at Highest CAGR From 2020 to 2025
Figure 11 APAC to Hold Largest Share of Time-of-Flight Sensor Market in 2020
Figure 12 Increasing Adoption of 3D Cameras in Smartphones to Boost Time-of-Flight Sensor Market During Forecast Period
Figure 13 Market for QVGA Time-of-Flight Sensors to Grow at Highest CAGR From 2020 to 2025
Figure 14 3D Imaging and Scanning Application to Hold Largest Size of Time-of-Flight Sensor Market in 2025
Figure 15 Consumer Electronics and China Accounted for Largest Share of Time-of-Flight Sensor Market in APAC in 2019
Figure 16 India to Exhibit Highest CAGR in Time-of-Flight Market From 2020 to 2025
Figure 17 Impact of Drivers and Opportunities on Time-of-Flight Sensor Market
Figure 18 Impact of Challenges and Restraints on Time-of-Flight Sensor Market
Figure 19 Global Mobile Subscriptions From 2011 to 2017 (Billion)
Figure 20 Major Value Added By Raw Material Suppliers and Original Equipment Manufacturers & System Integrators
Figure 21 Time-of-Flight Market, By Device Types
Figure 22 QVGA Time-of-Flight Sensor Market to Grow at Highest CAGR During Forecast Period
Figure 23 AR & VR Applications to Exhibit Highest CAGR in Time-of-Flight Sensor Market From 2020 to 2025
Figure 24 APAC to Lead Time-of-Flight Sensor Market for 3D Scanning and Imaging Applications From 2020 to 2025
Figure 25 Consumer Electronics Vertical to Lead Time-of-Flight Sensor Market From 2020 to 2025
Figure 26 APAC to Dominate Time-of-Flight Sensor Market for Industrial Vertical From 2020 to 2025
Figure 27 Geographic Snapshot: Time-of-Flight Sensor Market in APAC to Exhibit Highest CAGR From 2020 to 2025
Figure 28 APAC to Lead Overall Time-of-Flight Sensor Market During Forecast Period
Figure 29 North America: Time-of-Flight Sensor Market Snapshot
Figure 30 Europe: Time-of-Flight Sensor Market Snapshot
Figure 31 APAC: ToF Sensor Market Snapshot
Figure 32 Companies Adopted Product Launches and Developments as Key Growth Strategies During 2016–2019
Figure 33 Ranking Analysis of Top 5 Players in Time-Of-Flight Market, 2018
Figure 34 Time-of-Flight Sensor Market (Global) Competitive Leadership Mapping, 2019
Figure 35 Evaluation Framework: Time-of-Flight Sensor Market
Figure 36 Texas Instruments Incorporated: Company Snapshot
Figure 37 STMicroelectronics N.V.: Company Snapshot
Figure 38 Infineon Technologies: Company Snapshot
Figure 39 Panasonic Corporation: Company Snapshot
Figure 40 Melexis: Company Snapshot
Figure 41 Teledyne Technologies Incorporated: Company Snapshot
Figure 42 Keyence Corporation: Company Snapshot
Figure 43 Sharp Corporation: Company Snapshot
Figure 44 Sony Corporation: Company Snapshot
The study involved 4 major activities in estimating the current size of the time-of-flight (ToF) sensor market. Exhaustive secondary research has been done to collect information on the market, the peer market, and the parent market. The next step has been to validate these findings, assumptions, and sizing with industry experts from across the value chain through primary research. Both top-down and bottom-up approaches have been employed to estimate the complete market size. After that, the market breakdown and data triangulation methods have been used to estimate the market size of segments and subsegments.
Secondary Research
The research methodology used to estimate and forecast the ToF sensor market begins with capturing data on the revenues of key vendors in the market through secondary research. This study involves the use of extensive secondary sources, directories, and databases such as Hoovers, Bloomberg Businessweek, Factiva, and OneSource to identify and collect information useful for the technical, market-oriented, and commercial study of the ToF sensor market. Vendor offerings have also been taken into consideration to determine the market segmentation. This entire research methodology includes studying annual and financial reports of top players, presentations, press releases, journals, paid databases, trade directories, regulatory bodies, and safety standard organizations.
Primary Research
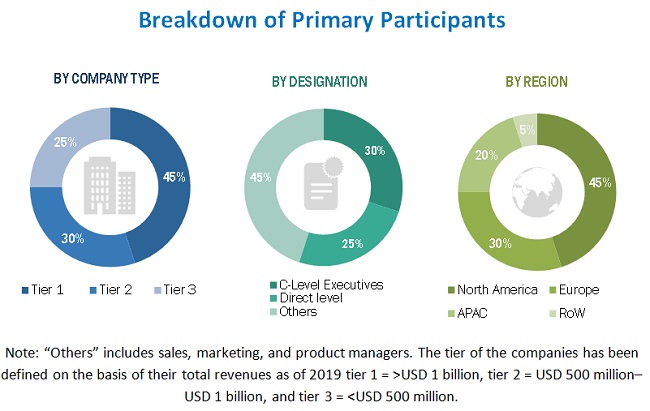
The ToF sensor market’s supply chain comprises several stakeholders, such as suppliers of raw material, original equipment manufacturers (OEMs), device manufacturers, and system integrators. The supply side is characterized by advancements in ToF sensors and their applications in diverse end-user industries. Various primary sources from both the supply and demand sides of the market have been interviewed to obtain qualitative and quantitative information. The breakdown of primary respondents is as follows.
To know about the assumptions considered for the study, download the pdf brochure
Market Size Estimation
Both top-down and bottom-up approaches have been used to estimate and validate the size of the ToF sensor market and various market subsegments. The research methodology used to estimate the market sizes includes the following:
- Key players providing ToF sensors to different industries have been identified through extensive secondary research.
- The industry’s supply chain and market size, in terms of value, have been determined through primary and secondary research processes.
- All percentage shares, splits, and breakdowns have been determined using secondary sources and verified through primary sources.
Data Triangulation
After arriving at the overall market size—using the estimation processes as explained above—the market has been split into several segments and subsegments. To complete the overall market engineering process and arrive at the exact statistics of each market segment and subsegment, data triangulation and market breakdown procedures have been employed, wherever applicable. The data has been triangulated by studying various factors and trends from both the demand and supply sides of ToF sensors.
Research Objective
- To define and forecast the overall ToF sensor market, by product type, display resolution, application, vertical, and geography, in terms of value
- To forecast the overall ToF sensor market, in terms of volume
- To describe and forecast the market size for various segments with regard to 4 main regions—North America, Europe, Asia Pacific (APAC), and Rest of the World (RoW), in terms of value
- To provide detailed information regarding the drivers, restraints, opportunities, and challenges influencing the growth of the ToF sensor market
- To provide a detailed overview of the ToF sensor value chain
- To strategically analyze micromarkets with respect to individual growth trends, prospects, and contribution to the overall ToF sensor market
- To analyze opportunities in the overall ToF sensor market for stakeholders by identifying high-growth segments
- To strategically profile key players, comprehensively analyze their market ranking and core competencies, and provide a detailed competitive landscape of market leaders
- To analyze competitive developments such as product launches and developments, agreements, partnerships, collaborations, acquisitions, expansions, and research and development (R&D) activities in the overall ToF sensor market
Available Customizations
Along with the market data, MarketsandMarkets offers customizations according to a company’s specific needs. The following customization options are available for the report:
Company Information
- Detailed analysis and profiling of additional market players (Up to 5)
Critical Questions:
- What will be the new verticals in which ToF sensors would be used?
- Who are the key players in the market, and how intense is the competition?


Growth opportunities and latent adjacency in Time-of-Flight (ToF) Sensor Market