
Time-Sensitive Networking Market Size, Share & Trends

Time-Sensitive Networking Market by Type IEEE (802.1 AS, 802.1 Qbv, 802.1 CB, 802.1 Qbu, 802.1 Qcc, 802.11 be, 802.1 CM, 802.1 Qat), Component (Switches, Hubs, Routers, Gateways, Controllers, Processor, Isolator, Convertor) - Global Forecast to 2030


OVERVIEW
Source: Secondary Research, Interviews with Experts, MarketsandMarkets Analysis
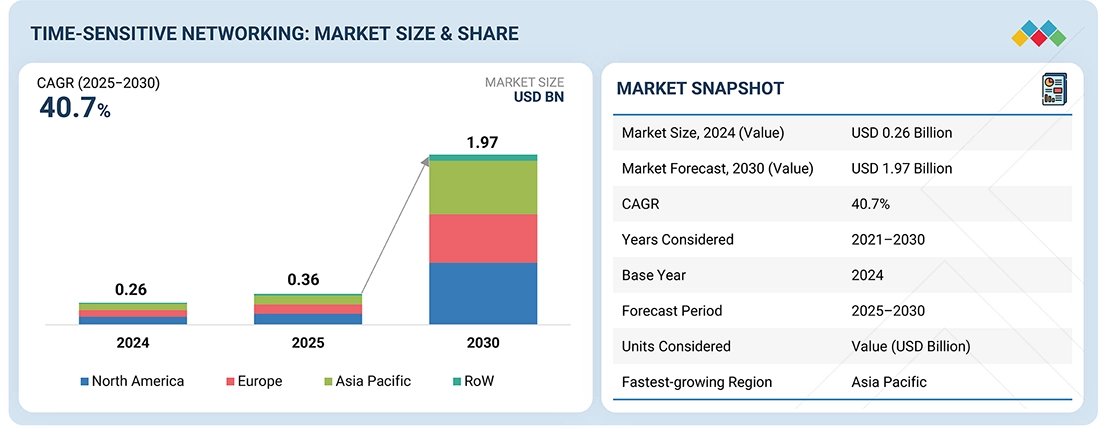
The time-sensitive networking market is projected to reach USD 1.97 billion by 2030 from USD 0.36 billion in 2025 at a CAGR of 40.7%. The demand for time-sensitive networking (TSN) is growing because industries require real-time, reliable, and low-latency communication for critical applications like autonomous vehicles, industrial automation, and smart grids. TSN enables seamless integration of multiple data streams over a single Ethernet network, reducing complexity and costs.
KEY TAKEAWAYS
-
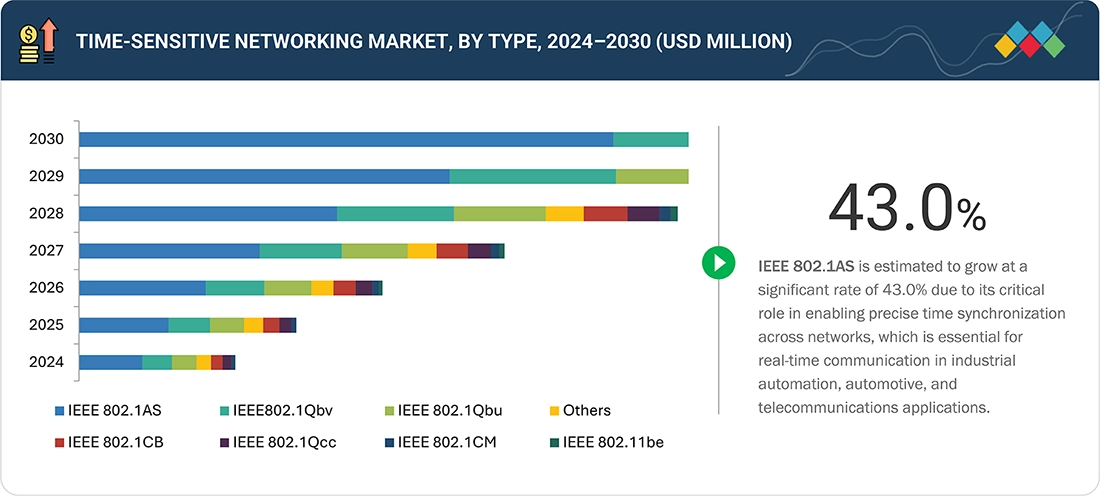
BY TYPEIEEE 802.1AS is the most widely adopted standard for time synchronization in time-sensitive networking (TSN), providing precise timing and synchronization across Ethernet networks.
-
BY COMPONENTSwitches are the most prominent TSN-enabled network devices, as they play a crucial role in managing and prioritizing time-sensitive data traffic to ensure low latency.
-
BY END USERThe industrial segment is a major driver of the TSN market due to the increasing need for real-time, deterministic communication in factory automation.
-
BY REGIONAsia Pacific is projected to be the fastest-growing region, due to its strong manufacturing base, increasing adoption of Industry 4.0 technologies, government initiatives promoting smart factories, and rising investments in automotive and industrial automation sectors.
-
COMPETITIVE LANDSCAPEThe major market players have adopted organic growth strategies, such as product launches; examples of these include Texas Instruments, Siemens, and NXP Semiconductors.
Time-sensitive networking (TSN) is projected to grow rapidly due to the increasing demand for deterministic and real-time communication across industries such as automotive, industrial automation, energy, and healthcare. The shift toward Industry 4.0, software-defined vehicles, and smart infrastructure is driving the adoption of TSN for its ability to unify control and data networks with low latency and high reliability.
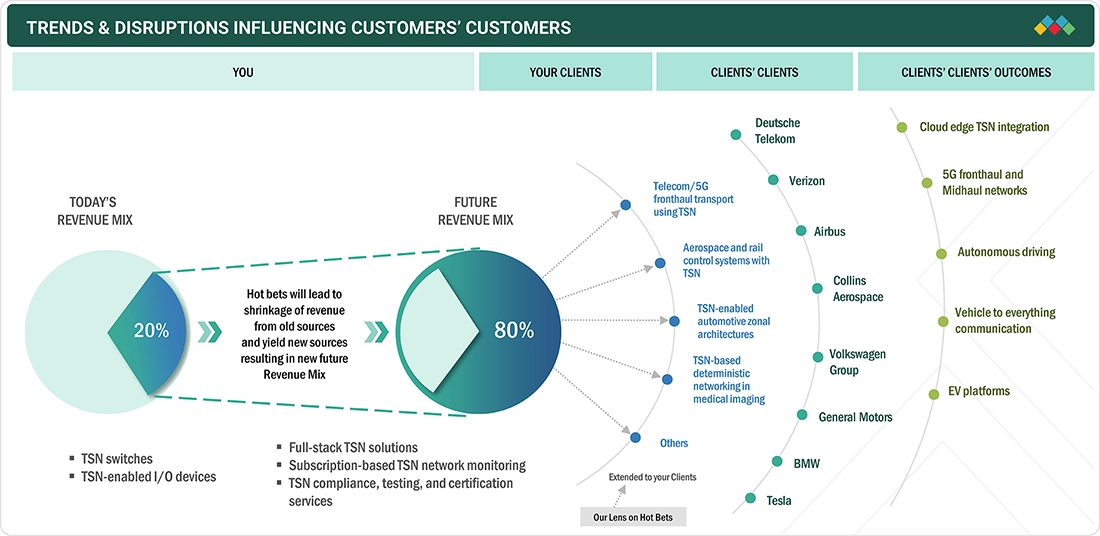
TRENDS & DISRUPTIONS IMPACTING CUSTOMERS' CUSTOMERS
Time-sensitive networking (TSN) is reshaping the industrial automation landscape as the market shifts from legacy, proprietary fieldbus systems toward unified Ethernet-based communication. A key trend is the convergence of IT and OT networks, enabling synchronized, real-time data exchange across machines, controllers, and enterprise systems. TSN is being integrated into smart factories, automotive systems, and robotics to support time-critical operations and coordinated control. The rise of edge computing and AI in automation is also driving the adoption of TSN, as it ensures deterministic performance at every level. Disruptions are evident as traditional architectures give way to flexible, software-defined systems built on TSN standards. Vendors are aligning their product roadmaps to support TSN-ready hardware and interoperable solutions, reflecting a broader market shift toward open, scalable, and future-proof network infrastructures.
Source: Secondary Research, Interviews with Experts, MarketsandMarkets Analysis
MARKET DYNAMICS
Level
-
Accelerating adoption of automation in industrial applications

-
Increasing use of edge computing across organizations

Level
-
Requirement for high capital investment to implement TSN solutions

-
Interoperability issues due to lack of unified standards

Level
-
Elevating adoption of IIoT

-
Growing prominence of CASE trends within automotive industry

Level
-
Interoperability gaps and fragmentation in TSN implementations

-
Integration challenges in TSN deployment

Source: Secondary Research, Interviews with Experts, MarketsandMarkets Analysis
Driver: Accelerating adoption of automation in industrial applications
The accelerating adoption of automation in industrial applications is a key driver for the growth of time-sensitive networking (TSN). As factories increasingly rely on robotics, machine-to-machine communication, and real-time control systems, TSN provides the deterministic and low-latency networking required to synchronize operations efficiently. This ensures higher productivity, reduced downtime, and seamless integration of legacy and modern equipment. The push toward Industry 4.0 and smart manufacturing further fuels TSN demand across the industrial sector.
Restraint: Requirement for high capital investment to implement TSN solutions
The requirement of high capital investment to implement TSN solutions poses a challenge for widespread adoption, especially among small and medium-sized enterprises. Deploying TSN involves upgrading existing network infrastructure, purchasing specialized hardware like TSN-enabled switches, and integrating complex software systems. These upfront costs can be significant, slowing down implementation despite the long-term benefits of improved network performance and reliability.
Opportunity: Elevating adoption of IIoT
The increasing adoption of Industrial Internet of Things (IIoT) presents a significant opportunity for the Time-Sensitive Networking (TSN) market. As more industrial devices and sensors become connected, TSN provides the necessary real-time, deterministic communication to handle massive data flows reliably. This enables enhanced monitoring, predictive maintenance, and automation, driving efficiency and innovation in smart factories and industrial environments.
Challenge: Integration challenges in TSN deployment
Integration challenges in TSN deployment include compatibility issues between legacy and new network equipment, complex configuration requirements, and the need for specialized expertise to design and manage TSN-enabled systems. Ensuring seamless interoperability across diverse devices and protocols can be difficult, often leading to longer deployment times and higher costs. Additionally, integrating TSN into existing IT and operational technology (OT) networks requires careful planning to avoid disruptions.
Time-Sensitive Networking Market: COMMERCIAL USE CASES ACROSS INDUSTRIES
| COMPANY | USE CASE DESCRIPTION | BENEFITS |
|---|---|---|
 |
Processors and Ethernet PHYs used in factory robots and motion controllers | Enable real-time synchronization, reduce communication jitter, and ensure precise motor control in industrial automation |
 |
Automotive Ethernet switches and MCUs integrated into zonal and domain controllers | Support deterministic data flow for ADAS and infotainment systems, enhancing safety and in-vehicle user experience |
 |
TSN-enabled industrial switches in PLCs and edge devices for synchronized machine communication | Improve data reliability and timing accuracy across machines, enabling seamless operation in smart manufacturing environments |
 |
TSN-integrated Ethernet switch SoCs used in smart factories and autonomous mobile robots (AMRs) | Deliver low-latency, high-reliability data paths critical for autonomous navigation and safety systems |
 |
TSN-compliant switch ICs embedded in industrial gateways and connected vehicle platforms | Facilitate deterministic networking for mixed-criticality applications, ensuring real-time performance and secure data flow |
Logos and trademarks shown above are the property of their respective owners. Their use here is for informational and illustrative purposes only.
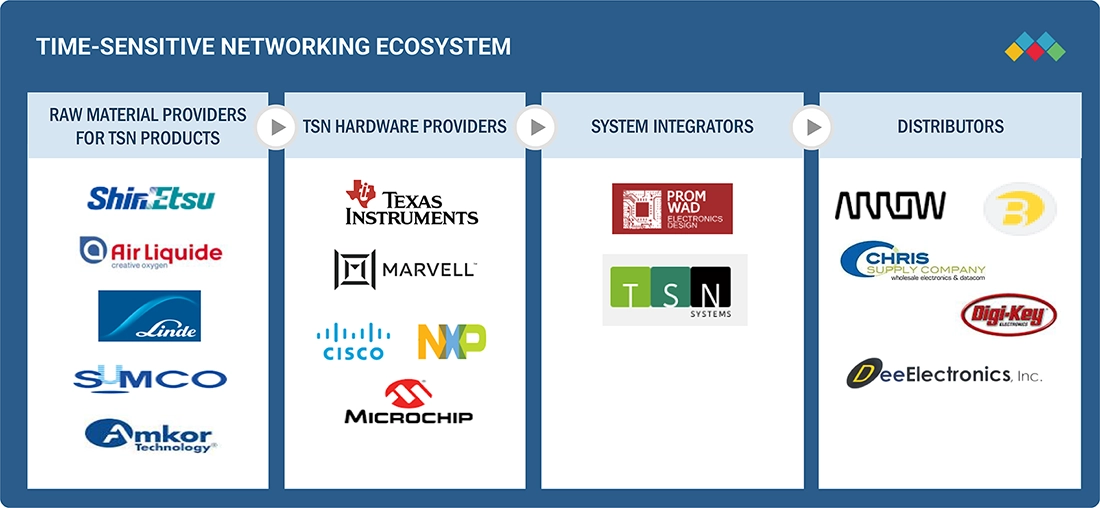
MARKET ECOSYSTEM
The TSN ecosystem comprises raw material providers, TSN hardware manufacturers, system integrators, and end users. Raw material providers supply the fundamental components like semiconductors and electronic materials essential for building TSN devices. Hardware manufacturers develop specialized equipment such as TSN-enabled switches, controllers, and network interfaces that support precise, low-latency communication. System integrators design, customize, and implement these TSN solutions, ensuring seamless real-time data flow across complex industrial or automotive networks. Finally, end users from industries like manufacturing, automotive, energy, and transportation deploy TSN technology to enhance automation, improve safety, and achieve efficient, deterministic networking.
Logos and trademarks shown above are the property of their respective owners. Their use here is for informational and illustrative purposes only.
MARKET SEGMENTS
Source: Secondary Research, Interviews with Experts, MarketsandMarkets Analysis
Time-sensitive Networking Market, by Type
The type segment comprises IEEE 802.1AS, IEEE802.1Qbv, IEEE 802.1CB, IEEE 802.1Qbu, IEEE 802.1Qcc, IEEE 802.11be, IEEE 802.1CM, Others. IEEE 802.1AS is estimated to lead the time-sensitive networking market due to its critical role in providing precise time synchronization across networked devices. It ensures accurate timing essential for real-time communication in industrial automation, automotive, and smart infrastructure. The standard supports sub-microsecond accuracy, enabling seamless coordination of time-sensitive data. Its wide adoption across TSN implementations makes it a foundational protocol in deterministic networking.
Time-sensitive Networking Market, By Component
The component segment includes switches, hubs, routers, and gateways, controllers & processors, and isolators & converters. The switches segment is growing fastest in the time-sensitive networking market due to rising demand for real-time data transmission in industrial automation, automotive networks, and smart infrastructure. TSN-enabled switches are essential for managing time-sensitive traffic with low latency and high reliability. As more industries adopt Ethernet-based deterministic communication, the need for advanced switches increases. Their central role in network architecture drives rapid adoption and market growth.
Time-sensitive Networking Market, by End User
The end users include industrial, automotive, transportation, oil & gas, telecom & data center, aerospace, and others. The automotive segment is estimated to grow the fastest in the time-sensitive networking market due to the increasing adoption of advanced driver-assistance systems (ADAS), autonomous driving technologies, and in-vehicle infotainment systems. These applications require high-speed, deterministic communication, which TSN enables over a unified Ethernet network. TSN helps reduce wiring complexity, ensures real-time data transfer between ECUs and sensors, and supports safety-critical functions. As vehicles become more software-defined, the demand for TSN continues to accelerate.
REGION
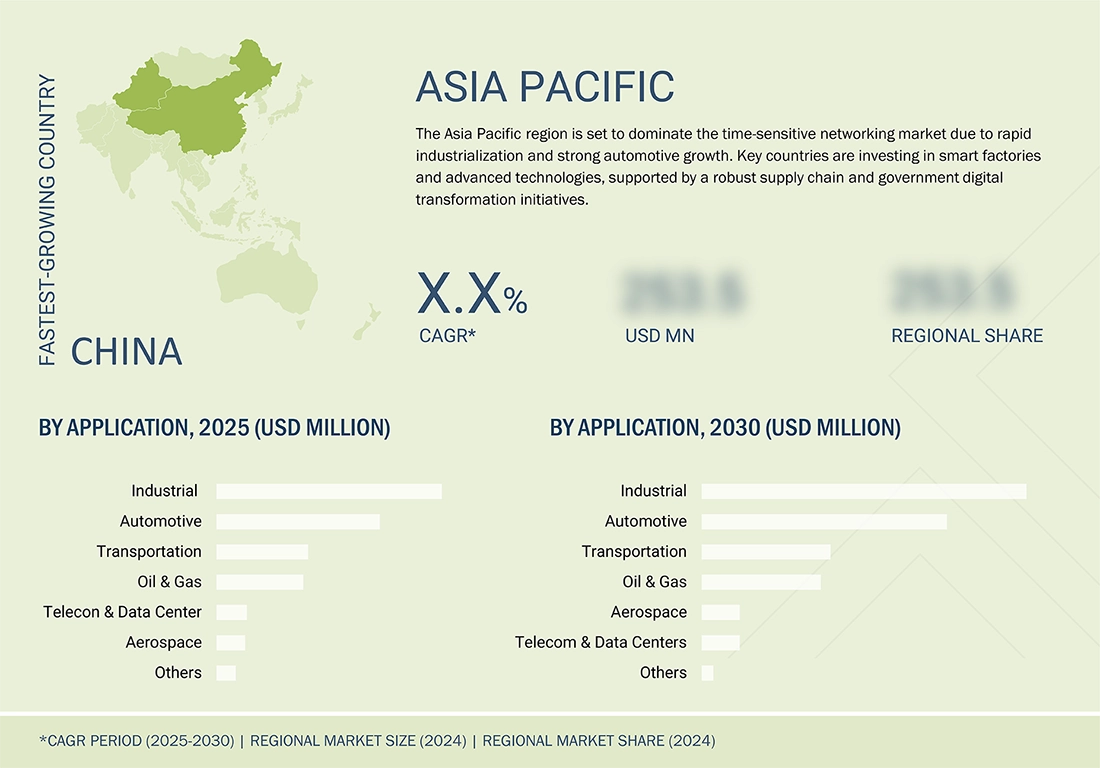
Asia Pacific to be fastest-growing region in global time sensitive networking market during forecast period
Asia Pacific is projected to be the fastest-growing region in the time-sensitive networking market due to rapid industrialization, strong growth in automotive manufacturing, and increasing adoption of Industry 4.0 initiatives. Countries like China, Japan, South Korea, and India are heavily investing in smart factories, advanced robotics, and real-time communication infrastructure. The region also benefits from a robust electronics supply chain and government support for digital transformation, further driving TSN adoption across various sectors.
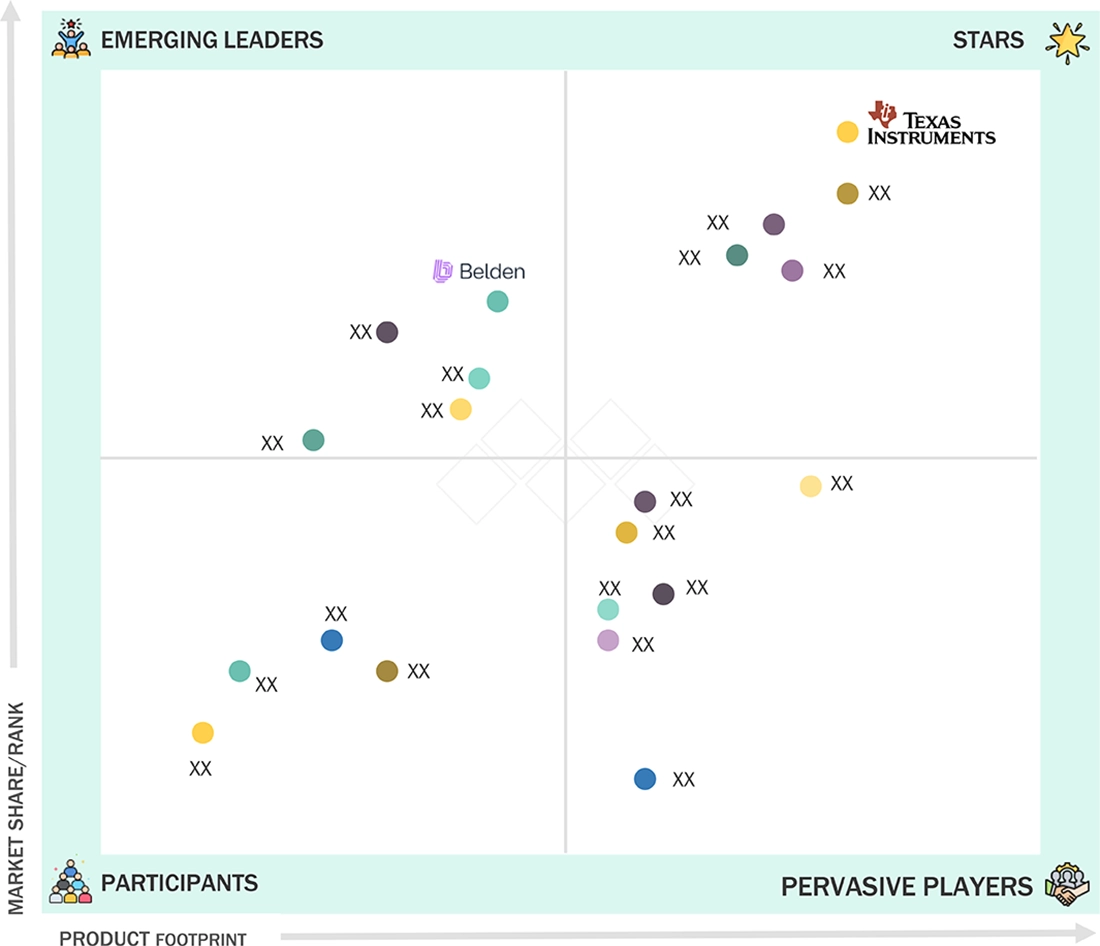
Time-Sensitive Networking Market: COMPANY EVALUATION MATRIX
In the time-sensitive networking (TSN) market, Texas Instruments (Star) leads with a comprehensive and high-performance TSN-enabled hardware portfolio supporting applications across automotive, industrial automation, and communication infrastructure. Known for its robust product innovation and early adoption of TSN standards, Texas Instruments has established strong global partnerships and customer relationships. Belden (Emerging Leader) is gaining momentum in the TSN space with its growing range of TSN-enabled networking solutions tailored for industrial and mission-critical applications. The company is expanding its market footprint through strategic investments and partnerships focused on smart manufacturing and industrial Ethernet.
Source: Secondary Research, Interviews with Experts, MarketsandMarkets Analysis
KEY MARKET PLAYERS
MARKET SCOPE
| REPORT METRIC | DETAILS |
|---|---|
| Market Size, 2024 (Value) | USD 0.26 Billion |
| Market Forecast, 2030 (Value) | USD 1.97 Billion |
| Growth Rate | CAGR of 40.7% from 2025 to 2030 |
| Years Considered | 2021–2030 |
| Base Year | 2024 |
| Forecast Period | 2025–2030 |
| Units Considered | Value (USD Million/Billion), Volume (Thousand Units) |
| Report Coverage | Revenue forecast, company ranking, competitive landscape, growth factors, and trends |
| Segments Covered |
|
| Regional Scope | North America, Asia Pacific, Europe, Middle East & Africa, South America |
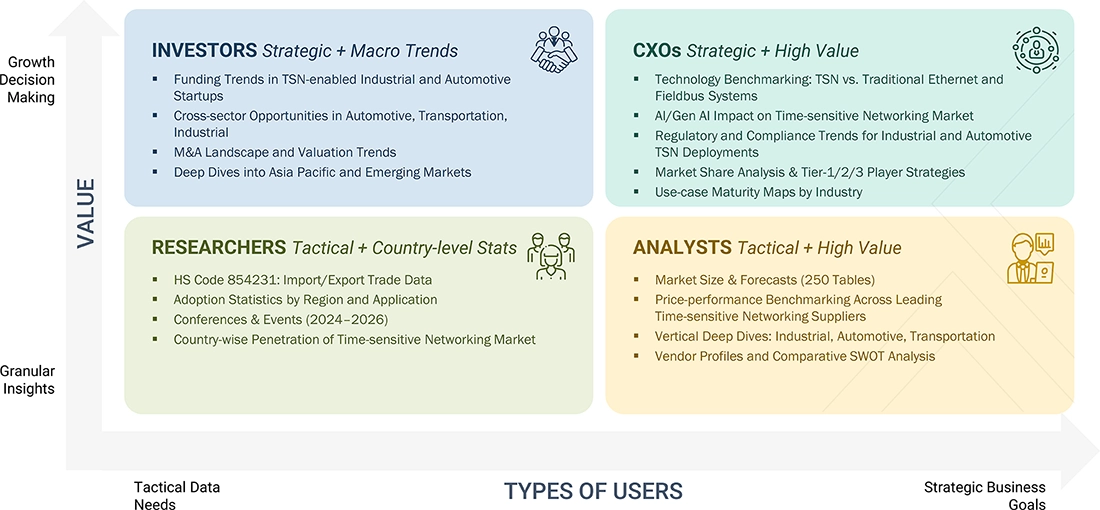
WHAT IS IN IT FOR YOU: Time-Sensitive Networking Market REPORT CONTENT GUIDE
DELIVERED CUSTOMIZATIONS
We have successfully delivered the following deep-dive customizations:
| CLIENT REQUEST | CUSTOMIZATION DELIVERED | VALUE ADDS |
|---|---|---|
| Automotive OEM |
|
|
| Industrial Automation Vendor |
|
|
| TSN Hardware Manufacturer |
|
|
| Telecom Network Integrator |
|
|
RECENT DEVELOPMENTS
- November 2024 : NXP Semiconductors N.V. introduced the i.MX 94 family, the latest addition to its i.MX 9 series of application processors, tailored for use in industrial control, programmable logic controllers (PLCs), telematics, industrial and automotive gateways, as well as building and energy management systems.
- July 2024 : Marvell Technology, Inc. announced that its Teralynx 10 Ethernet switch is now in volume production and being deployed by customers. This low-power, programmable 51.2 Tbps Ethernet device offers the industry's lowest latency, delivering top-tier performance for training, inference, general-purpose computing, and other workloads, enabling scalable accelerated infrastructure in cloud data centers.
- March 2024 : Belden Inc. introduced the BEETLE Single Pair Ethernet (SPE) Lite Managed Switch from its Lumberg Automation line. As an addition to Belden’s SPE connectivity portfolio, this new switch enables organizations to simplify their networks by using thinner, lighter SPE cables that transmit data over a single pair of wires, instead of the traditional two or four pairs used in standard Ethernet.
- February 2024 : Belden Inc. launched the Hirschmann BXP (BOBCAT eXtreme Performance) managed switch, an advanced addition to the trusted BOBCAT switch family from its Hirschmann brand. Designed to meet the evolving demands of railway rolling stock applications, the BXP switch featured a compact form factor, greater flexibility and interoperability, and supported data speeds of up to 10 gigabits per second (Gbps).
- January 2024 : Microchip Technology introduced its next-generation LAN969x Ethernet switches, featuring time-sensitive networking, scalable bandwidths ranging from 46 Gbps to 102 Gbps, and a high-performance 1 GHz single-core Arm Cortex A53 processor.
Table of Contents
 Exclusive indicates content/data unique to MarketsandMarkets and not available with any competitors.
Methodology
The study used four major activities to estimate the time-sensitive networking market size. Exhaustive secondary research was conducted to gather information on the market and its peer and parent markets. The next step was to validate these findings, assumptions, and market size with industry experts across the value chain through primary research. Both top-down and bottom-up approaches were employed to estimate the total market size. Finally, market breakdown and data triangulation methods were used to estimate the market size for different segments and subsegments.
Secondary Research
In the secondary research process, various sources were used to identify and collect information on the time-sensitive networking market. Secondary sources for this research study include corporate filings (such as annual reports, investor presentations, and financial statements); trade, business, and professional associations; white papers; certified publications; and articles by recognized authors, directories, and databases. The secondary data was collected and analyzed to determine the overall market size, and was further validated through primary research.
List of key secondary sources
|
Source |
Web Link |
|
UK Competitive Telecommunications Association |
www.ukcta.org.uk |
|
ASTM International |
www.astm.org |
|
European Research Council |
www.erc.europa.eu |
|
World Trade Organization |
www.wto.gov |
|
International Trade Centre (ITC) |
www.intracen.org |
|
United States Telecom Association |
www.ustelecom.org |
Primary Research
Primary interviews were conducted to gather insights on market statistics, revenue data, market breakdowns, size estimations, and forecasting. Additionally, primary research was used to comprehend various technologies, types, applications, and regional trends. Interviews with stakeholders from the demand side, including CIOs, CTOs, CSOs, and customer/end user installation teams using time-sensitive networking offerings and processes, were also conducted to understand their perspective on suppliers, products, component providers, and their current and future use of time-sensitive networking, which will impact the overall market. Several primary interviews were conducted across major countries in North America, Europe, Asia Pacific, and RoW.

To know about the assumptions considered for the study, download the pdf brochure
Market Size Estimation
In the complete market engineering process, top-down and bottom-up approaches and several data triangulation methods have been used to estimate and forecast the overall market segments and subsegments listed in this report. Key players in the market have been identified through secondary research, and their market shares in the respective regions have been determined through primary and secondary research. This entire procedure included the study of annual and financial reports of the top market players and extensive interviews for key insights (quantitative and qualitative) with industry experts (CEOs, VPs, directors, and marketing executives).
All percentage shares, splits, and breakdowns have been determined using secondary sources and verified through primary sources. All the parameters affecting the markets covered in this research study have been accounted for, viewed in detail, verified through primary research, and analyzed to obtain the final quantitative and qualitative data. This data has been consolidated and supplemented with detailed inputs and analysis from MarketsandMarkets and presented in this report. The following figure represents this study's overall market size estimation process.
Time-Sensitive Networking Market : Top-Down and Bottom-Up Approach

Data Triangulation
Once the overall size of the time-sensitive networking market has been determined using the methods described above, it has been divided into multiple segments and subsegments. Market engineering has been performed for each segment and subsegment using market breakdown and data triangulation methods, as applicable, to obtain accurate statistics. Various factors and trends from the demand and supply sides have been studied to triangulate the data. The market size has been validated using both top-down and bottom-up approaches..
Market Definition
Time-sensitive networking is a set of IEEE 802.1 standards that aim to determine the standard Ethernet networks, initially designed for best-effort communication. It provides time synchronization, low-latency communication, and quality of service (QoS) for real-time industrial applications such as factory automation, automotive systems, and avionics. With time-sensitive networking, periodic and aperiodic data can be transmitted over the same network, enabling a wide range of applications to coexist on a single Ethernet infrastructure. Time-sensitive networking is becoming increasingly popular in industrial communication systems, as it offers a cost-effective, standardized, and flexible solution that can enhance system performance, reliability, and safety.
Key Stakeholders
- Providers of components and materials for time-sensitive networking products
- Distributors, suppliers, and service providers for time-sensitive networking products
- Technology standards organizations, forums, alliances, and associations
- End users from various sectors such as industrial automation, automotive, and energy and power
- Research organizations
- Analysts and strategic business planners
- Venture capitalists, private equity firms, and start-up companies
Report Objectives
- To describe and forecast the time-sensitive networking market, by type, component, end user, and region, in terms of value
- To describe and forecast the market for various segments across four main regions, namely, North America, Europe, Asia Pacific, and RoW, in terms of value
- To strategically analyze micromarkets with regard to individual growth trends, prospects, and contributions to the markets
- To provide detailed information regarding drivers, restraints, opportunities, and challenges influencing market growth
- To analyze opportunities for stakeholders by identifying high-growth segments in the market
- To provide a detailed overview of the time-sensitive networking value chain
- To strategically analyze key technologies, average selling price trends, trends impacting customer business, ecosystem, regulatory landscape, patent landscape, Porter's Five Forces, import and export scenarios, trade landscape, key stakeholders, buying criteria, and case studies pertaining to the market under study
- To strategically profile key players in the time-sensitive networking market and comprehensively analyze their market share and core competencies
- To analyze competitive developments such as partnerships, acquisitions, expansions, collaborations, and product launches, along with R&D in the time-sensitive networking market
Available Customizations:
With the given market data, MarketsandMarkets offers customizations according to the specific requirements of companies. The following customization options are available for the report:
- Detailed analysis and profiling of additional market players (up to 5)
- Additional country-level analysis of the time-sensitive networking market
Product Analysis
- The product matrix provides a detailed comparison of the product portfolio of each company in the time-sensitive networking market.
Key Questions Addressed by the Report
Which companies dominate the time-sensitive networking market, and what strategies do they employ to enhance their market presence?
The major companies in the time-sensitive networking market include Texas Instruments Incorporated (US), NXP Semiconductors (Netherlands), Siemens (Germany), Marvell (US), and Broadcom (US). These players adopt significant strategies, including product launches and developments, collaborations, acquisitions, and expansions.
Which region has the highest time-sensitive networking market potential?
The Asia Pacific market is projected to grow at the highest CAGR during the forecast period.
What are the opportunities for new market entrants?
Emerging IIoT demand, 5G technology adoption, and the expanding role of TSN in connected and autonomous mobility offer potential growth opportunities in this market.
What are the key factors driving the time-sensitive networking market?
Market drivers include rapid industrial automation adoption, increasing digitization in industrial processes, accelerating integration of edge computing, and critical infrastructure modernization.
What key time-sensitive networking applications will drive market growth in the next five years?
The significant consumers of time-sensitive networking are the industrial, automotive, and transportation sectors.
Need a Tailored Report?
Customize this report to your needs
Get 10% FREE Customization
Customize This ReportPersonalize This Research
- Triangulate with your Own Data
- Get Data as per your Format and Definition
- Gain a Deeper Dive on a Specific Application, Geography, Customer or Competitor
- Any level of Personalization
Let Us Help You
- What are the Known and Unknown Adjacencies Impacting the Time-Sensitive Networking Market
- What will your New Revenue Sources be?
- Who will be your Top Customer; what will make them switch?
- Defend your Market Share or Win Competitors
- Get a Scorecard for Target Partners

Custom Market Research Services
We Will Customise The Research For You, In Case The Report Listed Above Does Not Meet With Your Requirements
Get 10% Free CustomisationGrowth opportunities and latent adjacency in Time-Sensitive Networking Market


Andrew
Nov, 2018
Does the report include information and data for distributed control systems, edge cloud, fog, industrial virtualization, smart factories, industry 4.0?.
ted
Apr, 2020
The volume predicted seems to be very low compared to the total volume of the industrial Ethernet market. I wonder why 'Siemens' was not covered under the key target companies segment?.
Johannes
Mar, 2019
Interested in knowing TSN market size in US, Germany, UK, and Japan by application field: e.g. Power & Energy, Automotive, Transportation & Mobility, Healthcare, Oil & Gas, Others. Is it covered in the report?.
Lance
Feb, 2019
The volume predicted seems to be very low compared to the total volume of the industrial Ethernet market. I wonder why..