Water Testing & Analysis Market by Product (TOC, PH, DO, Conductivity, Turbidity), Product Type (Portable, Handheld, Benchtop), Application (Laboratory, Industrial, Environmental, Government) & Region - Global Trends & Forecast to 2019


This report analyzes the water testing & analysis market, in terms of region, product type, and application.
The global market is dominated by Europe & North America. Developed European countries are emerging as leading exporters of water testing & analysis to the developing regions. The Asia-Pacific region is one of the prominent importer as well as manufacturer of water testing & analysis instruments. This region is projected to grow at the highest CAGR of 7.0% from 2014 to 2019. The growing government regulations and increasing environmental concerns are driving the market.
Globally, The market is driven by increasing awareness for water quality in various application industries such as food & beverage, pharmaceuticals, chemical, energy & power, electronics & semi-conductors, along with the waste water treatment industry.
The geographical and application-wise split was determined using secondary sources and verified through primary respondents. Demand in different regions was considered while estimating the market share of the different regions in the water testing & analysis market. The market estimation was also based on various parameters, such as the number of players, demand trends, supply trends, and the extent of research activity in a particular region. The market for global water testing and analysis instruments is projected to grow at a CAGR of 5.2% to reach a value of $3.5 billion by 2019.
Water Testing & Analysis Market Share ($Million), by Region, 2013
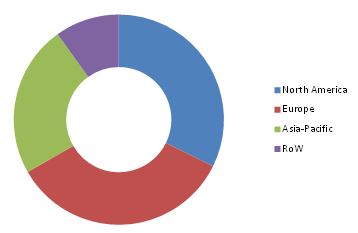
Source: Secondary Data, Primary Interviews, and MarketsandMarkets Analysis
The market is segmented as mentioned below:-
By Product
- TOC Analyzer
- PH Meter
- Dissolved Oxygen Meter
- Conductivity Sensor
- Turbidity Meter
- Others (conductivity meters, colorimeters, spectrophotometers, refractometers, ion analyzers, temperature sensors, and radioactivity analyzers)
By Product Type
- Portable
- Handheld
- Benchtop
- Others (continuous, in-line, and multi-functional meters)
By Application
- Laboratory
- Industrial
- Environmental
- Government
- Others (agricultural, household and general applications)
By Region
- North America
- Europe
- Asia-Pacific
- Rest of the World (RoW)
The global water testing & analysis instruments market was valued at $2.7 billion in 2014 which is projected to grow at a CAGR of 5.2% from 2014 to 2019.
Water testing & analysis are used as majorly in laboratories and industrial applications. The increasing government regulations in developed countries in Europe & North America and stringent water quality standards for several industries define the global market.
In Europe and North America, water testing & analysis instruments are particularly used in laborites and industries such as food & beverage, pharmaceutical, medical, energy & power, electronics & semi-conductor, and waste water treatment. In most countries, the laboratory segment is the largest user of water testing & analysis instruments.
Globally, The market is driven by growing industrial applications for water testing & analysis instruments as well as increasing government and private funding for tackling environmental issues.
Water testing & analysis instrument manufacturers are stressing on technological innovations to provide end-users with innovative easy to use products & improved capabilities and multi-functionality.
Water Testing & Analysis Market Size, by Product, 2014 vs. 2019 ($Million)
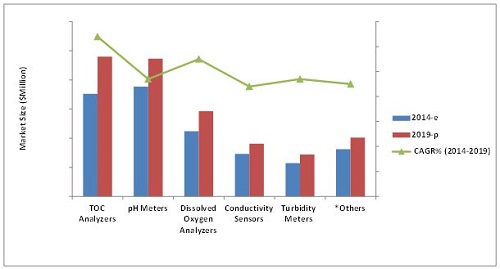
Source: Company Presentations, Company Websites, Secondary Data, Primary Interviews, and MarketsandMarkets Analysis
*Others includes conductivity meters, colorimeters, spectrophotometers, refractometers, ion analyzers, temperature sensors, and radioactivity analyzers
The figure above depicts the market size of water testing and analysis products in 2014 and 2019 along with the projected CAGR through 2014 to 2019. TOC analyzers are growing at the fastest CAGR and hold the second largest market share in water testing and analysis instruments market.
 Exclusive indicates content/data unique to MarketsandMarkets and not available with any competitors.
Table of Contents
1 Introduction (Page No. - 17)
1.1 Objectives of the Study
1.2 Market Definition
1.3 Market Scope
1.3.1 Markets Covered
1.3.2 Periodization Considered For this Market
1.4 Base Currency Considered For Water Testing & Analysis Market
1.5 Stakeholders
2 Research Methodology (Page No. - 21)
2.1 Research Data
2.1.1 Secondary Data
2.1.1.1 Key Data From Secondary Sources
2.1.2 Primary Data
2.1.2.1 Key Data From Primary Sources
2.1.2.2 Key Industry Insights
2.1.2.3 Breakdown of Primaries
2.2 Factor Analysis
2.2.1 Introduction
2.2.2 Overview of Parent Industry
2.2.3 Demand-Side Analysis
2.2.3.1 Water Pollution
2.2.3.2 Water Crisis
2.2.4 Supply-Side Analysis
2.2.4.1 Regulations
2.3 Market Size Estimation
2.4 Market Breakdown & Data Triangulation
2.5 Market Share Estimation
2.6 Research Assumptions & Limitations
2.6.1 Assumptions of the Research Study
2.6.2 Limitations
3 Executive Summary (Page No. - 34)
3.1 Water Testing & Analysis Market
4 Premium Insights (Page No. - 37)
4.1 Attractive Opportunities in this Market
4.2 Water Testing & Analysis Market, By Application
4.3 Water Testing & Analysis Market in the Asia-Pacific Region
4.4 U.S. Dominates the Overall Water Testing & Analysis Market
4.5 Water Testing & Analysis Market: Developed vs. Emerging Markets
4.6 Benchtop Instruments Accounted For Largest Share in the Water Testing
4.7 Water Testing & Analysis Market: Life Cycle Analysis, By Region
4.8 Toc Analyzers Segment Projected to Dominate By 2019
5 Market Overview (Page No. - 45)
5.1 Introduction
5.2 Market Segmentation
5.2.1 Water Testing & Analysis Market, By Product
5.2.1.1 Toc Analyzers
5.2.1.2 Ph Meters
5.2.1.3 Dissolved Oxygen Analyzers
5.2.1.4 Conductivity Sensors
5.2.1.5 Turbidity Meters
5.2.2 Water Testing & Analysis Market, By Product Type
5.2.2.1 Portable
5.2.2.2 Handheld
5.2.2.3 Benchtop
5.2.3 Water Testing & Analysis Market, By Application
5.2.3.1 Laboratory
5.2.3.2 Industrial
5.2.3.3 Environmental
5.2.3.4 Government
5.3 Market Dynamics
5.3.1 Drivers
5.3.1.1 Growing Industrial Applications Spur the Market For Water Testing & Analysis Instruments
5.3.1.2 Increasing Government and Private Funding For Tackling Environment Issues
5.3.1.3 Technological Integration to Provide End Users With Innovative Products and Improved Capabilities
5.3.2 Restraints
5.3.2.1 Limited Market Penetration For Water Testing & Analysis Instruments in Non-Industrial Applications
5.3.2.2 Reluctance of Municipal Bodies and Civic Societies to Adopt New Technologies
5.3.3 Opportunities
5.3.3.1 Increasing Awareness About Water Quality
5.3.3.2 Rapid Urbanization in Developing Economies
5.3.4 Challenges
5.3.4.1 High Prices of Water Testing & Analysis Technologies
6 Industry Trends (Page No. - 55)
6.1 Introduction
6.2 Value Chain Analysis
6.3 Supply Chain
6.4 Industry Insights
6.5 Porter’s Five Forces Analysis
6.5.1 Threat of New Entrants
6.5.2 Threat of Substitutes
6.5.3 Bargaining Power of Suppliers
6.5.4 Bargaining Power of Buyers
6.5.5 Intensity of Competitive Rivalry
6.6 Strategic Benchmarking
6.6.1 Strategic Acquisitions, New Product Launches, and Expansions: Key Strategies Adopted By Leading Companies
7 Water Testing & Analysis Market, By Product (Page No. - 62)
7.1 Introduction
7.2 Water Testing & Analysis Market, By Product
7.2.1 Toc Analyzer
7.2.2 Ph Meter
7.2.3 Dissolved Oxygen Meter
7.2.4 Conductivity Sensors
7.2.5 Turbidity Meter
7.2.6 Other Products
8 Water Testing & Analysis Market, By Product Type (Page No. - 72)
8.1 Introduction
8.1.1 Portable
8.1.2 Handheld
8.1.3 Benchtop
8.1.4 Other Product Types
9 Water Testing & Analysis Market, By Application (Page No. - 78)
9.1 Introduction
9.2 By Application
9.2.1 Laboratory
9.2.2 Industrial
9.2.3 Environmental
9.2.4 Government
9.2.5 Other Applications
10 Water Testing & Analysis Market, By Region (Page No. - 85)
10.1 Introduction
10.2 North America
10.2.1 U.S.
10.2.2 Canada
10.2.3 Mexico
10.3 Europe
10.3.1 Germany
10.3.2 U.K.
10.3.3 France
10.3.4 Rest of Europe
10.4 Asia-Pacific
10.4.1 China
10.4.2 Japan
10.4.3 India
10.4.4 Rest of Asia-Pacific
10.5 Rest of the World (ROW)
10.5.1 Latin America
10.5.2 Africa
10.5.3 Other ROW Countries
11 Competitive Landscape (Page No. - 120)
11.1 Overview
11.2 Competitive Situations & Trends
11.2.1 New Product Launches
11.2.2 Expansions
11.2.3 Agreements, Collaborations, Contracts & Joint Ventures
11.2.4 Acquisitions
12 Company Profiles (Page No. - 134)
(Company at a Glance, Recent Financials, Products & Services, Strategies & Insights, & Recent Developments)*
12.1 Introduction
12.2 Abb Ltd.
12.3 General Electric Company
12.4 Danaher Corporation
12.5 Thermo Fisher Scientific, Inc.
12.6 Tintometer Gmbh
12.7 Agilent Technologies Inc.
12.8 Danaher Corporation
12.9 Emerson Electric Co.
12.10 Horiba, Ltd.
12.11 Honeywell International Inc.
12.12 Mettler-Toledo International Inc.
12.13 Shimadzu Corporation
*Details on Company at a Glance, Recent Financials, Products & Services, Strategies & Insights, & Recent Developments Might Not be Captured in Case of Unlisted Companies.
13 Appendix (Page No. - 178)
13.1 Insights of Industry Experts
13.2 Discussion Guide
13.3 Related Reports
List of Tables (88 Tables)
Table 1 Limitations of the Research Study
Table 2 Increasing Health Consciousness Among Consumers is Driving the Growth of this Market
Table 3 Reluctance of Municipal Bodies & Civic Societies to Embrace New Technologies Restraining the Growth of this Market
Table 4 Emerging Markets Are Paving New Growth Avenues For Players in the Water Testing & Analysis Market
Table 5 High Prices of Water Testing & Analysis Technologies is a Major Challenge For the Water Testing & Analysis Market
Table 6 Industry Insights: Leading Trends Among Key Players
Table 7 Water Testing & Analysis Market Size, By Product, 2012–2019 ($Million)
Table 8 Toc Analyzers Market Size, By Region, 2012–2019 ($Million)
Table 9 PH Meters Market Size, By Region, 2012–2019 ($Million)
Table 10 Dissolved Oxygen Meter Types & Applications
Table 11 Dissolved Oxygen Market Size, By Region, 2012–2019 ($Million)
Table 12 Conductivity Sensor Market Size, By Region, 2012–2019 ($Million)
Table 13 Turbidity Meter Water Testing & Analysis Market Size, By Product, 2012–2019 ($Million)
Table 14 Other Products Water Testing & Analysis Market Size, By Region, 2012–2019 ($Million)
Table 15 Water Testing & Analysis Market Size, By Product Type, 2012–2019 ($Million)
Table 16 Portable Instruments: Water Testing & Analysis Market Size, By Region, 2012-2019 ($Million)
Table 17 Handheld Instruments: Market Size, By Region, 2012-2019 ($Million)
Table 18 Benchtop Instruments: Market Size, By Region, 2012-2019 ($Million)
Table 19 Other Product Types: Water Testing & Analysis Market Size, By Region, 2012-2019 ($Million)
Table 20 Water Testing & Analysis Market Size, By Application, 2012–2019 ($Million)
Table 21 Laboratory: Water Testing & Analysis Market Size, By Region, 2012-2019 ($Million)
Table 22 Industrial: Market Size, By Region, 2012-2019 ($Million)
Table 23 Environmental: Market Size, By Region, 2012-2019 ($Million)
Table 24 Government Water Testing & Analysis Market Size, By Region, 2012-2019 ($Million)
Table 25 Other Applications: Water Testing & Analysis Market Size, By Region, 2012-2019 ($Million)
Table 28 North America: Water Testing & Analysis Market Size, By Product, 2012–2019 ($Million)
Table 29 North America: Market Size, By Product Type, 2012–2019 ($Million)
Table 30 North America: Market Size, By Application, 2012–2019 ($Million)
Table 31 U.S.: Water Testing & Analysis Market Size, By Product, 2012–2019 ($Million)
Table 32 U.S.: Market Size, By Product Type, 2012–2019 ($Million)
Table 33 U.S.: Market Size, By Application, 2012–2019 ($Million)
Table 34 Canada: Water Testing & Analysis Market Size, By Product, 2012–2019 ($Million)
Table 35 Canada: Market Size, By Product Type, 2012–2019 ($Million)
Table 36 Canada: Market Size, By Application, 2012–2019 ($Million)
Table 37 Mexico: Water Testing & Analysis Market Size, By Product, 2012–2019 ($Million)
Table 38 Mexico: Market Size, By Product Type, 2012–2019 ($Million)
Table 39 Mexico: Market Size, By Application, 2012–2019 ($Million)
Table 40 Europe: Water Testing & Analysis Market Size, By Country, 2012–2019 ($Million)
Table 41 Europe: Market Size, By Product, 2012–2019 ($Million)
Table 42 Europe: Water Testing & Analysis Market Size, By Product Type, 2012–2019 ($Million)
Table 43 Europe: Market Size, By Application, 2012–2019 ($Million)
Table 44 Germany: Water Testing & Analysis Market Size, By Product, 2012–2019 ($Million)
Table 45 Germany: Market Size, By Product Type, 2012–2019 ($Million)
Table 46 Germany: Market Size, By Application, 2012–2019 ($Million)
Table 47 U.K.: Water Testing & Analysis Market Size, By Product, 2012–2019 ($Million)
Table 48 U.K.: Market Size, By Product Type, 2012–2019 ($Million)
Table 49 U.K.: Market Size, By Application, 2012–2019 ($Million)
Table 50 France: Water Testing & Analysis Market Size, By Product, 2012–2019 ($Million)
Table 51 France: Market Size, By Product Type, 2012–2019 ($Million)
Table 52 France: Market Size, By Application, 2012–2019 ($Million)
Table 53 Rest of Europe: Water Testing & Analysis Market Size, By Product, 2012–2019 ($Million)
Table 54 Rest of Europe: Market Size, By Product Type, 2012–2019 ($Million)
Table 55 Rest of Europe: Market Size, By Application, 2012–2019 ($Million)
Table 56 Asia-Pacific: Water Testing & Analysis Market Size, By Country, 2012–2019 ($Million)
Table 57 Asia-Pacific: Market Size, By Product, 2012–2019 ($Million)
Table 58 Asia-Pacific: Market Size, By Product Type, 2012–2019 ($Million)
Table 59 Asia-Pacific: Market Size, By Application, 2012–2019 ($Million)
Table 60 China: Water Testing & Analysis Market Size, By Product, 2012–2019 ($Million)
Table 61 China: Market Size, By Product Type, 2012–2019 ($Million)
Table 62 China: Market Size, By Application, 2012–2019 ($Million)
Table 63 Japan: Water Testing & Analysis Market Size, By Product, 2012–2019 ($Million)
Table 64 Japan: Market Size, By Product Type, 2012–2019 ($Million)
Table 65 Japan: Market Size, By Application, 2012–2019 ($Million)
Table 66 India: Water Testing & Analysis Market Size, By Product, 2012–2019 ($Million)
Table 67 India: Market Size, By Product Type, 2012–2019 ($Million)
Table 68 India: Market Size, By Application, 2012–2019 ($Million)
Table 69 Rest of Asia-Pacific: Water Testing & Analysis Market Size, By Product, 2012–2019 ($Million)
Table 70 Rest of Asia-Pacific: Market Size, By Product Type, 2012–2019 ($Million)
Table 71 Rest of Asia-Pacific: Market Size, By Application, 2012–2019 ($Million)
Table 72 ROW: Market Size, By Region, 2012–2019 ($Million)
Table 73 ROW: Market Size, By Product, 2012–2019 ($Million)
Table 74 ROW: Market Size, By Product Type, 2012–2019 ($Million)
Table 75 ROW: Market Size, By Application, 2012–2019 ($Million)
Table 76 Latin America: Water Testing & Analysis Market Size, By Product, 2012–2019 ($Million)
Table 77 Latin America: Market Size, By Product Type, 2012–2019 ($Million)
Table 78 Latin America: Market Size, By Application, 2012–2019 ($Million)
Table 79 Africa: Water Testing & Analysis Market Size, By Product, 2012–2019 ($Million)
Table 80 Africa: Market Size, By Product Type, 2012–2019 ($Million)
Table 81 Africa: Market Size, By Application, 2012–2019 ($Million)
Table 82 Other ROW Countries: Water Testing & Analysis Market Size, By Product, 2012–2019 ($Million)
Table 83 Other ROW Countries: Market Size, By Product Type, 2012–2019 ($Million)
Table 84 Other ROW Countries: Market Size, By Application, 2012–2019 ($Million)
Table 85 New Product Launches, 2011–2014
Table 86 Expansions, 2011-2014
Table 87 Agreements, Collaborations, Contracts & Joint Ventures, 2011-2014
Table 88 Acquisitions 2011-2015
List of Figures (68 Figures)
Figure 1 Water Testing & Analysis Market, By Type
Figure 2 Market, By Application
Figure 3 Water Testing & Analysis Instruments Market: Research Design
Figure 4 Impact of Key Factors Influencing the Parent Industry
Figure 5 Pollutants Entering the Oceans
Figure 6 Availability of Water on Earth For Consumption is Just 1%
Figure 7 Market Size Estimation Methodology: Bottom-Up Approach
Figure 8 Market Size Estimation Methodology: Top-Down Approach
Figure 9 Assumption of the Research Study
Figure 10 Water Testing & Analysis Market Snapshot (2014 vs. 2019): Toc Analyzers to Overtake Ph Meters to Emerge As Market Leader By 2019
Figure 11 Water Testing & Analysis Market Share ($Million), Geographical Overview, 2013
Figure 12 Emerging Economies Offer Attractive Opportunities in this Market
Figure 13 Industrial Applications to Grow at the Highest Rate
Figure 14 Ph Meters Dominated the Emerging Asia-Pacific Market in 2013
Figure 15 India is Projected to be the Fastest-Growing Country-Level Market For Water Testing & Analysis Instruments
Figure 16 Emerging Economies to Grow Faster Than Developed Markets
Figure 17 Benchtop Segment to Dominate the Market Globally
Figure 18 Water Testing & Analysis Market in Asia-Pacific Experiencing the Highest Growth
Figure 19 Market For Toc Analyzers in the Water Testing & Analysis Industry to Dominate By 2019
Figure 20 Water Testing & Analysis Market, By Product
Figure 21 Market, By Product Type
Figure 22 Market, By Application
Figure 23 Multi-Functionality of Water Testing & Analysis Instruments Drives the Market
Figure 24 Ph Meters Dominated the Global Market in 2013
Figure 25 R&D Contributes Most to the Overall Value of Water Testing & Analysis Instruments
Figure 26 Distribution Channel Plays a Vital Role in the Supply Chain For Water Testing & Analysis Instruments
Figure 27 Porter’s Five Forces Analysis
Figure 28 Global Strategic Expansion of Key Companies
Figure 29 Ph Meters Segment Dominated the Water Testing & Analysis Market in 2013
Figure 30 Toc Analyzers to be the Fastest-Growing Water Testing & Analysis Product Through 2019
Figure 31 Europe Captured Largest Market Share For Water Testing & Analysis Instruments in 2013 ($Million)
Figure 32 Benchtop Water Testing & Analysis Segment to Dominate Water Testing & Analysis Market, 2014 vs. 2019
Figure 33 Portable Water Testing & Analysis Instruments Exhibit Promising Growth Prospects
Figure 34 Water Testing & Analysis Market Size, By Application, 2014 vs. 2019
Figure 35 Types of Labs For Water Testing & Analysis
Figure 36 Water Testing & Analysis Market Size in Laboratory Application, By Region, 2014 vs. 2019
Figure 37 Market Size in Industrial Application, By Region, 2014 vs. 2019
Figure 38 Geographical Snapshot (2014-2019): Asia-Pacific Emerging As a New Hot Spot For Water Testing & Analysis
Figure 39 North American Market Snapshot: the U.S. Was the Largest Market For Water Testing & Analysis in 2013
Figure 40 Strengthening Government Regulations is Supporting the Growth of the German Market For Water Testing & Analysis
Figure 41 Asia-Pacific Water Testing & Analysis Market Snapshot: China & India to be Most Lucrative Markets From 2014 to 2019
Figure 42 Key Companies Preferred the New Product Launch Strategy in the Last Five Years
Figure 43 Water Testing & Analysis Market Share, By Key Player, 2013
Figure 44 New Product Launches Fueled Growth & Innovation
Figure 45 New Product Launches: the Key Strategy, 2011–2014
Figure 46 North America Witnessed the Largest Number of Developments in the Water Testing & Analysis Market From 2011 to 2014
Figure 47 Annual Developments in this Market, 2011-2014
Figure 48 Geographical Revenue Mix of Top Five Players
Figure 49 Abb Ltd.: Company Snapshot
Figure 50 Abb Ltd.: SWOT Analysis
Figure 51 General Electric Company: Company Snapshot
Figure 52 General Electric Corporation: SWOT Analysis
Figure 53 Danaher Corporation: Company Snapshot
Figure 54 Emerson Electric Co.: SWOT Analysis
Figure 55 Thermo Fisher Scientific, Inc.: Company Snapshot
Figure 56 Thermo Fisher Scientific, Inc.: SWOT Analysis
Figure 57 Tintometer Gmbh : Company Snapshot
Figure 58 SWOT Analysis
Figure 59 Agilent Technologies Inc.: Company Snapshot
Figure 60 Danaher Corporation: Company Snapshot
Figure 61 Emerson Electric Co.: SWOT Analysis
Figure 62 Emerson Electric Co.: Company Snapshot
Figure 63 Emerson Electric Co.: SWOT Analysis
Figure 64 Horiba, Ltd.: Company Snapshot
Figure 65 Honeywell International Inc.: Company Snapshot
Figure 66 Honeywell International Inc.: SWOT Analysis
Figure 67 Mettler-Toledo International Inc.: Company Snapshot
Figure 68 Shimadzu Corporation: Company Snapshot


Growth opportunities and latent adjacency in Water Testing & Analysis Market