Touch Probe Market by Type (3D, 2D, Tool-length Measuring, Tool Touch-off), Transmission (Optical, Radio, Hard-wired), Application (CNC Machining, CNC Turning, Others), Offering, Industry, and Region - Global Forecast to 2025-2036


The global touch probe market was valued at USD 712.5 million in 2024 and is estimated to reach USD 994.5 million by 2036, at a CAGR of 2.7% between 2025 and 2036.
The global touch probe market is driven by the rising demand for high-precision measurement, automated alignment, and quality assurance in advanced manufacturing environments. Increasing adoption of CNC machining centers, turning centers, and coordinate measuring machines across industries such as automotive, aerospace & defense, electronics, and medical devices is fueling market growth. These probes enable efficient workpiece setup, origin management, and part inspection, reducing downtime and improving production accuracy. Technological advancements in multi-axis measurement, wireless connectivity, and real-time data integration are further enhancing operational efficiency. Additionally, the growing use of AI-driven process optimization and predictive maintenance is improving system reliability and productivity. Overall, the market is becoming increasingly competitive, with leading equipment manufacturers and technology providers focusing on innovation, product performance, and global expansion to strengthen their market position.

Touch probes are sensing devices used in automated machines for creating images of workpieces that are to be processed. They are used in machine tools to set-up workpieces, manage their origin, and automatically align them to inspect their different parts. These probes are used in computer numerical control (CNC) machining centers, CNC turning centers, and coordinate measuring machines (CMMs), among others across various industries such as automotive, aerospace & defense, electronics manufacturing, medical devices, and oil & gas. Among these industries, the automotive industry is expected to continue to be the largest consumer of touch probes in the coming years. The 3D touch probes segment of the market is projected to grow at the highest rate during the forecast period. Major players operating in the touch probe market are Renishaw, Hexagon, Marposs, Metrol, and Blum-Novotest.
Market by Type
3D Touch Probe
The 3D touch probes segment by type is expected to hold the largest market size in the touch probe market due to its advanced capabilities in multi-axis measurement and high-precision inspection. Unlike 1D or 2D probes, 3D probes can accurately capture complex geometries and surface profiles, making them essential for industries such as automotive, aerospace, and electronics manufacturing. Their ability to reduce setup time, eliminate manual alignment errors, and enable automated quality control enhances overall production efficiency. The growing adoption of high-performance CNC machining and coordinate measuring machines further drives the demand for 3D touch probes. Additionally, continuous advancements in wireless connectivity, sensor accuracy, and data integration are making these probes more reliable and versatile, solidifying their dominance in the market.
2D Spindle Probes
The 2D spindle probes segment is expected to grow in the coming years as manufacturers increasingly adopt precision machining and automated quality control. These probes provide accurate X and Y axis measurements, making them ideal for tool setting, workpiece alignment, and in-process inspection. Their cost-effectiveness and easy integration with CNC machines make them suitable for a wide range of industries, while their ability to reduce setup time and enhance machining accuracy supports strong market demand.
Market by Transmission
Hard-wired
The hardwired segment is expected to hold the largest market size in the touch probe market due to its reliability, consistent data transmission, and minimal susceptibility to interference. Hardwired probes are widely preferred in high-precision manufacturing environments such as automotive and aerospace, where accuracy and repeatability are critical. Their ability to deliver stable and uninterrupted communication between the probe and CNC machines or CMMs makes them ideal for complex inspections and automated setups. Additionally, existing infrastructure in many manufacturing facilities is optimized for wired connections, which further sustains the dominance of hardwired touch probes in the market.
Radio
The radio (wireless) segment is projected to register the highest CAGR due to the growing demand for flexible, untethered operations and simplified installation in modern manufacturing setups. Wireless touch probes enable easier integration with CNC machines, turning centers, and coordinate measuring machines without the constraints of cables, reducing machine downtime and setup complexity. The increasing adoption of smart factories, IoT-enabled manufacturing, and real-time monitoring systems is driving the demand for wireless solutions. Additionally, advancements in secure and interference-resistant wireless communication technologies are further accelerating the adoption of radio touch probes, positioning this segment as the fastest-growing in the market.
Market by Geography
Asia Pacific is expected to be the fastest-growing region in the touch probe market, driven by rapid industrialization, expanding manufacturing infrastructure, and increasing adoption of automation technologies. Countries such as China, India, Japan, and South Korea are witnessing significant growth in automotive, electronics, aerospace, and medical device manufacturing, all of which rely heavily on CNC machining centers and coordinate measuring machines that use touch probes. Additionally, government initiatives promoting smart factories and Industry 4.0 adoption are accelerating the deployment of advanced measurement and inspection technologies. The presence of both established manufacturers and emerging local players investing in R&D and regional expansions is further strengthening market growth in the region, making Asia Pacific a key driver of global demand.
Market Dynamics
Driver: Growing demand for precision and automation in manufacturing
A major driver of the touch probe market is the increasing emphasis on high-precision machining and automation in manufacturing processes. Industries such as automotive, aerospace, electronics, and medical devices require accurate workpiece setup, origin management, and part inspection to ensure quality and reduce rework. Touch probes enable automated measurement, multi-axis alignment, and real-time inspection, which significantly improve production efficiency and reduce human error. This growing demand for precision and automation is directly fueling the adoption of touch probes across global manufacturing operations.
Restraint: High cost of advanced touch probe systems
A key restraint in the market is the relatively high cost associated with acquiring and maintaining advanced touch probe systems, particularly 3D and wireless probes. Small- and medium-sized manufacturers may find the upfront investment prohibitive, including costs for integration with CNC machines or CMMs, staff training, and periodic calibration. This financial barrier can slow adoption in cost-sensitive markets, limiting the growth potential of the touch probe market despite increasing demand for automation and precision.
Opportunity: Integration with Industry 4.0 and smart manufacturing technologies
The rise of smart factories and Industry 4.0 presents a significant opportunity for the touch probe market. Integration of touch probes with IoT-enabled CNC machines, real-time monitoring systems, and AI-based predictive maintenance allows manufacturers to optimize operations, reduce downtime, and enhance quality control. Companies offering probes compatible with cloud-based data analytics and wireless connectivity can capitalize on the growing trend toward digital manufacturing and automation, driving new revenue streams and expanding market share.
Challenge: Compatibility and standardization issues across machines
A notable challenge in the touch probe market is ensuring compatibility and standardization across various CNC machines, coordinate measuring machines, and software platforms. Differences in machine architecture, control systems, and data communication protocols can complicate probe integration, installation, and calibration. Manufacturers must invest time and resources to ensure seamless operation, which can slow adoption and create operational complexities. This challenge is particularly pronounced for companies trying to implement touch probes across multi-vendor or legacy equipment setups.
Future Outlook
The touch probe market is expected to experience robust growth through 2036, driven by the continued expansion of automated and precision manufacturing across industries such as automotive, aerospace, electronics, and medical devices. Increasing adoption of 3D and wireless touch probes, coupled with advancements in multi-axis measurement, AI-driven process optimization, and real-time data integration, will enhance operational efficiency and reduce production errors. The rise of smart factories and Industry 4.0 initiatives will further accelerate demand for connected and intelligent measurement solutions. Asia Pacific is likely to remain the fastest-growing region due to rapid industrialization and investments in advanced manufacturing infrastructure. While high initial costs and compatibility challenges may persist, the market is poised for sustained growth as manufacturers prioritize accuracy, automation, and digital integration, making touch probes an indispensable tool for future manufacturing operations.
Key Market Players
Top touch probe market companies include Blum-Novotest GmbH (Germany), Hexagon AB (Sweden), Marposs S.p.A. (Italy), METROL Inc. (Japan), and Renishaw plc (UK).
Key Questions addressed in this report:
- What are the global trends in demand for the market?
- What are the upcoming technologies/product areas that will have a significant impact on the market in the future?
- What will be the revenue pockets for the market players in the next 6 years?
- What are the prime strategies followed by key players in the market?
 Exclusive indicates content/data unique to MarketsandMarkets and not available with any competitors.
Table of Contents
1 Introduction (Page No. - 18)
1.1 Study Objectives
1.2 Market Definition and Scope
1.3 Inclusions and Exclusions
1.4 Study Scope
1.4.1 Markets Covered
1.4.2 Years Considered
1.5 Currency
1.6 Limitations
1.7 Market Stakeholders
2 Research Methodology (Page No. - 21)
2.1 Research Data
2.1.1 Secondary Data
2.1.1.1 List of Major Secondary Sources
2.1.1.2 Key Data From Secondary Sources
2.1.2 Primary Data
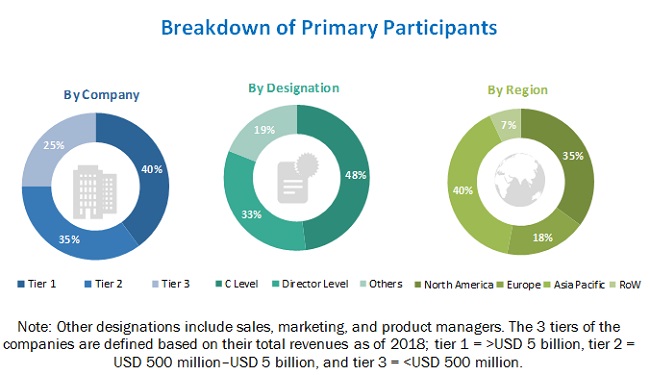
2.1.2.1 Breakdown of Primaries
2.1.2.2 Key Data From Primary Sources
2.1.3 Secondary and Primary Research
2.1.3.1 Key Industry Insights
2.2 Market Size Estimation
2.2.1 Bottom-Up Approach
2.2.1.1 Approach for Arriving at Market Size Using Bottom-Up Analysis
2.2.2 Top-Down Approach
2.2.2.1 Approach for Arriving at Market Size Using Bottom-Up Analysis
2.3 Market Breakdown and Data Triangulation
2.4 Research Assumptions
3 Executive Summary (Page No. - 30)
4 Premium Insights (Page No. - 34)
4.1 Touch Probe Market, 2020–2025 (USD Million)
4.2 Market, By Type
4.3 Market, By Transmission
4.4 Market, By Offering
4.5 Market, By Industry and Region
4.6 Market, By Geography
5 Market Overview (Page No. - 38)
5.1 Introduction
5.2 Market Dynamics
5.2.1 Drivers
5.2.1.1 Low-Cost 3D Scanning of Workpieces Offered By Touch Probes
5.2.1.2 Improved Industry Safety Standards Leading to Adoption of Touch Probes in Various Industries
5.2.1.3 Automation of Automotive Industry
5.2.2 Restraints
5.2.2.1 Increased Adoption of 3D Laser Scanners
5.2.3 Opportunities
5.2.3.1 Rise in Demand for Cnc Machining Centers From Different Industries
5.2.4 Challenges
5.2.4.1 Sluggish Growth of Global Oil & Gas Industry
5.2.4.2 High Costs Involved in Installation of Touch Probes and Requirement of Skilled Professionals to Operate Them
5.3 Value Chain Analysis
6 Touch Probe Market, By Type (Page No. - 46)
6.1 Introduction
6.2 3D Touch Probes
6.2.1 3D Touch Probes Segment Held the Largest Share of Market in 2019
6.3 2D Spindle Probes
6.3.1 Optical Transmission Segment of 2D Spindle Probes Market Projected to Grow at the Highest CAGR From 2020 to 2025
6.4 Tool-Length Measuring Probes
6.4.1 Hard-Wired Segment Held the Largest Share of Tool Length Measuring Probes Market in 2019
6.5 Tool Touch-Off Probes
6.5.1 Hardware Segment Expected to Hold A Larger Share of Tool Touch-Off Probes Market Than Software Segment From 2020 to 2025
7 Touch Probe Market, By Transmission (Page No. - 62)
7.1 Introduction
7.2 Hard-Wired
7.2.1 Hard-Wired Segment Projected to Hold the Largest Size of Market From 2020 to 2025
7.3 Radio
7.3.1 3D Touch Probes Segment Projected to Hold Largest Size of Radio Transmission Touch Probe Market From 2020 to 2025
7.4 Optical
7.4.1 Optical Segment of Market Projected to Grow at the Highest CAGR From 2020 to 2025
8 Touch Probe Market, By Offering (Page No. - 70)
8.1 Introduction
8.2 Hardware
8.2.1 Hardware Segment to Hold A Larger Size of Market Than Software Segment From 2020 to 2025
8.2.1.1 Styli
8.2.1.2 Measuring Units
8.2.1.3 Battery Compartments
8.2.1.4 Shanks
8.2.1.5 Signal Cables
8.2.1.6 Optical Machine Probes (OMPS)
8.3 Software
8.3.1 Software Segment of Market to Grow at A Higher CAGR Than Hardware Segment From 2020 to 2025
9 Applications of Touch Probes (Page No. - 75)
9.1 Introduction
9.2 Cnc Machining Centers
9.2.1 Preference for Cnc Machining Centers in Manufacturing Industry and Machine Shops for Developing Parts of Accurate Sizes and Shapes
9.2.1.1 Cnc Vertical Machining Centers
9.2.1.2 Cnc Horizontal Machining Centers
9.3 Cnc Turning Centers
9.3.1 Emergence of Cnc Turning Centers as Most Suitable Option for Large-Scale Production
9.4 Others
10 Axes Measurement in Touch Probes (Page No. - 77)
10.1 Introduction
10.2 3-Axis Touch Probes
10.2.1 3-Axis Touch Probes Segment Held A Larger Share of Market Than 5-Axis Touch Probes Segment in 2019
10.3 5-Axis Touch Probes
10.3.1 Increase in Use of 5-Axis Touch Probes for Highly Precise Evaluation of Workpieces
11 Measuring Technologies Used in Touch Probes (Page No. - 78)
11.1 Introduction
11.2 Optical Touch Probes
11.2.1 Optical Touch Probes Segment Held the Largest Share of Market in 2019
11.3 Kinematic Resistive Touch Probes
11.3.1 Emergence of Kinematic Resistive Touch Probes as the Simplest Touch Probes Used in Different Applications
11.4 Strain Gauge Touch Probes
11.4.1 Strain Gauge Touch Probes are More Complicated Than Resistive Touch Probes
12 Touch Probe Market, By Industry (Page No. - 80)
12.1 Introduction
12.2 Automotive
12.2.1 Automotive Segment Projected to Lead Market From 2020 to 2025
12.3 Aerospace & Defense
12.3.1 North America to Account for the Largest Size of Market for Aerospace & Defense From 2020 to 2025
12.4 Electronics Manufacturing
12.4.1 APAC to Hold the Largest Size of Market for Electronics Manufacturing From 2020 to 2025
12.5 Medical Devices
12.5.1 North America to Hold the Largest Size of Market for Medical Devices From 2020 to 2025
12.6 Oil & Gas
12.6.1 3D Touch Probes Segment Projected to Account for the Largest Size of Market for Oil & Gas From 2020 to 2025
12.7 Others
13 Geographic Analysis (Page No. - 103)
13.1 Introduction
13.2 North America
13.2.1 US
13.2.1.1 US to Hold the Largest Size of Market in North America From 2020 to 2025
13.2.2 Canada
13.2.2.1 Oil & Gas Industry of Canada Expected to Support Growth of Market in Country
13.2.3 Mexico
13.2.3.1 Low-Cost Manufacturing of Aircraft-Related Products in Mexico to Fuel Growth of Market in Country
13.3 Europe
13.3.1 Germany
13.3.1.1 Germany Projected to Account for the Largest Size of Market in Europe From 2020 to 2025
13.3.2 Italy
13.3.2.1 Increased Demand for Touch Probes From Automotive Industry to Fuel the Growth of Market in Italy
13.3.3 France
13.3.3.1 Rise in Demand for Touch Probes From Aerospace Industry of France Expected to Fuel Growth of Market in Country
13.3.4 UK
13.3.4.1 Flourished Manufacturing Sector of UK Projected to Contribute to Growth of Market in Country
13.3.5 Rest of Europe (RoE)
13.4 APAC
13.4.1 China
13.4.1.1 China to Hold the Largest Share of Market in APAC From 2020 to 2025
13.4.2 Japan
13.4.2.1 Rise in Demand for Touch Probes in Electronics Manufacturing Industry Projected to Fuel Growth of Market in Japan
13.4.3 South Korea
13.4.3.1 Flourished Automotive Industry of South Korea Leading to Growth of Market in Country
13.4.4 India
13.4.4.1 Touch Probe Market in India Projected to Grow at the Highest Rate From 2020 to 2025
13.4.5 Rest of APAC (RoAPAC)
13.5 RoW
13.5.1 South America
13.5.1.1 South America Projected to Hold the Largest Size of Market in RoW
13.5.2 Middle East
13.5.2.1 Flourished Oil & Gas Industry in Middle East to Fuel Growth of Market in Region From 2020 to 2025
13.5.3 Africa
13.5.3.1 Increased Number of Manufacturing Activities in Africa to Support Growth of Market in Region
14 Competitive Landscape (Page No. - 121)
14.1 Overview
14.2 Ranking of Players in Touch Probe Market
14.3 Competitive Leadership Mapping
14.3.1 Visionary Leaders
14.3.2 Dynamic Differentiators
14.3.3 Innovators
14.3.4 Emerging Companies
14.4 Competitive Situations & Trends
14.4.2 Expansions and Partnerships
14.4.3 Acquisitions
14.4.4 Contracts and Agreements
15 Company Profiles (Page No. - 129)
(Business Overview, Products Offered, Recent Developments, SWOT Analysis, and MnM View)*
15.1 Key Players
15.1.1 Blum-Novotest
15.1.2 Hexagon
15.1.3 Marposs
15.1.4 Metrol
15.1.5 Renishaw
15.1.6 Carl Zeiss
15.1.7 Dr. Johannes Heidenhain
15.1.8 J&M Precision Products
15.1.9 P-Tech Industries
15.1.10 Tormach
15.2 Right to Win
15.3 Other Key Players
15.3.1 Capture 3D
15.3.2 Centroid
15.3.3 DP Technology
15.3.4 DRO PROS
15.3.5 Haff & Schneider
15.3.6 Kriatec Services
15.3.7 Mahr
15.3.8 Micro-Vu
15.3.9 Quality Vision International
15.3.10 Vici & C
*Details on Business Overview, Products Offered, Recent Developments, SWOT Analysis, and MnM View Might Not Be Captured in Case of Unlisted Companies.
16 Appendix (Page No. - 155)
16.1 Insights of Industry Experts
16.2 Discussion Guide
16.3 Knowledge Store: Marketsandmarkets’ Subscription Portal
16.4 Available Customizations
16.5 Related Reports
16.6 Author Details
List of Tables (110 Tables)
Table 1 Touch Probe Market, By Type, 2017–2025 (USD Million)
Table 2 3D Touch Probes Market, By Transmission, 2017–2025 (USD Million)
Table 3 3D Touch Probes Market, By Offering, 2017–2025 (USD Million)
Table 4 3D Touch Probes Market, By Industry, 2017–2025 (USD Million)
Table 5 3D Touch Probes Market, By Region, 2017–2025 (USD Million)
Table 6 3D Touch Probes Market in North America, By Country, 2017–2025 (USD Million)
Table 7 3D Touch Probes Market in Europe, By Country, 2017–2025 (USD Million)
Table 8 3D Touch Probes Market in APAC, By Country, 2017–2025 (USD Million)
Table 9 3D Touch Probes Market in RoW, By Region, 2017–2025 (USD Million)
Table 10 2D Spindle Probes Market, By Transmission, 2017–2025 (USD Million)
Table 11 2D Spindle Probes Market, By Offering, 2017–2025 (USD Million)
Table 12 2D Spindle Probes Market, By Industry, 2017–2025 (USD Million)
Table 13 2D Spindle Probes Market, By Region, 2017–2025 (USD Million)
Table 14 2D Spindle Probes Market in North America, By Country, 2017–2025 (USD Million)
Table 15 2D Spindle Probes Market in Europe, By Country, 2017–2025 (USD Million)
Table 16 2D Spindle Probes Market in APAC, By Country, 2017–2025 (USD Million)
Table 17 2D Spindle Probes Market in RoW, By Region, 2017–2025 (USD Million)
Table 18 Tool-Length Measuring Probes Market, By Transmission, 2017–2025 (USD Million)
Table 19 Tool-Length Measuring Probes Market, By Offering, 2017–2025 (USD Million)
Table 20 Tool-Length Measuring Probes Market, By Industry, 2017–2025 (USD Million)
Table 21 Tool-Length Measuring Probes Market, By Region, 2017–2025 (USD Million)
Table 22 Tool-Length Measuring Probes Market in North America, By Country, 2017–2025 (USD Million)
Table 23 Tool-Length Measuring Probes Market in Europe, By Country, 2017–2025 (USD Million)
Table 24 Tool-Length Measuring Probes Market in APAC, By Country, 2017–2025 (USD Million)
Table 25 Tool-Length Measuring Probes Market in RoW, By Region, 2017–2025 (USD Million)
Table 26 Tool Touch-Off Probes Market, By Transmission, 2017–2025 (USD Million)
Table 27 Tool Touch-Off Probes Market, By Offering, 2017–2025 (USD Million)
Table 28 Tool Touch-Off Probes Market, By Industry, 2017–2025 (USD Million)
Table 29 Tool Touch-Off Probes Market, By Region, 2017–2025 (USD Million)
Table 30 Tool Touch-Off Probes Market in North America, By Country, 2017–2025 (USD Million)
Table 31 Tool Touch-Off Probes Market in Europe, By Country, 2017–2025 (USD Million)
Table 32 Tool Touch-Off Probes Market in APAC, By Country, 2017–2025 (USD Million)
Table 33 Tool Touch-Off Probes Market in RoW, By Region, 2017–2025 (USD Million)
Table 34 Touch Probe Market, By Transmission, 2017–2025 (USD Million)
Table 35 Hard-Wired Transmission Touch Probe, By Type, 2017–2025 (USD Million)
Table 36 Hard-Wired Transmission Touch Probe, By Industry, 2017–2025 (USD Million)
Table 37 Hard-Wired Transmission Touch Probe, By Region, 2017–2025 (USD Million)
Table 38 Radio Transmission Touch Probe, By Type, 2017–2025 (USD Million)
Table 39 Radio Transmission Touch Probe, By Industry, 2017–2025 (USD Million)
Table 40 Radio Transmission Touch Probe, By Region, 2017–2025 (USD Million)
Table 41 Optical Transmission Touch Probe, By Type, 2017–2025 (USD Million)
Table 42 Optical Transmission Touch Probe, By Industry, 2017–2025 (USD Million)
Table 43 Optical Transmission Touch Probe, By Region, 2017–2025 (USD Million)
Table 44 Touch Probe, By Offering, 2017–2025 (USD Million)
Table 45 Touch Probe Hardware Market, By Type, 2017–2025 (USD Million)
Table 46 Touch Probe Software Market, By Type, 2017–2025 (USD Million)
Table 47 Market, By Industry, 2017–2025 (USD Million)
Table 48 Market for Automotive, By Type, 2017–2025 (USD Million)
Table 49 Market for Automotive, By Transmission, 2017–2025 (USD Million)
Table 50 Market for Automotive, By Region, 2017–2025 (USD Million)
Table 51 3D Touch Probes Market for Automotive, By Region, 2017–2025 (USD Million)
Table 52 2D Spindle Probes Market for Automotive, By Region, 2017–2025 (USD Million)
Table 53 Tool-Length Measuring Probes Market for Automotive, By Region, 2017–2025 (USD Million)
Table 54 Tool Touch-Off Probes Market for Automotive, By Region, 2017–2025 (USD Million)
Table 55 Market for Aerospace & Defense, By Type, 2017–2025 (USD Million)
Table 56 Market for Aerospace & Defense, By Transmission, 2017–2025 (USD Million)
Table 57 Market for Aerospace & Defense, By Region, 2017–2025 (USD Million)
Table 58 3D Touch Probes for Aerospace & Defense, By Region, 2017–2025 (USD Million)
Table 59 2D Spindle Probes Market for Aerospace & Defense, By Region, 2017–2025 (USD Million)
Table 60 Tool-Length Measuring Probes Market for Aerospace & Defense, By Region, 2017–2025 (USD Million)
Table 61 Tool Touch-Off Probes Market for Aerospace & Defense, By Region, 2017–2025 (USD Million)
Table 62 Market for Electronics Manufacturing, By Type, 2017–2025 (USD Million)
Table 63 Market for Electronics Manufacturing, By Transmission, 2017–2025 (USD Million)
Table 64 Touch Probe Market for Electronics Manufacturing, By Region, 2017–2025 (USD Million)
Table 65 3D Touch Probes Market for Electronics Manufacturing, By Region, 2017–2025 (USD Million)
Table 66 2D Spindle Probes Market for Electronics Manufacturing, By Region, 2017–2025 (USD Million)
Table 67 Tool-Length Measuring Probes Market for Electronics Manufacturing, By Region, 2017–2025 (USD Million)
Table 68 Tool Touch-Off Probes Market for Electronics Manufacturing, By Region, 2017–2025 (USD Million)
Table 69 Market for Medical Devices, By Type, 2017–2025 (USD Million)
Table 70 Market for Medical Devices, By Transmission, 2017–2025 (USD Million)
Table 71 Market for Medical Devices, By Region, 2017–2025 (USD Million)
Table 72 3D Touch Probes Market for Medical Devices, By Region, 2017–2025 (USD Million)
Table 73 2D Spindle Probes Market for Medical Devices, By Region, 2017–2025 (USD Million)
Table 74 Tool-Length Measuring Probes Market for Medical Devices, By Region, 2017–2025 (USD Million)
Table 75 Tool Touch-Off Probes Market for Medical Devices, By Region, 2017–2025 (USD Million)
Table 76 Touch Probe Market for Oil & Gas, By Type, 2017–2025 (USD Million)
Table 77 Market for Oil & Gas, By Transmission, 2017–2025 (USD Million)
Table 78 Market for Oil & Gas, By Region, 2017–2025 (USD Million)
Table 79 3D Touch Probes Market for Oil & Gas, By Region, 2017–2025 (USD Million)
Table 80 2D Spindle Probes Market for Oil & Gas, By Region, 2017–2025 (USD Million)
Table 81 Tool-Length Measuring Probes Market for Oil & Gas Industry, By Region, 2017–2025 (USD Million)
Table 82 Tool Touch-Off Probes Market for Oil & Gas, By Region, 2017–2025 (USD Million)
Table 83 Market for Other Industries, By Type, 2017–2025 (USD Million)
Table 84 Market for Other Industries, By Transmission, 2017–2025 (USD Million)
Table 85 Market for Other Industries, By Region, 2017–2025 (USD Million)
Table 86 3D Touch Probes Market for Other Industries, By Region, 2017–2025 (USD Million)
Table 87 2D Spindle Probes Market for Other Industries, By Region, 2017–2025 (USD Million)
Table 88 Tool-Length Measuring Probes Market for Other Industries, By Region, 2017–2025 (USD Million)
Table 89 Tool Touch-Off Probes Market for Other Industries, By Region, 2017–2025 (USD Million)
Table 90 Touch Probe Market, By Region, 2017–2025 (USD Million)
Table 91 Market in North America, By Country, 2017–2025 (USD Million)
Table 92 Market in North America, By Type, 2017–2025 (USD Million)
Table 93 Market in North America, By Transmission, 2017–2025 (USD Million)
Table 94 Market in North America, By Industry, 2017–2025 (USD Million)
Table 95 Market in Europe, By Country, 2017–2025 (USD Million)
Table 96 Market in Europe, By Type, 2017–2025 (USD Million)
Table 97 Market in Europe, By Transmission, 2017–2025 (USD Million)
Table 98 Market in Europe, By Industry, 2017–2025 (USD Million)
Table 99 Market in APAC, By Country, 2017–2025 (USD Million)
Table 100 Market in APAC, By Type, 2017–2025 (USD Million)
Table 101 Market in APAC, By Transmission, 2017–2025 (USD Million)
Table 102 Market in APAC, By Industry, 2017–2025 (USD Million)
Table 103 Market in RoW, By Region, 2017–2025 (USD Million)
Table 104 Market in RoW, By Type, 2017–2025 (USD Million)
Table 105 Market in RoW, By Transmission, 2017–2025 (USD Million)
Table 106 Market in RoW, By Industry, 2017–2025 (USD Million)
Table 107 Product Launches, 2019
Table 108 Expansions and Partnerships, 2018–2019
Table 109 Acquisitions, 2018–2019
Table 110 Contracts and Agreements, 2019
List of Figures (56 Figures)
Figure 1 Touch Probe Market: Research Design
Figure 2 Market Size Estimation Methodology: Bottom-Up Approach
Figure 3 Market Size Estimation Methodology: Top-Down Approach
Figure 4 Market Breakdown and Data Triangulation
Figure 5 Assumption for Research Study
Figure 6 3D Touch Probes Segment Accounted for the Largest Share of Market in 2019
Figure 7 Hard-Wired Transmission Segment Accounted for the Largest Share of Market in 2019
Figure 8 Hardware Segment Held A Larger Share of Market Than Software Segment in 2019
Figure 9 Automotive Segment of Market Projected to Grow at the Highest CAGR From 2020 to 2025
Figure 10 APAC Touch Probe Market Projected to Grow at the Highest CAGR From 2020 to 2025
Figure 11 Increasing Automation in Automotive Manufacturing Industry to Fuel Growth of Market From 2020 to 2025
Figure 12 3D Touch Probes Segment Projected to Account for the Largest Size of Market From 2020 to 2025
Figure 13 Hard-Wired Transmission Segment to Hold the Largest Size of Market From 2020 to 2025
Figure 14 Hardware Segment to Hold Larger Size of Market Than Software Segment From 2020 to 2025
Figure 15 Automotive Segment and APAC Accounted for the Largest Shares of Market in 2019
Figure 16 US Estimated to Hold the Largest Share of Market in 2020
Figure 17 Touch Probe Market: Drivers, Restraints, Opportunities, and Challenges
Figure 18 Drivers for Market and Their Impact
Figure 19 Restraints for Touch Probe Market and Their Impact
Figure 20 Opportunities for Market and Their Impact
Figure 21 Fluctuating Oil Prices From January 2014 to September 2019
Figure 22 Challenges for Market and Their Impact
Figure 23 Value Chain Analysis: Major Value Addition During Assembly Stage
Figure 24 3D Touch Probes Segment Projected to Lead Market From 2020 to 2025
Figure 25 China Projected to Lead 3D Touch Probes Market in APAC From 2020 to 2025
Figure 26 Germany Projected to Lead 2D Spindle Probes Market in Europe From 2020 to 2025
Figure 27 APAC Projected to Lead Tool-Length Measuring Probes Market From 2020 to 2025
Figure 28 Automotive Segment Projected to Lead Tool Touch-Off Probes Market From 2020 to 2025
Figure 29 Hard-Wired Segment Projected to Hold the Largest Size of Market From 2020 to 2025
Figure 30 Working of Hard-Wired Transmission Touch Probes
Figure 31 Working of Radio Transmission Touch Probes
Figure 32 Working of Optical Transmission Touch Probes
Figure 33 Hardware Segment Projected to Hold A Larger Size of Market Than Software Segment From 2020 to 2025
Figure 34 Hardware of Touch Probes
Figure 35 Market Share, By Axis, 2019 (%)
Figure 36 Market Share, By Measuring Technology, 2019 (%)
Figure 37 Automotive Segment Projected to Lead Market From 2020 to 2025
Figure 38 APAC to Hold the Largest Size of Tool Touch-Off Probes Market for Automotive From 2020 to 2025
Figure 39 North America Projected to Account for the Largest Size of Tool-Length Measuring Probes Market for Aerospace & Defense From 2020 to 2025
Figure 40 APAC Projected to Lead 2D Spindle Probes Market for Electronics Manufacturing From 2020 to 2025
Figure 41 North America Projected to Account for the Largest Size of Tool-Length Measuring Probes Market for Medical Devices From 2020 to 2025
Figure 42 North America Projected to Account for the Largest Size of Market for Oil & Gas From 2020 to 2025
Figure 43 Market in India Projected to Grow at the Highest CAGR From 2020 to 2025
Figure 44 Snapshot of Market in North America
Figure 45 Snapshot of Touch Probe Market in Europe
Figure 46 Passenger Car Registrations in Europe in 2018
Figure 47 Snapshot of Touch Probe Market in APAC
Figure 48 Snapshot of Market in RoW
Figure 49 Product Launches Was Key Growth Strategy Adopted By Leading Players in Market From 2017 to 2019
Figure 50 Ranking of Top 5 Players in Market, 2019
Figure 51 Market (Global) Competitive Leadership Mapping, 2019
Figure 52 Market Evolution Framework: Product Launches Fueled Growth of Market From 2017 to 2019
Figure 53 Product Launches Was Key Strategy Adopted By Leading Players in Market From 2017 to 2019
Figure 54 Hexagon: Company Snapshot
Figure 55 Renishaw: Company Snapshot
Figure 56 Carl Zeiss: Company Snapshot
The study involves major activities for estimating the current size of the touch probe market. Exhaustive secondary research was carried out to collect information on the market. The next step involved the validation of these findings, assumptions, and sizing with industry experts, identified in the value chain, through primary research. Both, top-down and bottom-up approaches were employed to estimate the overall market size. Thereafter, market breakdown and data triangulation were used to estimate the market size of segments and subsegments.
Secondary Research
In the secondary research process, various secondary sources have been referred to for identifying and collecting information important for this study. Secondary sources such as Precision Machined Products Association (PMPA), European Association of the Machine Tool Industries (CECIMO), Association for Manufacturing Technology (AMT), encyclopedias, directories, and databases [OneSource, and Factiva] have been used to identify and collect information for an extensive technical and commercial study of the touch probe market.
Primary Research
In the primary research process, various primary sources from both supply and demand sides have been interviewed to obtain qualitative and quantitative information important for this report. Primary sources, such as experts from related industries and suppliers, have been interviewed to obtain and verify critical information as well as to assess prospects. Key players in the touch probe market have been identified through secondary research, and their respective market rankings have been determined through primary and secondary research. This research includes the study of annual reports of the top market players and interviews with key opinion leaders, such as CEOs, directors, and marketing personnel.
To know about the assumptions considered for the study, download the pdf brochure
Market Size Estimation
In the complete market engineering process, both top-down and bottom-up approaches have been implemented, along with several data triangulation methods, to estimate and validate the size of the touch probe market and other dependent submarkets listed in this report.
- The key players in the industry and markets have been identified through extensive secondary research.
- The industry’s supply chain and market size, in terms of value, have been determined through primary and secondary research processes.
All percentage shares, splits, and breakdowns have been determined using secondary sources and verified through primary sources.
Data Triangulation
After arriving at the overall market size through the estimation process, the total market has been split into several segments. To complete the overall market engineering process and arrive at the exact statistics for all segments, market breakdown and data triangulation procedures have been employed, wherever applicable. The data has been triangulated by studying various factors and trends from both the demand and supply sides. The market has also been validated using both top-down and bottom-up approaches.
The objectives of the study are as follows:
- To describe and forecast the touch probe market, in terms of value, segmented by type, transmission, application, offering, and industry
- To forecast the market size, in terms of value, by region—North America, Europe, Asia Pacific (APAC), and Rest of the World (RoW)
- To provide detailed information regarding drivers, restraints, opportunities, and challenges pertaining to the market
- To provide a detailed overview of the value chain of the touch probe ecosystem
- To strategically analyze micromarkets with regard to individual growth trends, prospects, and contributions to the total market
- To strategically profile key players and comprehensively analyze their market position in terms of ranking and core competencies, along with detailing competitive landscape for market leaders
- To analyze major growth strategies implemented by key market players, such as contracts, agreements, acquisitions, product launches, expansions, and partnerships
Available Customizations:
With the given market data, MarketsandMarkets offers customizations according to a company’s specific needs. The following customization options are available for the report.
Company information
- Detailed analysis and profiling of additional market players (up to 5)


Growth opportunities and latent adjacency in Touch Probe Market