
Machine Tools Market Size, Share & Analysis

Machine Tools Market by Product Type (Milling Machines, Turning Machines, Grinding Machines, Electrical Discharge Machine, Machining Centers), Automation Type (CNC, Conventional), End-User Industry, Sales Channel, and Region - Global Forecast to 2032


OVERVIEW

Source: Secondary Research, Interviews with Experts, MarketsandMarkets Analysis
The machine tools market is projected to reach USD 105.11 billion by 2032, from USD 81.09 billion in 2025, at a CAGR of 3.8%. The market is experiencing strong growth driven by the adoption of advanced technologies such as digital twin simulations, closed-loop machining, and adaptive control systems, all of which improve precision and minimize downtime. Modern machining centers have multi-axis capabilities (5-axis and beyond), high-resolution linear encoders, and direct-drive motors, allowing manufacturers to produce complex geometries in a single setup with minimal repositioning. In addition, closed thermal loop systems combined with predictive analytics are being deployed to counteract drift from ambient temperature changes, an essential factor for ultra-high precision operations. These innovations are advancing machining performance and transforming cost efficiency and process reliability across key end-use industries.
Machine Tools Market Size and Forecast:
- Market Size Value in 2025: USD 81.09 Billion
- Revenue Forecast in 2032: USD 105.11 Billion
- Growth Rate: CAGR of 3.8% from 2025 to 2032
- Data available from 2021 to 2032
- Base year: 2024
- Forecast period: 2025–2032
- Largest Growing Region: Asia Pacific
- Units Considered: Value (USD Billion), Volume (Units)
Key Market Trends and Insights
- Market Growth: The machine tools market growth is driven by increasing industrial automation, precision manufacturing, and CNC machine adoption.
-
IoT Impact: IoT enables real-time machine monitoring, predictive maintenance, and improved production efficiency.
- Growing Trends: The machine tools market is witnessing increased adoption of smart manufacturing, Industry 4.0, and AI-enabled machining.
- Growth Opportunities: The machine tools market opportunities are driven by connected factory solutions, digital twins, and advanced automation technologies.
KEY TAKEAWAYS
-
BY PRODUCT TYPEMachining centers lead the machine tools market due to their versatility and multifunctionality, performing milling, drilling, tapping, and boring in a single setup. Advanced technologies like CNC controls, sensors, and adaptive systems enhance precision, efficiency, and flexibility, making them ideal for diverse industries and driving widespread adoption.
-
BY END-USER INDUSTRYThe automotive and transportation segment is projected to register the highest CAGR during the forecast period due to the growing automotive manufacturing footprint across India, Southeast Asia, and Europe, the emphasis on using lightweight materials, and the adoption of advanced manufacturing technologies. As a result, there will be a greater need for specialized and innovative machine tools.
-
BY SALES CHANNELThe dealers and distributors segment is estimated to hold the largest market share during the forecast period due to a strong established network, customer relationships, brand control, and profitability.
-
BY AUTOMATIONThe CNC machine tools segment is estimated to lead the market during the forecast period. The combination of unmatched precision, high efficiency, versatility, and continuous innovation makes CNC machines the undisputed champions of automation in the machine tools market.
-
BY REGIONThe Asia Pacific holds the largest share in the machine tools market, driven by vast manufacturing hubs in China, Japan, and India. Emerging hubs in Southeast Asia, supported by incentives for large-scale manufacturing, are further boosting regional production capacity. Strategic focus on automated and advanced manufacturing technologies continues to strengthen the region’s market dominance.
-
COMPETITIVE LANDSCAPEThe machine tools market is dominated by key players such as Makino Inc. (Japan), JTEKT Corporation (Japan), Okuma Corporation (Japan), DMG MORI (Japan), and DN Solutions (South Korea). These players have a global distribution network across Asia Pacific, North America, and Europe. These companies are vital in their domestic regions and explore geographic diversification alternatives to grow their businesses. They focus on increasing their market share through expansions, investments, joint ventures, collaboration, and partnerships.
The machine tools market is driven by rising demand for customized consumer products, which is pushing industries toward agile manufacturing systems supported by advanced CAD/CAM integration and rapid tooling solutions. Further, digital transformation across factories is encouraging the use of machine tools with built-in sensors and real-time analytics, enabling smarter quality control and adaptive machining processes.
TRENDS & DISRUPTIONS IMPACTING CUSTOMERS' CUSTOMERS
The machine tools market is experiencing rapid growth, driven by trends like Industry 4.0, automation, and the integration of AI and IoT, enabling smarter, more efficient manufacturing. Demand is shifting toward flexible, multi-axis, and hybrid machines that reduce setup time and support mass customization. Meanwhile, supply chain volatility, skilled labor shortages, and the transition to sustainable production methods are forcing customers to rethink operations, invest in digital capabilities, and adopt service-based business models to stay competitive.

Source: Secondary Research, Interviews with Experts, MarketsandMarkets Analysis
MARKET DYNAMICS
Level
-
Heightened focus on automation

-
Increased demand for precision and efficiency

Level
-
High initial investment costs

Level
-
Industry 4.0 and digitization

-
Rapid adoption of CNC technology

Level
-
Absence of standardization in industrial communication protocols

-
Lack of skilled workforce to operate automated machine tools

Source: Secondary Research, Interviews with Experts, MarketsandMarkets Analysis
Driver: Increased demand for precision and efficiency
The machine tools market is growing as the automotive, aerospace, and electronics industries demand precise and efficient machinery for mass production. Automation, CNC technologies, and Industry 4.0 integration accelerate adoption, while government initiatives and rising exports further support global installations. Further, with an increasing focus on productivity and cost efficiency, the market is expected to witness sustained growth in the coming years.
Restraint: High initial investment costs
High investments in machine tools, including shipping, installation, and maintenance, remain a major restraint for the global market. CNC machines are costly, heavy, and often require customization and upgrades, adding to expenses. These high costs limit adoption in cost-sensitive regions and industries, slowing market growth.
Opportunity: Digital transformation and Industry 4.0 propel innovation
Industry 4.0 and digitization are transforming the global machine tools market by driving demand for smarter, flexible, and highly automated solutions that improve efficiency through real-time data, predictive maintenance, and IoT-enabled connectivity. This shift is accelerating the rise of smart factories worldwide and creating new revenue streams through digital services, software subscriptions, and lifecycle management.
Challenge: Absence of standardization in industrial communication protocols and interfaces
The lack of standardized industrial communication protocols limits interoperability between machine tools, raising integration costs and delaying commissioning. Proprietary protocols and inconsistent interfaces complicate upgrades and IoT deployment. This discourages smaller manufacturers from modernizing, slowing Industry 4.0 adoption.
Machine Tools Market: COMMERCIAL USE CASES ACROSS INDUSTRIES
| COMPANY | USE CASE DESCRIPTION | BENEFITS |
|---|---|---|
 |
Integration of hybrid machine tools combining additive manufacturing (AM) and CNC | Enables complex part production, reduces material waste, shortens lead times |
 |
Use of multi-tasking machine centers (turn-mill & 5-axis machining) | Reduces setup time, improves precision, boosts productivity |
 |
Smart CNC machines with integrated IoT and AI-driven monitoring | Predictive maintenance, reduced downtime, higher process reliability |
 |
Affordable CNC machines for small and medium-sized manufacturers | Cost-effective, easy-to-use, increases accessibility to advanced machining |
 |
High-speed machining centers for aerospace and die/mold applications | Improved surface finish, faster cycle times, high accuracy in complex geometries |
Logos and trademarks shown above are the property of their respective owners. Their use here is for informational and illustrative purposes only.
MARKET ECOSYSTEM
The ecosystem analysis examines the connections and interdependencies within a complex system. It can be applied to various fields. The ecosystem analysis section of this report highlights players in the machine tools market ecosystem, including raw material suppliers, component manufacturers, cutting tool manufacturers, software and digitization providers, machine tools manufacturers, distributors and dealers, and maintenance and service providers.

Logos and trademarks shown above are the property of their respective owners. Their use here is for informational and illustrative purposes only.
MARKET SEGMENTS
Source: Secondary Research, Interviews with Experts, MarketsandMarkets Analysis
Machine Tools Market, By Automation
The CNC machine tools segment is experiencing significant growth in automation, driven by cutting-edge technologies such as AI-enhanced programming, predictive maintenance, and hybrid manufacturing. Moreover, cloud-based CNC platforms enable remote monitoring, diagnostics, and collaborative programming, helping manufacturers reduce unplanned downtime and ensure higher throughput.
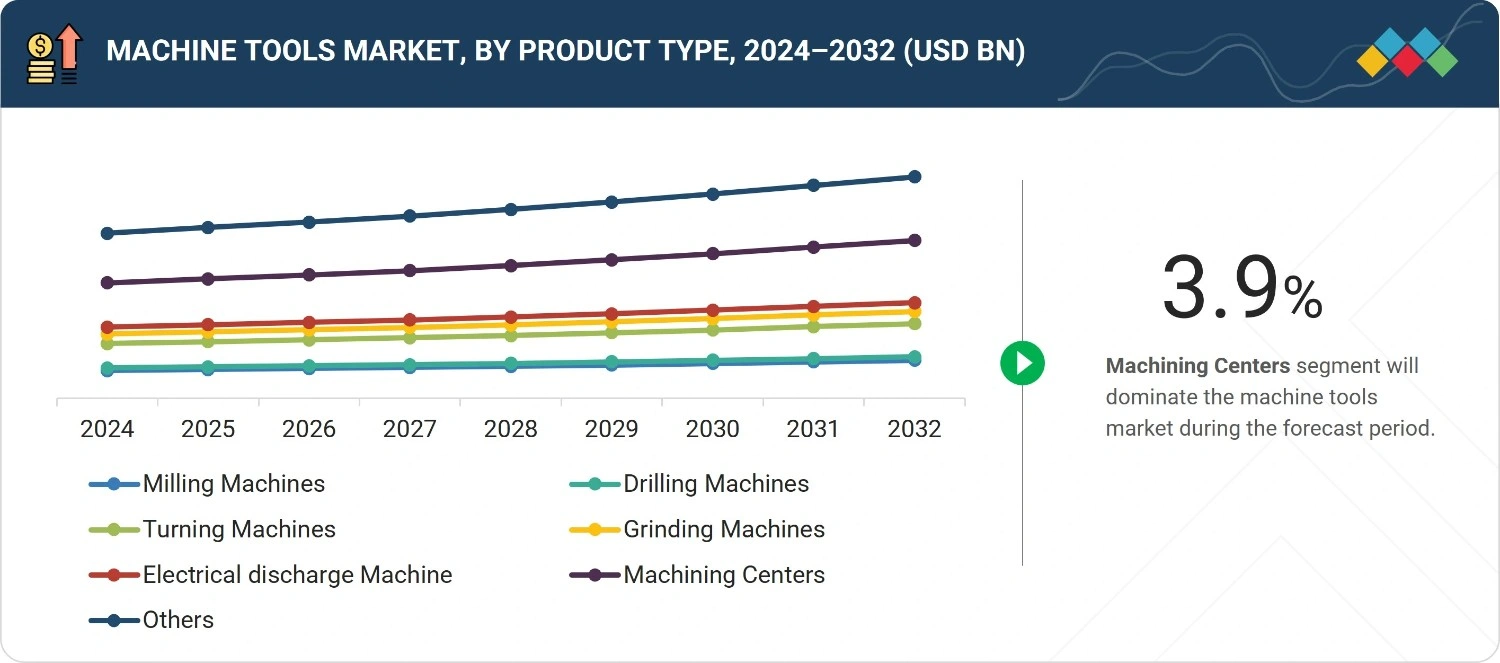
Machine Tools Market, By Product Type
The machining centers segment is the largest and fastest growing market due to increased demand for high-precision, automated manufacturing solutions across industries such as automotive, aerospace, and electronics. Further, the five-axis machining center is another popular form of center that can pivot the tool and/or the component to mill and drill at different angles. These centers enhance productivity by enabling multi-functional machining operations in a single setup, reducing downtime and operational costs.
Machine Tools Market, By Sales Channel
By sales channel, the dealers and distributors segment is expected to lead the market during the forecast period. Dealers and distributors typically have established networks and reach across various regions, allowing them to effectively distribute machine tools to a larger customer base. Dealers and distributors often provide technical expertise, support, and after-sales services, which can be crucial in the machine tools industry, where proper installation, training, and maintenance are essential for optimal performance.
Machine Tools Market, By End-User Industry
The automotive and transportation segment is estimated to account for the largest share of the market in 2025. Advanced machine tools contribute to higher productivity and cost savings in the automotive industry through automation and efficient production processes. Automakers are increasingly adopting CNC machines and robotic systems to achieve high-precision machining of complex components such as battery housings, electric drivetrains, and lightweight chassis parts.
REGION
Asia Pacific is expected to be the largest market for the machine tools market during the forecast period
The Asia Pacific is projected to account for the largest share of the machine tools market. The region is a powerhouse in the global market, with its robust and rapidly expanding manufacturing sector. As countries such as China, India, Japan, and South Korea continue to experience industrialization and economic development, the demand for advanced and efficient machine tools has soared. The automotive, electronics, aerospace, and heavy machinery industries, which are major contributors to the region’s economic output, heavily rely on cutting-edge machine tools for precision manufacturing, leading to a consistent surge in market demand.

Machine Tools Market: COMPANY EVALUATION MATRIX
In the machine tools market, DMG Mori (Star) leads with a strong global presence, a broad product portfolio, and advanced multi-axis CNC solutions, driving large-scale adoption across aerospace, automotive, and medical sectors. Haas Automation Inc. (Emerging Leader) is gaining momentum with cost-effective, user-friendly machine tools and strong penetration in small and medium enterprises, particularly in precision manufacturing and job shops. While DMG Mori dominates with technological depth and scale, Haas demonstrates strong growth potential to advance toward the leaders' quadrant through accessibility and expanding international footprint.

Source: Secondary Research, Interviews with Experts, MarketsandMarkets Analysis
KEY MARKET PLAYERS
MARKET SCOPE
| REPORT METRIC | DETAILS |
|---|---|
| Market Size in 2025 (Value) | USD 81.09 Billion |
| Market Forecast in 2032 (Value) | USD 105.11 Billion |
| Growth Rate | CAGR of 3.8% from 2025-2032 |
| Years Considered | 2021-2032 |
| Base Year | 2024 |
| Forecast Period | 2025-2032 |
| Units Considered | Value (USD Billion) |
| Report Coverage | Revenue forecast, company share, competitive landscape, growth factors and trends |
| Segments Covered | By Product type: Milling Machines, Drilling Machines, Turning Machines, Grinding Machines, Electrical Discharge Machine, Machining Centers, and Others; By Automation: Conventional Machine Tools and CNC Machine Tools; By Sales Channel: Events and Exhibitions, Dealers and Distributers, Direct Sales; By End-User Industry: Aerospace, Medical, Semiconductor, Automotive and Transportation, Capital Good, Energy and Power, Sheet Metals, Others |
| Regions Covered | Asia Pacific, Europe, North America, and Rest of the World |
WHAT IS IN IT FOR YOU: Machine Tools Market REPORT CONTENT GUIDE

DELIVERED CUSTOMIZATIONS
We have successfully delivered the following deep-dive customizations:
| CLIENT REQUEST | CUSTOMIZATION DELIVERED | VALUE ADDS |
|---|---|---|
| Global Machine Tool OEM |
|
|
| Machine Tools Consumption Data |
|
|
RECENT DEVELOPMENTS
- May 2025 : Okuma Corporation announced an agreement with Maquinas e Solucoes Servicos de Representacao e Manutencao de Equipamentos Ltda (M&S) to distribute Okuma Machine Tools products and services in Brazil.
- April 2025 : Makino Asia announced a collaboration with the Singapore Centre for 3D Printing (SC3DP), reinforcing its commitment to advancing metal additive manufacturing. This partnership will focus on unlocking new industrial applications, enhancing repair and coating capabilities, and exploring material innovations. By combining Makino’s expertise in precision manufacturing with SC3DP’s cutting-edge research, both organizations seek to accelerate the adoption of additive manufacturing across key industries.
- April 2025 : Citizen Machinery Co., Ltd. launched the third generation Cincom L20-LFV series of sliding-head lathes in a CNC automatic lathe.
- March 2025 : JTEKT Corporation launched the WELE UG630 a five-axis vertical machining center. It is designed for high-rigidity machining and complex multi-surface operations.
- September 2024 : DMG MORI partnered with Renishaw and Siemens to use simulated packages for CNC control, machine, and workpiece models through the Xcelerator Marketplace.
Table of Contents
 Exclusive indicates content/data unique to MarketsandMarkets and not available with any competitors.
Methodology
The study involved four major activities in estimating the current size of the machine tools market. Exhaustive secondary research was carried out to collect information on the market, the peer market, and the parent market. The next step involved validating these findings and assumptions and sizing them with industry experts across value chains through primary research. The top-down and bottom-up approaches were employed to estimate the complete market size. Thereafter, market breakdown and data triangulation processes were used to estimate the market size of segments and subsegments.
Secondary Research
Secondary sources referred to for this research study included annual reports, press releases, investor presentations of companies, white papers, certified publications, and articles from recognized authors. Secondary research was mainly used to obtain key information about the value chain of the industry, the total pool of key players, market classification, segmentation according to industry trends to the bottommost level, regional markets, and key developments from both market and application perspectives.
Primary Research
Extensive primary research was conducted after acquiring an understanding of the machine tools market scenarios through secondary research. Several primary interviews were conducted with market experts from both the demand (country-level government associations, trade associations, institutes, R&D centers, and machine tools manufacturers) and supply (machine tools manufacturers, machine tools component manufacturers, and raw material suppliers) sides across four major regions, namely, North America, Europe, Asia Pacific, and the Rest of the World. Approximately 35% of interviews have been conducted from the demand side, while 65% of primary interviews have been conducted from the supply side. Primary data was collected through questionnaires, emails, and telephonic interviews. Several primary interviews were conducted from various departments within organizations, such as sales, operations, and administration, to provide a holistic viewpoint in the report.
After interacting with industry participants, some brief sessions were conducted with experienced independent consultants to reinforce the findings from the primary interviews. This, along with the in-house subject matter experts’ opinions, led to the findings delineated in the rest of this report.

Note 1: Others include sales managers, marketing managers, and product managers.
Note 2: Tier 1 companies’ revenues are more than USD 10 billion; tier 2 companies’ revenues range between USD 1 and 10 billion; and tier 3 companies’ revenues range between USD 500 million and USD 1 billion.
Source: Industry Experts
To know about the assumptions considered for the study, download the pdf brochure
Market Size Estimation
A detailed market estimation approach was followed to estimate and validate the value of the machine tools market and other dependent submarkets, as mentioned below:
- The market size was derived by using parameters such as the consumption of machine tools.
- Segment split was identified through primary and secondary research.
- Key players in the machine tools market were identified through secondary research, and their global market ranking was determined through primary and secondary research.
- The research methodology includes the study of the annual and quarterly financial reports & regulatory filings of major market players, as well as interviews with industry experts for detailed market insights.
- All major penetration rates, percentage shares, splits, and breakdowns for the machine tools market were determined by using secondary sources and verified through primary sources.
- All key macro indicators affecting the revenue growth of the market segments and subsegments were accounted for, viewed in extensive detail, verified through primary research, and analyzed to get the validated and verified quantitative & qualitative data.
- The gathered market data was consolidated and added with detailed inputs, analyzed, and presented in this report.
Machine Tools Market : Top-Down and Bottom-Up Approach

Data Triangulation
After arriving at the overall market size through the above-mentioned methodology, this market was split into several segments and subsegments. The data triangulation and market breakdown procedures were employed, wherever applicable, to complete the overall market engineering process and arrive at the exact market value data for the key segments and subsegments. The extrapolated market data was triangulated by studying various macro indicators and regional trends from both the demand and supply-side participants.
Market Definition
According to ISO standards, a “machine tool is a mechanical device that is fixed and powered, typically used to process workpieces by selective removal/addition of material or mechanical deformation. Machine tools operation can be mechanical, controlled by humans, or by computers”. There is a great variety of metalworking machine tools: milling machines, lathes, sheet metal forming machines, EDM machines, and additive manufacturing machines are just some examples. Stainless steel, aluminum, titanium, and copper are some of the main metals processed by these machine tools. In addition to manufacturing components for key sectors like automotive, aerospace, energy, and medical technology, machine tools enable the production of all the other machines, including themselves.
Stakeholders
- Automation consultants
- Companies developing and integrating industrial software
- Dealers and distributors of machine tools
- Government regulatory bodies, industry associations, and experts
- Integrators of automation systems
- Manufacturers of machine tools
- Manufacturers of machine tool components
- Research organizations and consulting companies
- Technology investors
- Technology standards organization, forums, alliances, and associations
- Vendors of CNC machining software
Report Objectives
- To analyze and forecast the machine tools market size in terms of value (USD billion)
-
To define, describe, and project the market based on product type, automation, end user industry, sales channel, and region
- To analyze and forecast the market, in terms of value, based on product type [milling machines (4-axis, 5-axis, others and universal milling machines), drilling machines, turning machines (Swiss-type, multi-spindle, others, and universal milling machines), grinding machines, electrical discharge machines, machining centers, and others]
- To analyze and forecast the market in terms of value based on sales channel (events and exhibitions, dealers and distributors, and direct sales)
- To analyze and forecast the market, in terms of value, based on automation (CNC machine tools and conventional machine tools)
- To analyze and forecast the market, in terms of value, based on end user industry (automotive and transportation, aerospace, medical, semiconductor, sheet metal, energy and power, capital goods, and others)
- To analyze and forecast the market across four key regions, namely, North America, Europe, Asia Pacific, and the Rest of the World (RoW), along with major countries in each region
- To provide detailed information regarding major factors, such as drivers, restraints, opportunities, and challenges, influencing the growth of the market
-
To study the following with respect to the market:
- Value Chain Analysis
- Ecosystem Analysis
- Technology Analysis
- HS Code
- Case Study Analysis
- Investment and Funding Scenario
- Company Valuation and Financial Metrics
- Brand/Product Comparison
- Patent Analysis
- Regulatory Landscape
- Conferences and Events
- Average Selling Price Analysis
- Impact of Generative AI
- To strategically analyze segments with respect to individual growth trends, prospects, and contributions to the total market
- To strategically profile key players and comprehensively analyze their market rank and core competencies
- To track and analyze competitive developments, such as product launches/developments, deals, and others in the market
- To analyze the opportunities offered by various segments of the market to its stakeholders
- To analyze and forecast trends and orientation for the market in the global industry
Available Customizations
With the given market data, MarketsandMarkets offers customizations in line with the company’s specific needs.
Product Analysis
- Profiling of Up to Five Additional Market Players
Machine Tools Market, by Product Type, at Country Level
Machine Tools Market, by End-user Industry, at Country Level
Key Questions Addressed by the Report
What is the current size of the machine tools market?
The machine tools market is projected to reach USD 105.11 billion by 2032, from USD 81.09 billion in 2025, at a CAGR of 3.8%.
Who are the key players in the machine tools market?
The machine tools market is dominated by established players such as Makino Inc. (Japan), JTEKT Corporation (Japan), Okuma Corporation (Japan), DMG MORI Co., Ltd. (Japan), and DN Solutions (South Korea).
Which region will be the fastest-growing market for machine tools?
Asia Pacific is expected to be the fastest-growing market for machine tools due to rapid industrialization, increased investments in advanced manufacturing technologies, and government-led initiatives such as “Make in India” and “China Manufacturing 2025,” which are driving demand for high-precision CNC and automated machining solutions across automotive, electronics, and aerospace sectors.
What are the new market trends impacting the growth of the machine tools market?
The machine tools market is being reshaped by a rapid shift toward smart, automated, and sustainable manufacturing fueled by Industry 4.0/5.0 technologies such as IoT-equipped CNC machines, AI-driven predictive maintenance, digital twins, and collaborative robots (cobots). Manufacturers are also integrating multi-axis machining and hybrid (additive-subtractive) systems to handle advanced, lightweight materials like composites used in EVs and aerospace, while energy-efficient, eco-friendly designs ensure compliance with sustainability mandates
What countries are covered in Europe for the machine tools market?
The countries covered in the report for the machine tools market are the UK, Germany, France, Italy, Spain, Switzerland, and Turkey.
Need a Tailored Report?
Customize this report to your needs
Get 10% FREE Customization
Customize This ReportPersonalize This Research
- Triangulate with your Own Data
- Get Data as per your Format and Definition
- Gain a Deeper Dive on a Specific Application, Geography, Customer or Competitor
- Any level of Personalization
Let Us Help You
- What are the Known and Unknown Adjacencies Impacting the Machine Tools Market
- What will your New Revenue Sources be?
- Who will be your Top Customer; what will make them switch?
- Defend your Market Share or Win Competitors
- Get a Scorecard for Target Partners

Custom Market Research Services
We Will Customise The Research For You, In Case The Report Listed Above Does Not Meet With Your Requirements
Get 10% Free CustomisationTESTIMONIALS

JIM NAAS
PRODUCT DIRECTOR, WEASLER
Weasler Engineering, a CentroMotion organization
Global Provider of Industrial Actuation & Control Solutionswww.weasler.com
Our organization was interested in learning more about the attractiveness of a particular market space. We contacted MarketsandMarkets to help us based on previous positive experiences we had with them. The results did not disappoint! We discussed our objectives with them, and the team at MarketsandMarkets developed and executed a proposal that met our needs precisely. We were very impressed by their level of expertise, the quality of the analysis and their insightful recommendations. We would not hesitate in working with them again in the future.

Matt Kardel,
Vice President
Aptiv,
A global technology company that develops safer, greener and more connected solutions.www.aptiv.com
We contracted with
MarketsandMarkets to evaluate the value chain and potential go-to-market partners related to our
interest in the Fleet Management space. The team successfully completed the work on time and at the
pricing agreed. MarketsandMarkets listened and understood our objectives and collaborated well with
us to help us get the visibility we needed to make an investment.
We have subsequently used
MarketsandMarkets again related to Smart Cities to good results.


Growth opportunities and latent adjacency in Machine Tools Market