Trace Metal Analysis Market by Technology Instrument (Atomic Absorption Spectroscopy, X-Ray Fluorescence, ICP-MS), Service (FAAS, ICP-OES)), Application (Food & Beverage, Pharmaceutical & Biotechnology, Environmental Testing) - Global Forecast to 2024


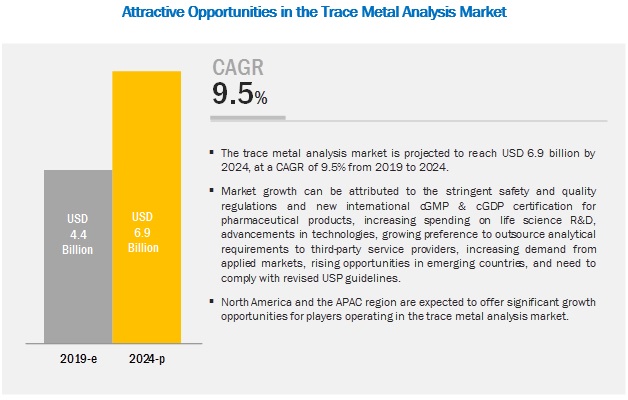
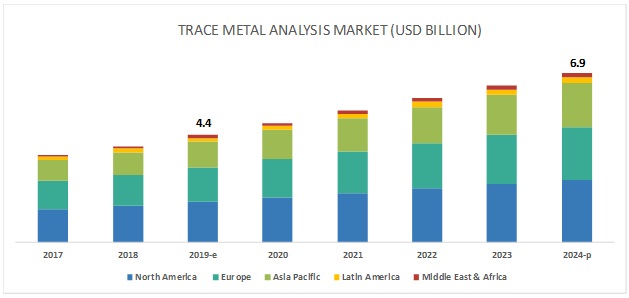
[168 Pages Report] The global trace metal analysis market is projected to reach USD 6.9 billion by 2024 from USD 4.4 billion in 2019, at a CAGR of 9.5%. The growth of this market is mainly driven by the stringent safety and quality regulations and new international cGMP & cGDP certification for pharmaceutical excipients, increasing spending on life science R&D, advancements in technologies, growing preference to outsource analytical requirements to third-party service providers, increasing demand from applied markets, rising opportunities in emerging countries, and the need to comply with revised USP guidelines.
The ICP-MS segment is expected to account for the largest share of the trace metal analysis services market in 2019
On the basis of technology, the ICP-MS segment is expected to account for the largest share of the services market in 2019. The large share of the market is mainly due to factors such as the increasing demand for the analysis of a diverse range of sample matrices; growing focus on the identification of low-level contaminants in chemical products; increased stringency of quality assessment and testing in the beverages, foods, cosmetics, and pharmaceutical industries; and the growing demand for metal speciation.
The environmental testing segment accounted for the largest share of the trace metal analysis market in 2019
Based on application, the environmental testing segment is expected to account for the largest share of the market in 2019. The large share of this segment can mainly be attributed to increasing R&D investments by major industry players; an increasing number of regulatory actions for controlling environmental and water pollutants, reducing emissions, and minimizing human and environmental exposure to toxic chemicals and wastewater; and the growth of end-user application industries.
APAC region is expected to grow at the highest CAGR during the forecast period
The trace metal analysis market in APAC is expected to grow at the highest CAGR during the forecast period. This is due to the growing use of trace metal analysis in the food industry, strategic expansion by market players in the Asia Pacific region, emerging biotech industry, increasing focus on soil testing, and the growing food safety and environmental safety concerns in several Asia Pacific countries. The increasing R&D funding, a growing number of CROs, and favorable government initiatives to promote the growth of pharmaceutical and biotechnology industries are some of the other major factors driving the growth of the Asia Pacific market.
Prominent players in the global trace metal analysis industry are Agilent Technologies (US), Thermo Fisher Scientific (US), PerkinElmer, Inc. (US), Analytik Jena AG (Germany), Bruker Corporation (US), Hitachi Hi-Technologies Corporation (Japan), Rigaku Corporation (Japan), Shimadzu Corporation (Japan), Eurofins Scientific (Luxembourg), Intertek Group PLC (US), SGS S.A. (Switzerland), Bureau Veritas S.A. (France), TÜV SÜD (Germany), and LGC Ltd. (UK).
Agilent Technologies
Agilent is the leading provider of trace metal analysis solutions across the globe. The company offers an extensive product portfolio of products and software for all the trace metal analysis technologies such as ICP-MS, ICP-OES, and AAS. The company focuses on developing technologies that enable in detecting trace metal from various samples for various industries in order to serve the customer base.
To improve patient experience, Agilent Technologies focuses on organic strategies such as product launches and enhancements. Investing in R&D enables Agilent to expand its product portfolio by launching new and advanced products. The company launched ICP-MS Water Analyzer8900 Triple Quadrupole ICP-MS, and 5110 ICP-OES, in 2018 and 2016 respectively. The company also uses a multi-channel approach, including direct sales, electronic commerce, resellers, manufacturers' representatives, and distributors to market its products to its end users. This provides application-focused solutions that include instruments and software for studying metal samples at the molecular level in clinical and life sciences research and other applied areas.
Thermo Fisher Scientific
Thermo Fisher Scientific is a leading provider of superior quality analytical instruments, software, and services for trace metal analysis. The company continuously increases its depth of capabilities in technologies, software & services, and leverages its extensive global channels to address its customers’ emerging needs. The company focuses on R&D to maintain its leading position in this market. Also, in the past three years, Thermo Fisher Scientific launched and enhanced 15 products with innovative technologies.
Geographically, Thermo Fisher Scientific has a strong presence in North America, Europe, and the Asia Pacific. Its strong distribution channels help it to cater to the rising demand for trace metal analysis instruments across the globe. However, increasingly stringent government regulations and global financial fluctuations are major threats to the company’s revenue generation.
The scope of the Report:
|
Report Metric |
Details |
|
Market size available for years |
2017–2024 |
|
Base year considered |
2018 |
|
Forecast period |
2019–2024 |
|
Forecast units |
Value (USD) |
|
Segments covered |
Technology, instrument type, application |
|
Geographies covered |
North America, Europe, APAC, Latin America, Middle East, and Africa. |
|
Companies covered |
Thermo Fisher Scientific (US), Agilent Technologies (US), PerkinElmer, Inc. (US), Analytik Jena AG (Germany), Bruker Corporation (US), Hitachi Hi-Technologies Corporation (Japan), Rigaku Corporation (Japan), Shimadzu Corporation (Japan), Eurofins Scientific (Luxembourg), Intertek Group PLC (US), SGS S.A. (Switzerland), Bureau Veritas S.A. (France), TÜV SÜD (Germany), and LGC Ltd. (UK). |
The research report categorizes the market into the following segments and subsegments:
Trace Metal Analysis Instrument Market, by Technology
- Atomic Absorption Spectroscopy (AAS)
- Inductively Coupled Plasma Mass Spectroscopy (ICP-MS)
- Optical Emission Spectroscopy (OES)
- Fourier Transform Infrared Spectroscopy (FTIR)
- X-ray Fluorescence Spectroscopy (XRF)
- Others (Microwave Induced Plasma Optical Emission Spectroscopy, and Laser-induced Breakdown Spectroscopy)
Trace Metal Analysis Services Market, by Technology
-
Atomic Absorption Spectroscopy (AAS)
- Flame Atomic Absorption Spectroscopy (AAS)
- Graphite Furnace Atomic Absorption Spectroscopy (AAS)
- Atomic Absorption Spectroscopy (AAS)
- Inductively Coupled Plasma-Mass Spectroscopy (ICP-MS)
-
Optical Emission Spectroscopy (OES)
- Arc/Spark Optical Emission Spectroscopy (OES)
- Inductively Coupled Plasma-Optical Emission Spectroscopy (OES)
- Fourier Transform Infrared Spectroscopy (FTIR)
- X-ray Fluorescence Spectroscopy (XRF)
- Others (Microwave Induced Plasma Optical Emission Spectroscopy, and Laser-induced Breakdown Spectroscopy)
Trace Metal Analysis Instrument Market, by Type
- Benchtop
- Portable
Trace Metal Analysis Market, by Application
- Environmental Testing
- Food & Beverage Testing
- Pharmaceutical & Biotechnology Products Testing
- Oil & Gas Testing
- Medical Device Testing
- Semiconductor Testing
- Clinical Diagnostics
- Other Applications (Mining, Geology, Cosmetics, Chemicals, and Research)
Trace Metal Analysis Market, by Region
-
North America
- US
- Canada
-
Europe
- Germany
- UK
- France
- Italy
- Spain
- Rest of Europe
-
Asia Pacific
- China
- Japan
- India
- Rest of Asia Pacific
-
Latin America
- Brazil
- Mexico
- Rest of Latin America
- The Middle East and Africa
Recent Developments
- In 2018, Eurofins Scientific acquired TestAmerica Laboratories, Inc. (US). This acquisition strengthened & expanded its environmental testing business in the US for services such as wet chemistry, trace organics & specialty testing, and metals & inorganics testing in the trace metal analysis market.
- In 2018, Agilent Technologies collaborated with Nanyang Environment and Water Research Institute (NEWRI), (Singapore) to address persistent and emerging contaminants in water.
- In 2018, SGS opened a new laboratory in India to enhance elemental impurity testing services in the APAC region.
- In 2017, Thermo Fisher Scientific launched the Niton XL5 handheld XRF analyzer
Critical questions the report answers:
- Where will all these developments take the industry in the medium to long-term?
- Who are the major industries of trace metal analysis instruments?
- Which are the major trace metal analysis services?
- Which technologies are mainly used for trace metal analysis?
To speak to our analyst for a discussion on the above findings, click Speak to Analyst
 Exclusive indicates content/data unique to MarketsandMarkets and not available with any competitors.
Table of Contents
1 Introduction (Page No. - 22)
1.1 Objectives of the Study
1.2 Market Definition
1.3 Market Scope
1.3.1 Markets Covered
1.3.2 Market Segmentation, By Region
1.3.3 Years Considered for the Study
1.4 Currency
1.5 Limitations
1.6 Stakeholders
2 Research Methodology (Page No. - 26)
2.1 Research Data
2.1.1 Secondary Data
2.1.1.1 Key Data From Secondary Sources
2.1.2 Primary Data
2.1.2.1 Key Data From Primary Sources
2.1.2.2 Key Industry Insights
2.2 Market Size Estimation
2.2.1 Bottom-Up Approach
2.2.2 Top-Down Approach
2.3 Market Breakdown and Data Triangulation
2.4 Assumptions for the Study
3 Executive Summary (Page No. - 36)
4 Premium Insights (Page No. - 43)
4.1 Trace Metal Analysis Market Overview
4.2 Asia Pacific: Trace Metal Analysis Market, By Application and Country, 2018
4.3 Geographic Snapshot of the Trace Metal Analysis Market
4.4 Geographic Mix: Trace Metal Analysis Market
4.5 Trace Metal Analysis Market: Developing vs Developed Markets
5 Market Overview (Page No. - 48)
5.1 Introduction
5.2 Market Dynamics: Impact Analysis
5.3 Drivers
5.3.1 Stringent Safety and Quality Regulations
5.3.2 Technological Advancements
5.3.3 Increasing Demand From Applied Markets
5.3.4 Rising Life Science R&D Expenditure
5.4 Restraints
5.4.1 High Cost of Equipment
5.5 Opportunities
5.5.1 Growing Preference to Outsource Analytical Requirements to Third-Party Service Providers
5.5.2 Emerging Countries
5.5.3 Need to Comply With Revised USP Guidelines
5.6 Challenges
5.6.1 Dearth of Skilled Professionals
6 Industry Insights (Page No. - 56)
6.1 Industry Trends
6.1.1 Growing Demand for Speciation Analysis in Trace Metals
6.2 Regulatory Guidelines
6.2.1 International Council for Harmonisation
6.2.2 Environmental Protection Agency
6.2.3 The Codex Alimentarius Commission
6.2.4 Astm International
6.2.5 The International Organization for Standardization
6.3 Regulatory Analysis
6.4 Strategic Benchmarking
6.4.1 Instrument Portfolio Analysis
6.4.2 Services Portfolio Analysis
7 Trace Metal Analysis Instruments Market, By Technology (Page No. - 62)
7.1 Introduction
7.2 X-Ray Fluorescence Spectroscopy (XRF)
7.2.1 Increasing Demand for Advanced XRF Applications to Identify Unknown Metals is Driving Market Growth
7.3 Optical Emission Spectroscopy (OES)
7.3.1 High-Specificity, Multi-Element Capability, and High Range of Detection are Some of the Major Advantages of This Technique
7.4 Inductively Coupled Plasma Mass Spectroscopy (ICP-MS)
7.4.1 This Segment is Expected to Grow at the Highest CAGR During the Forecast Period
7.5 Atomic Absorption Spectroscopy (AAS)
7.5.1 AAS Instruments Can Analyze the Concentration of Over 70 Different Elements in A Given Sample Solution
7.6 Fourier Transform Infrared - Spectroscopy (FTIR)
7.6.1 Rapid Analyzing Capability of FTIR has Created A Huge Market for This Segment in Trace Metal Analysis in Various Industries
7.7 Others
8 Trace Metal Analysis Services Market, By Technology (Page No. - 77)
8.1 Introduction
8.2 Inductively Coupled Plasma Mass Spectroscopy (ICP-MS)
8.2.1 The ICP-MS Segment Held the Largest Share of the Market and is Also Estimated to Grow at the Highest CAGR
8.3 Optical Emission Spectroscopy (OES)
8.3.1 ARC/Spark Optical Emission Spectroscopy
8.3.1.1 ARC/Spark Optical Emission Spectroscopy Systems are Widely Used in Controlling the Processing of Alloys
8.3.2 Inductively Coupled Plasma Optical Emission Spectroscopy (ICP-OES)
8.3.2.1 Increasing Demand for the Simultaneous and Sequential Analysis of Multiple Metals to Enhance Market Growth
8.4 Atomic Absorption Spectroscopy (AAS)
8.4.1 Flame Atomic Absorption Spectroscopy (FAAS)
8.4.1.1 This Segment is Driven By Factors, Such as Cost-Effectiveness, High Sample Throughput, and Ease of Use
8.4.2 Graphite Furnace Atomic Absorption Spectroscopy (GFAAS)
8.4.2.1 Factors Such as Greater Sensitivity Compared to Other AAS Technologies, Small Sample Size Analysis, and Efficient Atomization Process are Driving Market Growth
8.4.3 Cold Vapor Atomic Absorption Spectroscopy (CVAAS)
8.4.3.1 Cvaa is Specifically Used to Measure Mercury Content in Organic and Inorganic Samples
8.5 Fourier Transform Infrared Spectroscopy (FTIR)
8.5.1 FTIR Services are Used to Identify and Characterize Trace Metals Using Absorption of Infrared (IR) Radiation in A Sample
8.6 X-Ray Fluorescence Spectroscopy (XRF)
8.6.1 Increasing Adoption of Non-Destructive Technologies is Driving the Growth of This Segment
8.7 Others
9 Trace Metal Analysis Instruments Market, By Type (Page No. - 93)
9.1 Introduction
9.2 Benchtop
9.2.1 Benchtop Instruments Accounted for the Larger Market Share in 2018
9.3 Portable
9.3.1 Portable Instruments Offer Quick and Easy Trace Metal Analysis
10 Trace Metal Analysis Market, By Application (Page No. - 98)
10.1 Introduction
10.2 Environmental Testing
10.2.1 Growing Awareness About the Importance of A Safe Environment has Stimulated the Demand for the Use of Trace Metal Analyzers in Environmental Testing
10.3 Food & Beverage Testing
10.3.1 Increased Food Safety Concerns and Stringent Regulatory Mandates are Driving the Growth of This Market
10.4 Pharmaceutical & Biotechnology Products Testing
10.4.1 Increasing Production of Pharmaceutical Formulations, Stringent Safety Regulations, and Increasing R&D Expenditure—Key Factors Driving Market Growth
10.5 Oil & Gas Testing
10.5.1 Growth in the Number of New Oil and Gas Fields to Drive Market Growth
10.6 Medical Device Testing
10.6.1 Growing Number of Device Recalls & Stringent Regulations By Regulatory Bodies to Support Market Growth
10.7 Semiconductor Testing
10.7.1 Rising Demand for the Accurate Analysis of Semiconductor Materials to Drive Market Growth
10.8 Clinical Diagnostics
10.8.1 Increasing Incidence of Target Diseases & Rising Demand for Early & Accurate Disease Diagnosis are Driving the Market for Trace Metal Analysis
10.9 Other Applications
11 Trace Metal Analysis Market, By Region (Page No. - 113)
11.1 Introduction
11.2 North America
11.2.1 US
11.2.1.1 The US Dominated the North American Trace Metal Analysis Market in 2018
11.2.2 Canada
11.2.2.1 Establishment of Quality and Safety Regulations and Its Compliance is Expected to Drive the Growth of Trace Metal Analysis Market in Canada.
11.3 Europe
11.3.1 Germany
11.3.1.1 Germany Accounted for the Largest Share of the European Trace Metal Analysis Market in 2018
11.3.2 France
11.3.2.1 Growing Applied Markets in France is Expected to Drive the Demand for Trace Metal Analysis Technologies
11.3.3 UK
11.3.3.1 Growing Presence in Various Industries and Stringent Regulatory Guidelines for Product Safety and Quality is Expected to Drive the Growth of Trace Metal Analysis Market in the Uk
11.3.4 Italy
11.3.4.1 High Volume of Exports and Stringent Regulations are Expected to Enhance the Adoption of Trace Metal Analysis in Italy
11.3.5 Spain
11.3.5.1 Growth of Spain’s Food Industry Will Be A Significant Driver for the Trace Metal Analysis Market
11.3.6 Rest of Europe (RoE)
11.4 Asia Pacific
11.4.1 Japan
11.4.1.1 Increasing Demand for Quality Assurance Testing in Various Industries is Driving the Demand for the Trace Metal Analysis in Japan
11.4.2 China
11.4.2.1 China Accounted for the Largest Share of the Market in APAC in 2018
11.4.3 India
11.4.3.1 High Production Rate and Growing Stringency Drives the Growth of Trace Metal Analysis in India
11.4.4 Rest of APAC
11.5 Latin America
11.5.1 Brazil
11.5.1.1 Growing Concern of Severe Trace Metals Contamination in Applied Markets is Driving the Demand for Trace Metal Analysis in Brazil
11.5.2 Mexico
11.5.2.1 Growing Awareness and Demand to Monitor Presence of Harmful Trace Metals to Drive the Market in Mexico
11.5.3 Rest of Latin America
11.6 Middle East and Africa
12 Competitive Landscape (Page No. - 195)
12.1 Overview
12.2 Market Share Analysis
12.3 Market Leadership Analysis
12.4 Competitive Leadership Mapping, 2018
12.5 Vendor Inclusion Criteria
12.6 Vendor Dive
12.6.1 Visionary Leaders
12.6.2 Innovators
12.6.3 Emerging Companies
12.6.4 Dynamic Differentiators
12.7 Competitive Situations and Trends
12.7.1 Collaborations, Partnerships, and Agreements
12.7.2 Acquisitions
13 Company Profiles (Page No. - 209)
(Business Overview, Products Offered, Recent Developments, SWOT Analysis, MnM View)*
13.1 Instrument Providers
13.1.1 Agilent Technologies, Inc.
13.1.2 Thermo Fisher Scientific, Inc
13.1.3 Perkinelmer, Inc.
13.1.4 Analytik Jena AG
13.1.5 Bruker Corporation
13.1.6 Hitachi High-Technologies Corporation
13.1.7 Rigaku Corporation
13.1.8 Shimadzu Corporation
13.2 Service Providers
13.2.1 Eurofins Scientific
13.2.2 Intertek Group PLC.
13.2.3 TUV SUD
13.2.4 LGC Limited
13.2.5 SGS S.A.
13.2.6 Bureau Veritas S.A.
*Business Overview, Products Offered, Recent Developments, SWOT Analysis, MnM View Might Not Be Captured in Case of Unlisted Companies.
14 Appendix (Page No. - 267)
14.1 Insights of Industry Experts
14.2 Discussion Guide
14.3 Knowledge Store: Marketsandmarkets’ Subscription Portal
14.4 Available Customizations
14.5 Related Reports
14.6 Author Details
List of Tables (181 Tables)
Table 1 Standard Currency Conversion Rates
Table 2 Trace Metal Analysis: Market Snapshot, 2019 vs 2024
Table 3 Safety Regulations, By Industry
Table 4 Types of Metals, Their Permissible Limits, and Their Effect on Human Health
Table 5 Applications of Speciation Analysis, By Industry
Table 6 Indicative List of Regulatory Authorities for Respective Industries
Table 7 Stringency of Regulations for Trace Metal Analysis, By Region
Table 8 Adoption of Trace Metal Analysis Technologies, By Region
Table 9 Adoption of Trace Metal Analysis Technologies, By Application
Table 10 Trace Metal Analysis Instruments Market, By Technology, 2017–2024 (USD Million)
Table 11 Major X-Ray Fluorescence Spectroscopy Instrument Available in the Market
Table 12 X-Ray Fluorescence Spectroscopy (XRF) Instruments Market, By Country, 2017–2024 (USD Million)
Table 13 Major Optical Emission Spectroscopy Instrument Available in the Market
Table 14 Optical Emission Spectroscopy Instruments Market, By Country, 2017–2024 (USD Million)
Table 15 Major ICP-MS Instruments Available in the Market
Table 16 Inductively Coupled Plasma-Mass Spectroscopy Instruments Market, By Country, 2017–2024 (USD Million)
Table 17 Major Atomic Absorption Spectroscopy Instrument Available in the Market
Table 18 Atomic Absorption Spectroscopy Instruments Market, By Country, 2017–2024 (USD Million)
Table 19 Major Fourier Transform Infrared Spectroscopy Instrument Available in the Market
Table 20 Fourier Transform Infrared - Spectroscopy (FTIR) Instruments Market, By Country, 2017–2024 (USD Million)
Table 21 Other Trace Metal Analysis Instruments Market, By Country, 2017–2024 (USD Million)
Table 22 Trace Metal Analysis Services Market, By Technology, 2017–2024 (USD Million)
Table 23 Inductively Coupled Plasma Mass Spectroscopy Services Market, By Country, 2017–2024 (USD Million)
Table 24 Optical Emission Spectroscopy Services Market, By Type, 2017–2024 (USD Million)
Table 25 Optical Emission Spectroscopy Services Market, By Country, 2017–2024 (USD Million)
Table 26 ARC/Spark Optical Emission Spectroscopy Services Market, By Country, 2017–2024 (USD Million)
Table 27 Inductively Coupled Plasma Optical Emission Spectroscopy Services Market, By Country, 2017–2024 (USD Million)
Table 28 Atomic Absorption Spectroscopy Services Market, By Type, 2017–2024 (USD Million)
Table 29 Atomic Absorption Spectroscopy Services Market, By Country, 2017–2024 (USD Million)
Table 30 Flame Atomic Absorption Spectroscopy Services Market, By Country, 2017–2024 (USD Million)
Table 31 Graphite Furnace Atomic Absorption Spectroscopy Services Market, By Country, 2017–2024 (USD Million)
Table 32 Cold Vapor Atomic Absorption Spectroscopy Services Market, By Country, 2017–2024 (USD Million)
Table 33 Fourier Transform Infrared Spectroscopy Services Market, By Country, 2017–2024 (USD Million)
Table 34 X-Ray Fluorescence Spectroscopy (XRF) Services Market, By Country, 2017–2024 (USD Million)
Table 35 Other Trace Metal Analysis Services Market, By Country, 2017–2024 (USD Million)
Table 36 Trace Metal Analysis Instruments Market, By Type, 2017–2024 (USD Million)
Table 37 Benchtop Trace Metal Analysis Instruments Market, By Country, 2017–2024 (USD Million)
Table 38 Portable Trace Metal Analysis Instruments Market, By Country, 2017–2024 (USD Million)
Table 39 Market, By Application, 2017–2024 (USD Million)
Table 40 Market for Environmental Testing, By Country, 2017–2024 (USD Million)
Table 41 Market for Food & Beverage Testing, By Country, 2017–2024 (USD Million)
Table 42 Market for Pharmaceutical & Biotechnology Products Testing, By Country, 2017–2024 (USD Million)
Table 43 Market for Oil & Gas Testing, By Country, 2017–2024 (USD Million)
Table 44 Market for Medical Device Testing, By Country, 2017–2024 (USD Million)
Table 45 Market for Semiconductor Testing, By Country, 2017–2024 (USD Million)
Table 46 Market for Clinical Diagnostics, By Country, 2017–2024 (USD Million)
Table 47 Market for Other Applications, By Country, 2017–2024 (USD Million)
Table 48 Market, By Region, 2017–2024 (USD Million)
Table 49 North America: Trace Metal Analysis Instruments Market, By Country, 2017–2024 (USD Million)
Table 50 North America: Trace Metal Analysis Services Market, By Country, 2017–2024 (USD Million)
Table 51 North America: Trace Metal Analysis Instruments Market, By Technology, 2017–2024 (USD Million)
Table 52 North America: Trace Metal Analysis Instruments Market, By Type, 2017–2024 (USD Million)
Table 53 North America: Trace Metal Analysis Services Market, By Technology, 2017–2024 (USD Million)
Table 54 North America: Atomic Absorption Spectroscopy Services Market, By Type, 2017–2024 (USD Million)
Table 55 North America: Optical Emission Spectroscopy Services Market, By Type, 2017–2024 (USD Million)
Table 56 North America: Trace Metal Analysis Market, By Application, 2017–2024 (USD Million)
Table 57 US: Trace Metal Analysis Instruments Market, By Technology, 2017–2024 (USD Million)
Table 58 US: Trace Metal Analysis Instruments Market, By Type, 2017–2024 (USD Million)
Table 59 US: Trace Metal Analysis Services Market, By Technology, 2017–2024 (USD Million)
Table 60 US: Atomic Absorption Spectroscopy Services Market, By Type, 2017–2024 (USD Million)
Table 61 US: Optical Emission Spectroscopy Services Market, By Type, 2017–2024 (USD Million)
Table 62 US: Trace Metal Analysis Market, By Application, 2017–2024 (USD Million)
Table 63 Canada: Trace Metal Analysis Instruments Market, By Technology, 2017–2024 (USD Million)
Table 64 Canada: Trace Metal Analysis Instruments Market, By Type, 2017–2024 (USD Million)
Table 65 Canada: Trace Metal Analysis Services Market, By Technology, 2017–2024 (USD Million)
Table 66 Canada: Atomic Absorption Spectroscopy Services Market, By Type, 2017–2024 (USD Million)
Table 67 Canada: Optical Emission Spectroscopy Services Market, By Type, 2017–2024 (USD Million)
Table 68 Canada: Trace Metal Analysis Market, By Application, 2017–2024 (USD Million)
Table 69 Europe: Trace Metal Analysis Instruments Market, By Country, 2017–2024 (USD Million)
Table 70 Europe: Trace Metal Analysis Services Market, By Country, 2017–2024 (USD Million)
Table 71 Europe: Trace Metal Analysis Instruments Market, By Technology, 2017–2024 (USD Million)
Table 72 Europe: Trace Metal Analysis Instruments Market, By Type, 2017–2024 (USD Million)
Table 73 Europe: Trace Metal Analysis Services Market, By Technology, 2017–2024 (USD Million)
Table 74 Europe: Atomic Absorption Spectroscopy Services Market, By Type, 2017–2024 (USD Million)
Table 75 Europe: Optical Emission Spectroscopy Services Market, By Type, 2017–2024 (USD Million)
Table 76 Europe: Trace Metal Analysis Market, By Application, 2017–2024 (USD Million)
Table 77 Germany: Trace Metal Analysis Instruments Market, By Technology, 2017–2024 (USD Million)
Table 78 Germany: Trace Metal Analysis Instruments Market, By Type, 2017–2024 (USD Million)
Table 79 Germany: Trace Metal Analysis Services Market, By Technology, 2017–2024 (USD Million)
Table 80 Germany: Atomic Absorption Spectroscopy Services Market, By Type, 2017–2024 (USD Million)
Table 81 Germany: Optical Emission Spectroscopy Market, By Type, 2017–2024 (USD Million)
Table 82 Germany: Trace Metal Analysis Market, By Application, 2017–2024 (USD Million)
Table 83 France: Trace Metal Analysis Instruments Market, By Technology, 2017–2024 (USD Million)
Table 84 France: Trace Metal Analysis Instruments Market, By Type, 2017–2024 (USD Million)
Table 85 France: Trace Metal Analysis Services Market, By Technology, 2017–2024 (USD Million)
Table 86 France: Atomic Absorption Spectroscopy Services Market, By Type, 2017–2024 (USD Million)
Table 87 France: Optical Emission Spectroscopy Market, By Type, 2017–2024 (USD Million)
Table 88 France: Trace Metal Analysis Market, By Application, 2017–2024 (USD Million)
Table 89 UK: Trace Metal Analysis Instruments Market, By Technology, 2017–2024 (USD Million)
Table 90 UK: Trace Metal Analysis Instruments Market, By Type, 2017–2024 (USD Million)
Table 91 UK: Trace Metal Analysis Services Market, By Technology, 2017–2024 (USD Million)
Table 92 UK: Atomic Absorption Spectroscopy Services Market, By Type, 2017–2024 (USD Million)
Table 93 UK: Optical Emission Spectroscopy Services Market, By Type, 2017–2024 (USD Million)
Table 94 UK: Trace Metal Analysis Market, By Application, 2017–2024 (USD Million)
Table 95 Italy: Trace Metal Analysis Instruments Market, By Technology, 2017–2024 (USD Million)
Table 96 Italy: Trace Metal Analysis Instruments Market, By Type, 2017–2024 (USD Million)
Table 97 Italy: Trace Metal Analysis Services Market, By Technology, 2017–2024 (USD Million)
Table 98 Italy: Atomic Absorption Spectroscopy Services Market, By Type, 2017–2024 (USD Million)
Table 99 Italy: Optical Emission Spectroscopy Services Market, By Type, 2017–2024 (USD Million)
Table 100 Italy: Trace Metal Analysis Market, By Application, 2017–2024 (USD Million)
Table 101 Spain: Trace Metal Analysis Instruments Market, By Technology, 2017–2024 (USD Million)
Table 102 Spain: Trace Metal Analysis Instruments Market, By Type, 2017–2024 (USD Million)
Table 103 Spain: Trace Metal Analysis Services Market, By Technology, 2017–2024 (USD Million)
Table 104 Spain: Atomic Absorption Spectroscopy Services Market, By Type, 2017–2024 (USD Million)
Table 105 Spain: Optical Emission Spectroscopy Services Market, By Type, 2017–2024 (USD Million)
Table 106 Spain: Trace Metal Analysis Market, By Application, 2017–2024 (USD Million)
Table 107 RoE: Trace Metal Analysis Instruments Market, By Technology, 2017–2024 (USD Million)
Table 108 RoE: Trace Metal Analysis Instruments Market, By Type, 2017–2024 (USD Million)
Table 109 RoE: Trace Metal Analysis Services Market, By Technology, 2017–2024 (USD Million)
Table 110 RoE: Atomic Absorption Spectroscopy Services Market, By Type, 2017–2024 (USD Million)
Table 111 RoE: Optical Emission Spectroscopy Services Market, By Type, 2017–2024 (USD Million)
Table 112 RoE: Trace Metal Analysis Market, By Application, 2017–2024 (USD Million)
Table 113 APAC: Trace Metal Analysis Instruments Market, By Country, 2017–2024 (USD Million)
Table 114 Trace Metal Analysis Services Market, By Country, 2017–2024 (USD Million)
Table 115 APAC: Trace Metal Analysis Instruments Market, By Technology, 2017–2024 (USD Million)
Table 116 APAC: Trace Metal Analysis Instruments Market, By Type, 2017–2024 (USD Million)
Table 117 APAC: Trace Metal Analysis Services Market, By Technology, 2017–2024 (USD Million)
Table 118 APAC: Atomic Absorption Spectroscopy Services Market, By Type, 2017–2024 (USD Million)
Table 119 APAC: Optical Emission Spectroscopy Services Market, By Type, 2017–2024 (USD Million)
Table 120 APAC: Trace Metal Analysis Market, By Application, 2017–2024 (USD Million)
Table 121 Japan: Trace Metal Analysis Instruments Market, By Technology, 2017–2024 (USD Million)
Table 122 Japan: Trace Metal Analysis Instruments Market, By Type, 2017–2024 (USD Million)
Table 123 Japan: Trace Metal Analysis Services Market, By Technology, 2017–2024 (USD Million)
Table 124 Japan: Atomic Absorption Spectroscopy Services Market, By Type, 2017–2024 (USD Million)
Table 125 Japan: Optical Emission Spectroscopy Services Market, By Type, 2017–2024 (USD Million)
Table 126 Japan: Trace Metal Analysis: Market, By Application, 2017–2024 (USD Million)
Table 127 China: Trace Metal Analysis Instruments Market, By Technology, 2017–2024 (USD Million)
Table 128 China: Trace Metal Analysis Instruments Market, By Type, 2017–2024 (USD Million)
Table 129 China: Trace Metal Analysis Services Market, By Technology, 2017–2024 (USD Million)
Table 130 China: Atomic Absorption Spectroscopy Services Market, By Type, 2017–2024 (USD Million)
Table 131 China: Optical Emission Spectroscopy Services Market, By Type, 2017–2024 (USD Million)
Table 132 China: Trace Metal Analysis: Market, By Application, 2017–2024 (USD Million)
Table 133 India: Trace Metal Analysis Instruments Market, By Technology, 2017–2024 (USD Million)
Table 134 India: Trace Metal Analysis Instruments Market, By Type, 2017–2024 (USD Million)
Table 135 India: Trace Metal Analysis Services Market, By Technology, 2017–2024 (USD Million)
Table 136 India: Atomic Absorption Spectroscopy Services Market, By Type, 2017–2024 (USD Million)
Table 137 India: Optical Emission Spectroscopy Services Market, By Type, 2017–2024 (USD Million)
Table 138 India: Trace Metal Analysis: Market, By Application, 2017–2024 (USD Million)
Table 139 RoAPAC: Trace Metal Analysis Instruments Market, By Technology, 2017–2024 (USD Million)
Table 140 RoAPAC: Trace Metal Analysis Instruments Market, By Type, 2017–2024 (USD Million)
Table 141 RoAPAC: Trace Metal Analysis Services Market, By Technology, 2017–2024 (USD Million)
Table 142 RoAPAC: Atomic Absorption Spectroscopy Services Market, By Type, 2017–2024 (USD Million)
Table 143 RoAPAC: Optical Emission Spectroscopy Services Market, By Type, 2017–2024 (USD Million)
Table 144 RoAPAC: Trace Metal Analysis: Market, By Application, 2017–2024 (USD Million)
Table 145 Latin America: Trace Metal Analysis Instruments Market, By Country, 2017–2024 (USD Million)
Table 146 Latin America: Trace Metal Analysis Services Market, By Country, 2017–2024 (USD Million)
Table 147 Latin America: Trace Metal Analysis Instruments Market, By Technology, 2017–2024 (USD Million)
Table 148 Latin America: Trace Metal Analysis Instruments Market, By Type, 2017–2024 (USD Million)
Table 149 Latin America: Trace Metal Analysis Services Market, By Technology, 2017–2024 (USD Million)
Table 150 Latin America: Atomic Absorption Spectroscopy Services Market, By Type, 2017–2024 (USD Million)
Table 151 Latin America: Optical Emission Spectroscopy Services Market, By Type, 2017–2024 (USD Million)
Table 152 Latin America: Trace Metal Analysis: Market, By Application, 2017–2024 (USD Million)
Table 153 Brazil: Trace Metal Analysis Instruments Market, By Technology, 2017–2024 (USD Million)
Table 154 Brazil: Trace Metal Analysis Instruments Market, By Type, 2017–2024 (USD Million)
Table 155 Brazil: Trace Metal Analysis Services Market, By Technology, 2017–2024 (USD Million)
Table 156 Brazil: Atomic Absorption Spectroscopy Services Market, By Type, 2017–2024 (USD Million)
Table 157 Brazil: Optical Emission Spectroscopy Services Market, By Type, 2017–2024 (USD Million)
Table 158 Brazil: Trace Metal Analysis: Market, By Application, 2017–2024 (USD Million)
Table 159 Mexico: Trace Metal Analysis Instruments Market, By Technology, 2017–2024 (USD Million)
Table 160 Mexico: Trace Metal Analysis Instruments Market, By Type, 2017–2024 (USD Million)
Table 161 Mexico: Trace Metal Analysis Services Market, By Technology, 2017–2024 (USD Million)
Table 162 Mexico: Atomic Absorption Spectroscopy Services Market, By Type, 2017–2024 (USD Million)
Table 163 Mexico: Optical Emission Spectroscopy Services Market, By Type, 2017–2024 (USD Million)
Table 164 Mexico: Trace Metal Analysis: Market, By Application, 2017–2024 (USD Million)
Table 165 RoLA: Trace Metal Analysis Instruments Market, By Technology, 2017–2024 (USD Million)
Table 166 RoLA: Trace Metal Analysis Instruments Market, By Type, 2017–2024 (USD Million)
Table 167 RoLA: Trace Metal Analysis Services Market, By Technology, 2017–2024 (USD Million)
Table 168 RoLA: Atomic Absorption Spectroscopy Services Market, By Type, 2017–2024 (USD Million)
Table 169 RoLA: Optical Emission Spectroscopy Services Market, By Type, 2017–2024 (USD Million)
Table 170 RoLA: Trace Metal Analysis: Market, By Application, 2017–2024 (USD Million)
Table 171 MEA: Trace Metal Analysis Instruments Market, By Technology, 2017–2024 (USD Million)
Table 172 MEA: Trace Metal Analysis Instruments Market, By Type, 2017–2024 (USD Million)
Table 173 MEA: Trace Metal Analysis Services Market, By Technology, 2017–2024 (USD Million)
Table 174 MEA: Atomic Absorption Spectroscopy Services Market, By Type, 2017–2024 (USD Million)
Table 175 MEA: Optical Emission Spectroscopy Services Market, By Type, 2017–2024 (USD Million)
Table 176 MEA: Trace Metal Analysis: Market, By Application, 2017–2024 (USD Million)
Table 177 Growth Strategy Matrix (2015–2018)
Table 178 Product Launches, Approvals, and Enhancements, 2015–2018
Table 179 Collaborations, Partnerships, and Agreements, 2015–2018
Table 180 Acquisitions, 2016–2019
Table 181 Expansions, 2016-2019
List of Figures (44 Figures)
Figure 1 Research Design
Figure 2 Primary Sources
Figure 3 Breakdown of Primary Interviews (Supply Side): By Company Type, Designation, and Region
Figure 4 Breakdown of Primary Interviews (Demand Side): By End User and Region
Figure 5 Data Triangulation Methodology
Figure 6 Trace Metal Analysis Instruments Market, By Technology, 2019 vs 2024 (USD Million)
Figure 7 Trace Metal Analysis Services Market, By Technology, 2019 vs 2024 (USD Million)
Figure 8 Atomic Absorption Spectroscopy Services Market, By Technology, 2019 vs 2024 (USD Million)
Figure 9 Optical Emission Spectroscopy Services Market, By Technology, 2019 vs 2024 (USD Million)
Figure 10 Trace Metal Analysis Instruments Market, By Type, 2019 vs 2024 (USD Million)
Figure 11 Market, By Application, 2019 vs 2024 (USD Million)
Figure 12 Market: Geographical Snapshot
Figure 13 Need to Comply With Safety and Quality Regulations in Applied Markets is Driving Market Growth
Figure 14 China Commanded the Largest Share of the APAC Market in 2018
Figure 15 US Accounted for the Largest Share of the Trace Metal Analysis: Market in 2018
Figure 16 Asia Pacific to Grow at the Highest CAGR During the Forecast Period
Figure 17 Developing Markets to Register Highest Growth During the Forecast Period
Figure 18 ICP-MS to Grow at the Highest Rate in the Trace Metal Analysis Instruments Market, By Technology During the Forecast Period
Figure 19 ICP-MS to Grow at the Highest Rate in the Trace Metal Analysis Services Market During the Forecast Period
Figure 20 ARC/Spark Optical Emission Spectroscopy Segment Will Continue to Dominate the Market in 2024
Figure 21 Flame Atomic Absorption Spectroscopy Segment Will Continue to Dominate the Market in 2024
Figure 22 Benchtop Instruments to Witness High Growth in the Trace Metal Analysis Instruments Market During the Forecast Period
Figure 23 Food & Beverage Testing Segment to Witness the Highest Growth in the Trace Metal Analysis: Market During the Forecast Period
Figure 24 Geographic Snapshot: Markets in Asia Pacific are Emerging Hotspots
Figure 25 North America: Trace Metal Analysis: Market Snapshot
Figure 26 Europe: Trace Metal Analysis: Market Snapshot
Figure 27 Asia Pacific: Trace Metal Analysis: Market Snapshot
Figure 28 Key Developments of Major Players Between January 2016 and February 2019
Figure 29 Trace Metal Analysis Instrument Market Share Analysis, By Key Player, 2018
Figure 30 SGS S.A., Led the Trace Metal Analysis Services Market in 2018
Figure 31 Competitive Leadership Mapping, Trace Metal Analysis: Market (2018)
Figure 32 Product & Service Launches, Enhancements, and Approvals Was the Key Growth Strategy Adopted By Major Players Between 2016 & 2019
Figure 33 Agilent Technologies, Inc: Company Snapshot (2018)
Figure 34 Thermo Fisher Scientific, Inc: Company Snapshot (2018)
Figure 35 Perkinelmer, Inc: Company Snapshot
Figure 36 Bruker Corporation: Company Snapshot (2018)
Figure 37 Hitachi High-Technologies Corporation: Company Snapshot (2017)
Figure 38 Shimadzu Corporation: Company Snapshot (2018)
Figure 39 Eurofins Scientific: Company Snapshot (2018)
Figure 40 Intertek Group PLC: Company Snapshot (2017)
Figure 41 TUV SUD: Company Snapshot (2017)
Figure 42 LGC Limited: Company Snapshot (2018)
Figure 43 SGS S.A.: Company Snapshot (2018)
Figure 44 Bereau Veritas: Company Snapshot (2018)
This study involved the extensive use of both primary and secondary sources. The research process involved the study of various factors affecting the industry to identify the segmentation types, industry trends, key players, competitive landscape, competitive leadership mapping, key market dynamics, and key player strategies.
Secondary Research
Secondary research process involves the widespread use of secondary sources, directories, databases (such as Bloomberg Businessweek, Factiva, and D&B Hoovers), white papers, annual reports, company house documents, investor presentations, and SEC filings of companies. Secondary research was used to identify and collect information useful for the extensive, technical, market-oriented, and commercial study of the trace metal analysis market. It was also used to obtain important information about the key players and market classification & segmentation according to industry trends to the bottom-most level, and key developments related to market and technology perspectives. A database of the key industry leaders was also prepared using secondary research.
Primary Research
In the primary research process, industry experts from both the supply and demand sides were interviewed to obtain qualitative and quantitative information for this report. Industry experts from the supply side include suppliers, distributors, CEOs, vice presidents, marketing and sales directors, business development managers, and technology and innovation directors of trace metal analysis instrument & service providers, whereas, industry experts from the demand side include industry experts such as vice presidents & directors of manufacturing companies from various industries such as pharmaceutical & biotechnology, medical device, semiconductor, oil & gas, and environmental testing; directors of clinical laboratories; contract manufacturing organizations; trace metal analysis technicians, outsourcing service providers and application experts; and other related key opinion leaders.
A breakdown of the primary respondents is provided below:
To know about the assumptions considered for the study, download the pdf brochure
Market Size Estimation
The market size estimates and forecasts provided in this study are derived through a mix of the bottom-up approach (revenue share analysis of leading players) and top-down approach (assessment of utilization/adoption/penetration trends, by technology, instrument type, and application).
Data Triangulation
After arriving at the market size, the total market was divided into several segments and subsegments. Data triangulation and market breakdown procedures were employed, wherever applicable to complete the overall market engineering process and arrive at the exact statistics for all segments & subsegments.
Objectives of the Study
- To define, describe, and forecast the trace metal analysis market, by technology, instrument type, application, and region
- To provide detailed information regarding the factors influencing market growth (such as drivers, restraints, opportunities, challenges, and industry trends)
- To analyze micromarkets1 with respect to individual growth trends, prospects, and contributions to the overall trace metal analysis market
- To analyze market opportunities for stakeholders and provide details of the competitive landscape for key players
- To strategically profile the key players in the market and comprehensively analyze their market shares and core competencies2
- To strategically analyze five different geographical regions, namely, North America, Europe, Asia Pacific, Latin America, and the Middle East & Africa
- To track and analyze competitive developments such as joint ventures and acquisitions, product developments and approvals, agreements, collaborations, partnerships, expansions, and funding activities in the trace metal analysis market
Available Customizations
With the given market data, MarketsandMarkets offers customizations as per the company’s specific needs. The following customization options are available for the report:
Company Information
- Detailed analysis and profiling of additional market players
Geographic Analysis
- A further breakdown of the Rest of Asia Pacific trace metal analysis market into South Korea, Australia, New Zealand, and others
- A further breakdown of the Rest of Latin American trace metal analysis market into Argentina, Chile, Peru, and Colombia and others.

 Generating Response ...


Growth opportunities and latent adjacency in Trace Metal Analysis Market