TV Analytics Market by TV Transmission Type (Cable TV, Satellite TV/ DTH, IPTV, and Over the Top (OTT)), Application (Customer Lifetime Management, Content Development, Competitive Intelligence, and Campaign Management) - Global Forecast to 2023


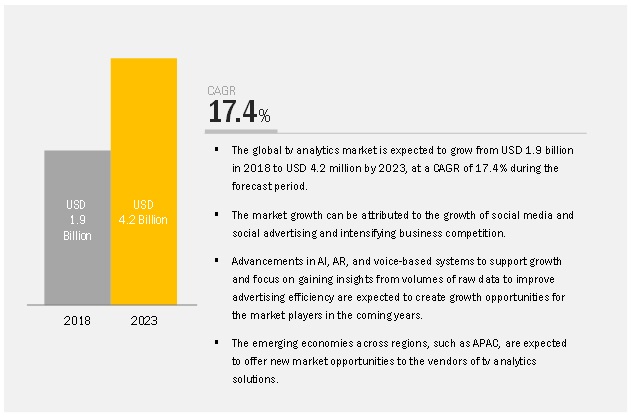
[144 Pages Report] The TV analytics market size is expected to grow from USD 1.9 billion in 2018 to USD 4.2 billion by 2023, at a Compound Annual Growth Rate (CAGR) of 17.4% during the forecast period. The study involved 4 major activities to estimate the current market size for market. An exhaustive secondary research was done to collect information on the market, the peer market, and the parent market. The next step was to validate these findings, assumptions, and sizing with the industry experts across the value chain through primary research. Both top-down and bottom-up approaches were employed to estimate the complete market size. Thereafter, the market breakdown and data triangulation procedures were used to estimate the market size of the segments and subsegments.
Secondary research
In the secondary research process, various secondary sources, such as Hoovers, Bloomberg BusinessWeek, and Dun & Bradstreet, have been referred for, to identify and collect information for this study. These secondary sources included annual reports; press releases and investor presentations of companies; whitepapers, certified publications and articles by recognized authors; gold standard and silver standard websites; TV analytics technology Research and Development (R&D) organizations; regulatory bodies; and databases.
Primary research
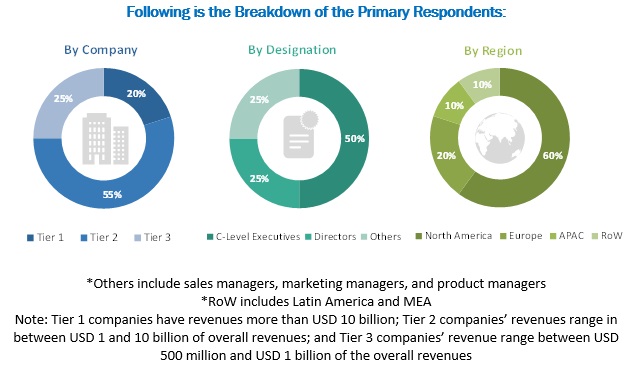
Various primary sources from both supply and demand sides of the TV analytics market ecosystem were interviewed to obtain qualitative and quantitative information for this study. The primary sources from the supply-side included industry experts, such as Chief Executive Officers (CEOs), Vice Presidents (VPs), marketing directors, technology and innovation directors, and related key executives from various vendors who provide the TV analytics software, associated service providers, and system integrators operating in the targeted regions. All possible parameters that affect the market covered in this research study have been accounted for, viewed in extensive detail, verified through primary research, and analyzed to get the final quantitative and qualitative data.
To know about the assumptions considered for the study, download the pdf brochure
Market size Estimation
For making market estimates and forecasting the TV analytics market and the other dependent submarkets, the top-down and bottom-up approaches were used. The bottom-up procedure was used to arrive at the overall market size of the global market using key companies� revenues and their offerings in the market. The research methodology used to estimate the market size includes the following:
- The key players in the market have been identified through extensive secondary research.
- The market size, in terms of value, has been determined with the help of the primary and secondary research processes.
- All percentage shares, splits, and breakdowns have been determined using secondary sources and verified through primary sources.
Data Triangulation
With data triangulation and validation through primary interviews, the exact value of the overall parent market size was determined and confirmed using this study. The overall market size was then used in the top-down procedure to estimate the size of other individual markets via percentage splits of the market segmentation.
Report Objectives
- To define, describe, and forecast the TV analytics market based on TV transmission types, components, deployment models, applications, and regions
- To provide detailed information related to the major factors, such as drivers, restraints, opportunities, and challenges, influencing the growth of the market
- To analyze the market�s subsegments with respect to the individual growth trends, prospects, and contributions to the total market
- To analyze opportunities in the market for stakeholders and provide the competitive landscape of the market
- To forecast the revenue of the market�s segments with respect to 5 major regions, namely, North America, Europe, Asia Pacific (APAC), Middle East and Africa (MEA), and Latin America
- To profile the key players and comprehensively analyze their recent developments and positioning in the market
- To analyze the competitive developments, such as mergers and acquisitions, new product developments, and R&D activities in the market
Scope of the TV Analytics Market Research Report
| Report Metrics |
Details |
|
Market size available for years |
2016�2023 |
|
Base year considered |
2017 |
|
Forecast period |
2018�2023 |
|
Forecast units |
Million (USD) |
|
Segments covered |
Type, Component, Deployment Model, Applications, and Region |
|
Geographies covered |
North America, APAC, Europe, Latin America, and MEA |
|
Companies covered |
IBM Corporation (US), Google (US), The Nielsen Company (UK), Zapr Media Labs (India), Alphonso Inc. (US), TVSQUARED (Scotland), DC Analytics (England), Amobee, Inc. (US), 605 (US), Clarivoy (US), TVbeat (UK), BLIX (Australia), H-Tech (Bulgaria), DC Analytics (Germany), SambaTV (US), AnalyticOwl (US), Edgeware AB (US), Realytics (France), Sorenson Media (US), FourthWall Media (US), Parrot Analytics (US), iSpot.tv (US), Admo.TV (France), Conviva (US), iQ Media (US), and BrightLine (US). |
This research report categorizes the TV analytics based on TV transmission types, components, deployment model, applications, and regions.
Based on TV Transmission types, the TV analytics has been segmented as follows:
- Cable TV
- Satellite TV/DTH
- IPTV
- OTT
Based on components, the market has been segmented as follows:
- Software
- Services
- Managed services
- Professional services
- Consulting
- Support and maintenance
Based on applications, the market has been segmented as follows:
- Competitive intelligence
- Churn prevention and behavior analysis
- Customer lifetime management
- Campaign management
- Content development
- Audience forecasting
- Others (brand effectiveness and customized pricing)
Based on deployment models, the TV analytics market has been segmented as follows
- On-premises
- Cloud
Based on regions, the market has been segmented as follows:
- North America
- US
- Canada
- Europe
- UK
- Germany
- Rest of Europe
- APAC
- China
- India
- Singapore
- Australia and New Zealand (ANZ)
- Rest of APAC
- Latin America
- Brazil
- Argentina
- Rest of Latin America
- MEA
- Middle East
- Africa
Available Customizations
With the given TV analytics market data, MarketsandMarkets offers customizations as per the company�s specific needs. The following customization options are available for the report:
Product Analysis
- Product matrix gives a detailed comparison of the product portfolio of each company
Company Information
- Detailed analysis and profiling of additional market players up to 5
The TV analytics market size is expected to grow from USD 1.9 billion in 2018 to USD 4.2 billion by 2023, at a Compound Annual Growth Rate (CAGR) of 17.4% during the forecast period. The intensifying business competition and the growth of social media and social advertising are driving the market. The TV industry has rapidly and significantly evolved since the last decade. With the overall development of the society, choices and preferences of the TV audiences have also become dynamic. The TV content developers are trying to meet the demands of their viewers by developing the content of audiences� preference. Moreover, the provision of real-time decision support and advanced analytics has played a major role in driving the adoption of TV analytics solutions and the associated services. Hence, TV analytics has become a key element for integrating and analyzing data to improve the overall business performance.
The TV analytics market study aims at estimating the market size and future growth potential of the market across segments, such as TV transmission types, components (software and services), applications, deployment models, and regions.
The software segment is estimated to constitute the largest market size during the forecast period
The TV analytics market by component covers TV analytics software and associated services. The software segment outperforms the services segment and would see the maturation in the future due to the higher adoption. Hence, professional services, such as consulting, and support and maintenance services, are expected to gain traction in the next 5 years.
The churn prevention and behavior analysis application is expected to grow at the highest CAGR during the forecast period
With the increasing market competition and content-savvy audiences, preventing customer churn has become more challenging. Deploying analytics over the digital content and the platforms helps content developers to get a holistic view of their viewers, and furthermore, in developing featured programs and recommending the type of content to the viewers.
The Over-The-Top (OTT) segment is expected to grow at the highest CAGR during the forecast period
The OTT content providers offer streaming media contents through the internet, which is faster than the other type of content provided by service providers. OTT content is collected using cookies and then analyzed using advanced machine learning and Artificial Intelligence (AI) platforms that provide deeper analysis into viewers� viewing behavior. OTT platform developers use advanced analytics to gauge consumers� viewing behaviors and curate their programs specifically. Netflix makes diverse use of AI and analytics to understand the demographics of the viewers and provide them with personalized content.
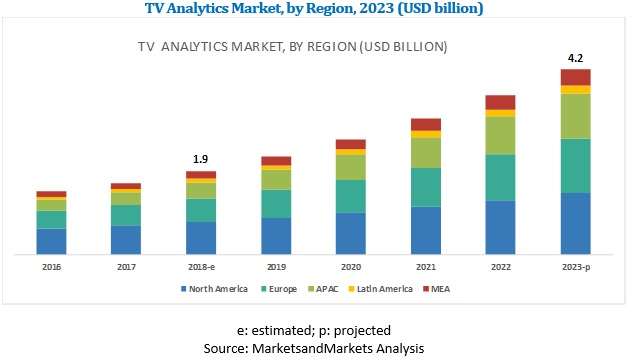
North America is expected to account for the largest market size during the forecast period.
The global TV analytics market by region covers 5 major geographic regions: North America, Asia Pacific (APAC), Europe, the Middle East and Africa (MEA), and Latin America. North America is estimated to account for the largest market size during the forecast period. North America is expected to hold the largest market share and dominate the market from 2018 to 2023, due to the presence of a large number of solution vendors in the US.
The market comprises major solution providers, such as IBM Corporation (US), Google (US), The Nielsen Company (UK), Zapr Media Labs (India), Alphonso Inc. (US), TVSQUARED (Scotland), Amobee, Inc. (US), 605 (US), Clarivoy (US), TVbeat (UK), BLIX (Australia), H-Tech (Bulgaria), DC Analytics (Germany), SambaTV (US), AnalyticOwl (US), Edgeware AB (US), Realytics (France), Sorenson Media (US), FourthWall Media (US), Parrot Analytics (US), iSpot.tv (US), Admo.TV (France), Conviva (US), iQ Media (US), and BrightLine (US). The study includes an in-depth competitive analysis of these key players in the TV analytics market with their company profiles, recent developments, and key market strategies.
Recent developments:
- In May 2018, 605 launched a new scientific approach, The 605 Impact Index, which is used to measure the impact of TV advertising campaigns on sales and branding. It would also help marketers strategize their investment plans for TV advertisements.
- In February 2018, Nielsen launched a new product placement measurement tool to compare product placements with the traditional advertising system. The insights from the measurement will be placed over linear TV, SVOD, short-form video, and subscription-based video.
- In November 2017, Google partnered with Salesforce to integrate its Analytics 360 Suite with Salesforce�s cloud platform. As per this partnership, Salesforce would offer customers various benefits and create customized audiences in Google Analytics 360.
Key questions addressed by the report:
- Define, describe, and forecast the TV analytics market based on TV transmission types, components, deployment modes applications, and regions.
- Detailed analysis of market�s subsegments with respect to individual growth trends, prospects, and contributors to the total market
- Revenue forecast of the market�s segments with respect to 5 major regions, namely, North America, Europe, APAC, MEA, and Latin America
- Detailed analysis of the competitive developments, such as mergers and acquisitions, new product developments, and business expansion activities, in the market
Analysis of the major factors, such as drivers, restraints, opportunities, and challenges, influencing the growth of the market.
To speak to our analyst for a discussion on the above findings, click Speak to Analyst
 Exclusive indicates content/data unique to MarketsandMarkets and not available with any competitors.
Table of Contents
1 Introduction (Page No. - 17)
1.1 Objectives of the Study
1.2 Market Definition
1.3 Market Scope
1.3.1 Regions Covered
1.4 Years Considered for the Study
1.5 Currency
1.6 Stakeholders
2 Research Methodology (Page No. - 21)
2.1 Research Data
2.1.1 Secondary Data
2.1.2 Primary Data
2.1.2.1 Breakup of Primaries
2.1.2.2 Key Industry Insights
2.1.2.3 Market Breakup and Data Triangulation
2.2 Market Size Estimation
2.3 Research Assumptions
2.4 Limitations
3 Executive Summary (Page No. - 28)
4 Premium Insights (Page No. - 31)
4.1 Attractive Market Opportunities in the TV Analytics Market
4.2 Market, By Component
4.3 Market, By Region
4.4 Market: Top 3 Applications and Regions
5 Market Overview (Page No. - 33)
5.1 Introduction
5.1.1 Drivers
5.1.1.1 Intensifying Business Competition
5.1.1.2 Growth of Social Media and Social Advertising
5.1.2 Restraints
5.1.2.1 Lack of Digital Infrastructure
5.1.3 Opportunities
5.1.3.1 To Gain Insights From Raw Data to Improve Advertising Efficiency
5.1.3.2 Advancements in Emerging Technologies Could Support the Market Growth
5.1.4 Challenges
5.1.4.1 Lack of Skilled Personnel
5.2 Industry Trends
5.2.1 TV Analytics: Use Cases
5.2.1.1 Use Case #1: Need to Optimize Media Spend to Drive Sales
5.2.1.2 Use Case #2: Measure the Impact of Campaign on Business KPIs
5.2.1.3 Use Case #3: Need to Reach Audience in Remote Regions
5.2.2 TV Analytics: Evolution
5.2.3 Regulations
5.2.3.1 European Union General Data Protection Regulation (GDPR)
6 TV Analytics Market, By TV Transmission Type (Page No. - 39)
6.1 Introduction
6.2 Cable TV
6.2.1 Competition From OTT and DTH Service Providers to Drive the Market
6.3 Satellite TV/Direct-To-Home
6.3.1 Increasing Demand for Managing Customer Lifetime and Reducing Customer Churn Substantially to Drive the Market
6.4 Internet Protocol Television
6.4.1 Pricing Strategies and Agility of Recommendation Engines to Spur the Demand for TV Analytics
6.5 Over-The-Top
6.5.1 Understanding the Demographics of Viewers and Providing Them With Personalized Contents to Improve ARPU to Encourage Content Creators and Distributors to Integrate Analytics
7 Market, By Component (Page No. - 45)
7.1 Introduction
7.2 Software
7.2.1 Increasing Demand for Cross-Platform Media to Track Audience Behavior Expected to Increase the Demand for TV Analytics Software
7.3 Services
7.3.1 Managed Services
7.3.1.1 Organizations Outsource Services to Gain Cost Advantages and Provide Clients on Time Delivery
7.3.2 Professional Services
7.3.2.1 Support and Maintenance
7.3.2.1.1 The Initial Need of Support and Maintenance During Pre-Installation and Post Installation Triggers the Growth of Support and Maintenance Services
7.3.2.2 Consulting
7.3.2.2.1 Consulting Services in the Market is Poised to Grow at A Steady Speed, as Enterprises are Realizing the Significance of Analytics in Their Service.
8 TV Analytics Market, By Application (Page No. - 53)
8.1 Introduction
8.2 Competitive Intelligence
8.2.1 Intensifying Competition Coupled With Dynamic Audience Demands to Drive the Demand for Competitive Intelligence
8.3 Churn Prevention and Behavior Analysis
8.3.1 Need for Optimizing Media Schedule and Retaining Audience to Drive the Demand for Churn Prevention and Behavior Analysis Application
8.4 Customer Lifetime Management
8.4.1 Focus on Improving Customer Relationship to Help the Growth of Customer Lifetime Management Application
8.5 Campaign Management
8.5.1 Emerging Need to Engage Audience for A Longer Period to Improve the Demand for Campaign Management Application
8.6 Content Development
8.6.1 Changing Content Consumption Behavior to Drive the Demand for Content Development Application Worldwide
8.7 Audience Forecasting
8.7.1 Audience Forecasting to Have A Key Role in Making Investment Decisions to Drive Its Demand
8.8 Others
8.8.1 Impact of Brands on Audience is A Key Factor Driving Business Continuity
9 Market, By Deployment Model (Page No. - 60)
9.1 Introduction
9.2 On-Premises
9.2.1 Prominence of Cable TV to Drive On-Premises Deployment of TV Analytics
9.3 Cloud
9.3.1 Focus on Improved Agility and ROI is the Driving Factor for Cloud Adoption
10 TV Analytics Market, By Region (Page No. - 64)
10.1 Introduction
10.2 North America
10.2.1 United States
10.2.1.1 US Accounted for the Largest Market Size in the Market in North America
10.2.2 Canada
10.2.2.1 Canada is Expected to Witness the Highest Growth Rate in the Market in North America
10.3 Europe
10.3.1 United Kingdom
10.3.1.1 OTT Trends in UK has Witnessed A Rapid Growth Due to the Proliferation of Smartphones and Smart TVs.
10.3.2 Germany
10.3.2.1 Germany is Expected to Witness the Highest Growth Rate in the Market in Europe
10.3.3 Rest of Europe
10.4 Asia Pacific
10.4.1 China
10.4.1.1 Emergence of Mobile Technologies, Cloud Computing, and Increased Automation Have Bolstered the Penetration of TV Analytics Solutions in China
10.4.2 India
10.4.2.1 Indian Market Being Highly Fragmented Offers Unprecedented Opportunities for TV Analytics Vendors in the Country.
10.4.3 Singapore
10.4.3.1 The Growing Market for OTT in Singapore is Expected to Trigger the Growth of Market.
10.4.4 Australia and New Zealand
10.4.4.1 Smartphone Penetration and Increase Demand of Video-On-Demand (VoD) Services are Propelling the Growth of Market.
10.4.5 Rest of Asia Pacific
10.5 Latin America
10.5.1 Brazil
10.5.1.1 Brazil Accounted for the Largest Market Size in the TV Analytics Market in Latin America
10.5.2 Argentina
10.5.2.1 Argentina is Expected to Witness the Highest Growth Rate in the Market in Latin America
10.5.3 Rest of Latin America
10.6 Middle East and Africa
10.6.1 Middle East
10.6.1.1 The Growing Interest in the Global Content is Expected to Open Opportunities for Global OTT Players and Other Streaming Service Providers Eventually Driving the Need for TV Analytics in the Middle East.
10.6.2 Africa
10.6.2.1 Affordable Internet Access Coupled With Rise in Digital Contents With Personalized Experience are Major Driving Factors for the Adoption of TV Analytics in Africa.
11 Competitive Landscape (Page No. - 88)
11.1 Overview
11.2 Market Ranking
11.3 Competitive Scenario
11.3.1 New Product Launches and Enhancements
11.3.2 Partnerships, Collaborations, and Agreements
11.3.3 Mergers and Acquisitions
12 Company Profiles (Page No. - 92)
(Business Overview, Solutions Offered, Recent Developments, SWOT Analysis, MnM View)*
12.1 IBM
12.2 Google
12.3 Nielsen
12.4 DC Analytics
12.5 Alphonso
12.6 Edgeware AB
12.7 Sambatv
12.8 Amobee
12.9 Clarivoy
12.10 Realytics
12.11 Tvsquared
12.12 Sorenson Media
12.13 Tvbeat
12.14 Fourthwall Media
12.15 Parrot Analytics
12.16 Ispot.TV
12.17 Admo.TV
12.18 Conviva
12.19 IQ Media
12.20 Brightline
12.21 Zapr Media Labs
12.22 605
12.23 Analyticowl
12.24 Blix
12.25 H-Tech
*Details on Business Overview, Solutions Offered, Recent Developments, SWOT Analysis, MnM View Might Not Be Captured in Case of Unlisted Companies.
13 Appendix (Page No. - 127)
13.1 Discussion Guide
13.2 Knowledge Store: MarketsandMarkets� Subscription Portal
13.3 Available Customizations
13.4 Related Reports
13.5 Author Details
List of Tables (66 Tables)
Table 1 United States Dollar Exchange Rate, 2015�2017
Table 2 TV Analytics Market Size and Growth Rate, 2016�2023 (USD Million, Y-O-Y %)
Table 3 Market Size, By TV Transmission Type, 2016�2023 (USD Million)
Table 4 Cable TV: Market Size, By Region, 2016�2023 (USD Million)
Table 5 Satellite TV: Market Size, By Region, 2016�2023 (USD Million)
Table 6 Internet Protocol Television: Market Size, By Region, 2016�2023 (USD Million)
Table 7 Over the Top: Market Size, By Region, 2016�2023 (USD Million)
Table 8 TV Analytics Market Size, By Component, 2016�2023 (USD Million)
Table 9 Software: Market Size, By Region, 2016�2023 (USD Million)
Table 10 Services: Market Size, By Type, 2016�2023 (USD Million)
Table 11 Services: Market Size, By Region, 2016�2023 (USD Million)
Table 12 Managed Services Market Size, By Region, 2016�2023 (USD Million)
Table 13 Professional Services Market Size, By Type, 2016�2023 (USD Million)
Table 14 Professional Services Market Size, By Region, 2016�2023 (USD Million)
Table 15 Support and Maintenance Market Size, By Region, 2016�2023 (USD Million)
Table 16 Consulting Market Size, By Region, 2016�2023 (USD Million)
Table 17 TV Analytics Market Size, By Application, 2016�2023 (USD Million)
Table 18 Competitive Intelligence: Market Size, By Region, 2016�2023 (USD Million)
Table 19 Churn Prevention and Behavior Analysis: Market Size, By Region, 2016�2023 (USD Million)
Table 20 Customer Lifetime Management: Market Size, By Region, 2016�2023 (USD Million)
Table 21 Campaign Management: Market Size, By Region, 2016�2023 (USD Million)
Table 22 Content Development: Market Size, By Region, 2016�2023 (USD Million)
Table 23 Audience Forecasting: Market Size, By Region, 2016�2023 (USD Million)
Table 24 Others: Market Size, By Region, 2016�2023 (USD Million)
Table 25 Market Size, By Deployment Model, 2016�2023 (USD Million)
Table 26 On-Premises: Market Size, By Region, 2016�2023 (USD Million)
Table 27 Cloud: Market Size, By Region, 2016�2023 (USD Million)
Table 28 Market Size, By Region, 2016�2023 (USD Million)
Table 29 North America: TV Analytics Market Size, By Country, 2016�2023 (USD Million)
Table 30 North America: Market Size, By TV Transmission Type, 2016�2023 (USD Million)
Table 31 North America: Market Size, By Component, 2016�2023 (USD Million)
Table 32 North America: Market Size, By Service, 2016�2023 (USD Million)
Table 33 North America: Market Size, By Professional Service, 2016�2023 (USD Million)
Table 34 North America: Market Size, By Application, 2016�2023 (USD Million)
Table 35 North America: Market Size, By Deployment Model, 2016�2023 (USD Million)
Table 36 Europe: TV Analytics Market Size, By Country, 2016�2023 (USD Million)
Table 37 Europe: Market Size, By TV Transmission Type, 2016�2023 (USD Million)
Table 38 Europe: Market Size, By Component, 2016�2023 (USD Million)
Table 39 Europe: Market Size, By Service, 2016�2023 (USD Million)
Table 40 Europe: Market Size, By Professional Service, 2016�2023 (USD Million)
Table 41 Europe: Market Size, By Application, 2016�2023 (USD Million)
Table 42 Europe: Market Size, By Deployment Model, 2016�2023 (USD Million)
Table 43 Asia Pacific: TV Analytics Market Size, By Country, 2016�2023 (USD Million)
Table 44 Asia Pacific: Market Size, By Type, 2016�2023 (USD Million)
Table 45 Asia Pacific: Market Size, By Component, 2016�2023 (USD Million)
Table 46 Asia Pacific: Market Size, By Service, 2016�2023 (USD Million)
Table 47 Asia Pacific: Market Size, By Professional Service, 2016�2023 (USD Million)
Table 48 Asia Pacific: Market Size, By Application, 2016�2023 (USD Million)
Table 49 Asia Pacific: Market Size, By Deployment Model, 2016�2023 (USD Million)
Table 50 Latin America: TV Analytics Market Size, By Country, 2016�2023 (USD Million)
Table 51 Latin America: Market Size, By TV Transmission Type, 2016�2023 (USD Million)
Table 52 Latin America: Market Size, By Component, 2016�2023 (USD Million)
Table 53 Latin America: Market Size, By Service, 2016�2023 (USD Million)
Table 54 Latin America: Market Size, By Professional Service, 2016�2023 (USD Million)
Table 55 Latin America: Market Size, By Application, 2016�2023 (USD Million)
Table 56 Latin America: Market Size, By Deployment Model, 2016�2023 (USD Million)
Table 57 Middle East and Africa: TV Analytics Market Size, By Sub-Region, 2016�2023 (USD Million)
Table 58 By Transmission Type, 2016�2023 (USD Million)
Table 59 Middle East and Africa: Market Size, By Component, 2016�2023 (USD Million)
Table 60 Middle East and Africa: Market Size, By Services, 2016�2023 (USD Million)
Table 61 Middle East and Africa: Market Size, By Professional Service, 2016�2023 (USD Million)
Table 62 Middle East and Africa: Market Size, By Application, 2016�2023 (USD Million)
Table 63 Middle East and Africa: Market Size, By Deployment Model, 2016�2023 (USD Million)
Table 64 New Product Launches and Enhancements, 2017�2018
Table 65 Partnerships, Collaborations, and Agreements, 2017�2018
Table 66 Mergers and Acquisitions, 2016�2018
List of Figures (33 Figures)
Figure 1 TV Analytics Market: Research Design
Figure 2 Market: Bottom-Up Approach
Figure 3 Market: Top-Down Approach
Figure 4 Market: Assumptions
Figure 5 Market, Top 3 Segments, 2018
Figure 6 Market, By Deployment Model, 2018
Figure 7 Growing Social Media and Social Advertising is Expected to Be A Major Growth Factor for the TV Analytics Market
Figure 8 Services Segment is Expected to Grow at A Higher CAGR in the Market During the Forecast Period
Figure 9 Asia Pacific is Expected to Grow at the Highest CAGR During the Forecast Period
Figure 10 Churn Prevention and Behaviour Analysis Application and North America are Estimated to Hold the Highest Market Shares in 2018
Figure 11 TV Analytics Market: Drivers, Restraints, Opportunities, and Challenges
Figure 12 Over-The-Top (OTT) TV Transmission Type is Expected to Hold the Largest Market Size During the Forecast Period
Figure 13 Monthly OTT Hours Viewed Per Household
Figure 14 Services Segment is Expected to Grow at A Higher CAGR During the Forecast Period
Figure 15 Managed Services Segment is Expected to Grow at A Higher CAGR During the Forecast Period
Figure 16 Consulting Services Segment is Expected to Account for the Larger Market Size By 2023
Figure 17 Churn Prevention and Behavior Analysis Segment is Expected to Grow at the Highest CAGR During the Forecast Period
Figure 18 Cloud Deployment Model is Expected to Hold A Larger Market Size During the Forecast Period
Figure 19 Asia Pacific is Expected to Grow at the Highest CAGR During the Forecast Period
Figure 20 North America: Market Snapshot
Figure 21 Asia Pacific: Market Snapshot
Figure 22 Broadcasting and Cable Services, India
Figure 23 Indian Subscribers in Millions
Figure 24 Key Developments By the Leading Players in the TV Analytics Market During 2017�2018
Figure 25 Google Led the Market in 2017�2018
Figure 26 IBM: Company Snapshot
Figure 27 SWOT Analysis: IBM
Figure 28 SWOT Analysis: Google
Figure 29 Nielsen: Company Snapshot
Figure 30 SWOT Analysis: Nielsen
Figure 31 SWOT Analysis: DC Analytics
Figure 32 SWOT Analysis: Alphonso
Figure 33 Edgeware AB: Company Snapshot


Growth opportunities and latent adjacency in TV Analytics Market