Ultrasonic Cleaning Market by Product (Benchtop, Standalone, Multistage-2, and Multistage-4), Power Output, Capacity, Vertical (Automotive, Aerospace, Food & Beverage, and Jewelry & Gems), and Geography - Global Forecast to 2025-2035


The global ultrasonic cleaning market was valued at USD 1.61 billion in 2024 and is estimated to reach USD 2.90 billion by 2035, at a CAGR of 5.5% between 2025 and 2035.
The ultrasonic cleaning market is characterized by its capability to deliver high precision and efficient cleaning solutions for a diverse range of applications, spanning from industrial components to sensitive healthcare instruments. Utilizing high-frequency sound waves, ultrasonic cleaners produce microcavitations in cleaning fluids that remove contaminants from complex surfaces without causing damage, supporting stringent cleanliness standards required in industries such as electronics, automotive, aerospace, and medical device manufacturing. The market's growth is driven by increasing emphasis on hygiene, safety, and operational efficiency, as well as rising adoption in facilities requiring advanced sanitation of water, air, and manufacturing surfaces. Demand for reliability, enhanced throughput, and the ability to handle challenging substrates continues to fuel innovation and expansion within the ultrasonic cleaning segment, supported by both regulatory trends and a focus on reducing manual labor in critical cleaning processes.

Ultrasonic cleaning is an advanced method that uses high-frequency sound waves to deliver precise, efficient, and non-destructive cleaning for complex and delicate items. It effectively removes contaminants from surfaces that traditional cleaning methods cannot reach, supporting industries like healthcare, automotive, and electronics where strict hygiene and quality standards matter. This technology is valued for its ability to ensure thorough, repeatable cleaning, increase operational efficiency, and address unique cleaning challenges in professional environments. As industries demand higher cleanliness and reliability, ultrasonic cleaning is seeing growing adoption for its speed, consistency, and suitability for intricate parts.
Market by Product
Benchtop
Benchtop ultrasonic cleaning systems hold the largest market share in the global ultrasonic cleaning market. Their dominance is driven by superior adaptability, compact size, and affordability—making them the preferred choice for small businesses, laboratories, dental clinics, and healthcare providers. Benchtop models offer efficient cleaning and quick turnaround times, which are essential for daily tasks involving delicate instruments, jewelry, and small mechanical parts. Their ease of use, versatility in solution compatibility, and widespread accessibility contribute significantly to their high adoption rates and overall market leadership.
Multistage-4
Multistage-4 ultrasonic cleaning systems are projected to grow at the highest CAGR over the coming years. This rapid growth is attributed to their advanced design, capability for programmable and automated cleaning cycles, and superior results in precision cleaning applications. Multistage-4 systems are increasingly favored in demanding industrial environments such as aerospace, electronics manufacturing, and automotive component cleaning, where consistent and repeatable multi-phase cleaning delivers enhanced operational throughput, reliability, and contaminant removal from complex assemblies. The integration of smart controls, IoT connectivity, and workflow automation further accelerates adoption, positioning multistage-4 systems as the market’s fastest-growing product segment. Manufacturers are focusing on these high-growth systems to meet the evolving needs of large-scale, high-value industrial clients.
Market by Vertical
Medical & Healthcare
The medical & healthcare vertical holds the largest market share in the global ultrasonic cleaning market, primarily due to strict hygiene standards and the increasing use of ultrasonic cleaners for sterilizing surgical instruments, dental tools, and laboratory equipment. Hospitals, clinics, and diagnostic centers depend on ultrasonic cleaning for efficient removal of biological residues and contaminants, ensuring patient safety and regulatory compliance. The technology's ability to provide thorough and gentle cleaning without damaging delicate instruments drives continued high adoption rates in healthcare and medical laboratories.
Food & Beverage
The food & beverage vertical is projected to grow at the highest CAGR during the forecast period. This growth is fueled by the rising demand for advanced cleaning solutions to maintain stringent hygiene standards in food processing, packaging, and bottling facilities. Ultrasonic cleaning systems are increasingly embraced for their effectiveness in removing oil, grease, organic contaminants, and mineral deposits from production lines and sensitive process equipment. Major food and beverage companies are utilizing ultrasonic technology to ensure product quality, safety, and compliance with evolving food safety regulations, supporting robust market expansion in this sector.
Market by Geography
North America holds the largest market share in the global ultrasonic cleaning market, driven by its strong presence in advanced industries such as healthcare, aerospace, automotive, and electronics. Rigorous regulatory standards for hygiene and precision cleaning, particularly from the FDA and EPA, have accelerated the adoption of ultrasonic cleaning technologies throughout medical and manufacturing sectors in the region. Major industry players and continuous investment in IoT-ready, automated cleaning systems further reinforce North America’s market leadership. Europe follows with robust demand from automotive and pharmaceuticals, while Asia Pacific is rapidly emerging as the fastest-growing region due to expanding industrialization and manufacturing capacity. The Rest of World (RoW) continues to show moderate growth, developing as regulations and infrastructure improve.
Market Dynamics
Driver: Regulatory Compliance Driving Ultrasonic Cleaning Market Growth
Stringent government regulations and evolving industry standards across sectors like manufacturing, healthcare, automotive, and energy are critical drivers for the ultrasonic cleaning market. Regulations such as the U.S. EPA’s environmental rules, European REACH and RoHS directives, and FDA sterilization protocols mandate effective, chemical-free cleaning methods, pushing industries towards ultrasonic cleaning technologies. Ultrasonic cleaning aligns well with these requirements by delivering efficient contaminant removal while minimizing environmental impact through water-based solutions. This regulatory landscape drives the adoption of automated, IoT-enabled ultrasonic systems, particularly in medical device sterilization and precision manufacturing, where traceability and repeatability are essential. Consequently, regulatory compliance motivates innovation, infrastructure investments, and sustainable practices, fueling ongoing market expansion worldwide.
Restraint: High Initial Investment and Maintenance Costs
One of the most significant restraints in the ultrasonic cleaning market is the high upfront cost of purchasing and installing industrial-grade ultrasonic cleaning systems. These advanced systems with features like automation, multi-tank setups, and IoT connectivity often come with a premium price tag, making it difficult for small and medium enterprises to adopt. Additionally, ongoing maintenance costs, including regular servicing, replacement of transducers and other components, and the use of specialized cleaning solutions, add to the total cost of ownership. This financial barrier restricts market penetration in price-sensitive sectors and regions with limited technical support infrastructure.
Opportunity: Technological Innovations and Eco-Friendly Solutions
The ultrasonic cleaning market stands to benefit significantly from ongoing technological advancements such as multi-frequency and multistage ultrasonic systems, IoT integration, and automation. Multi-frequency cleaners offer enhanced versatility, enabling users to tailor ultrasonic waves to different contaminants and materials for more effective cleaning. The rise of IoT-enabled smart ultrasonic cleaners facilitates real-time monitoring, predictive maintenance, and remote operation, improving efficiency while reducing downtime and manual intervention. Additionally, the growing emphasis on eco-friendly aqueous cleaning solutions aligns with stricter environmental regulations, driving adoption in industries prioritizing sustainability. These developments open new application areas in healthcare, aerospace, automotive manufacturing, and electronics, fueling robust market growth by combining precision cleaning with operational cost savings and environmental compliance.
Challenge: Talent Shortage and Technical Complexity
A major challenge facing the ultrasonic cleaning market is the shortage of skilled technicians proficient in operating and maintaining complex ultrasonic cleaning equipment. The technology requires specialized knowledge to optimize cleaning parameters and ensure efficient contamination removal without damaging delicate parts. Additionally, the technical complexity makes onboarding and regular maintenance challenging, particularly for small enterprises or those in developing regions. This skill gap hinders widespread adoption and may lead to suboptimal cleaning performance or equipment downtime, slowing market growth despite rising demand.
Future Outlook
The future outlook for the ultrasonic cleaning market from 2025 to 2033 suggests a pattern of moderate and steady growth, rather than dynamic or explosive expansion. The sector is forecasted to advance incrementally, primarily supported by gradual adoption in healthcare, automotive, electronics, and industrial manufacturing, driven by ongoing needs for precision cleaning and regulatory compliance. While technological innovations and sustainability trends remain important, they are likely to spur incremental improvements and market penetration rather than sharp surges in demand. The competitive landscape is expected to remain stable, with most growth arising from slow and consistent increases in market adoption and upgrades, rather than transformative new applications. As a result, the ultrasonic cleaning market is anticipated to provide reliable but relatively subdued growth opportunities for technology vendors and service providers throughout the coming decade.
Key Market Players
Top ultrasonic cleaning companies include Emerson Electric Co. (US), Blue Wave Ultrasonics (US), Crest Ultrasonics Corp. (US), Omegasonics (US), and Guangdong GT Ultrasonic Co.,Ltd . (China)
Key Questions addressed in this report:
- What are the global trends in demand for the market?
- What are the upcoming technologies/product areas that will have a significant impact on the market in the future?
- What will be the revenue pockets for the market players in the next 10 years?
- What are the prime strategies followed by key players in the market?
 Exclusive indicates content/data unique to MarketsandMarkets and not available with any competitors.
Table of Contents
1 Introduction (Page No. - 18)
1.1 Study Objectives
1.2 Definition
1.3 Scope of the Study
1.3.1 Markets Covered
1.3.2 Geographic Scope
1.3.3 Years Considered for the Study
1.4 Currency
1.5 Limitations
1.6 Package Size
1.7 Stakeholders
2 Research Methodology (Page No. - 22)
2.1 Research Data
2.1.1 Secondary Data
2.1.1.1 Secondary Sources
2.1.2 Primary Data
2.1.2.1 Key Data From Primary Sources
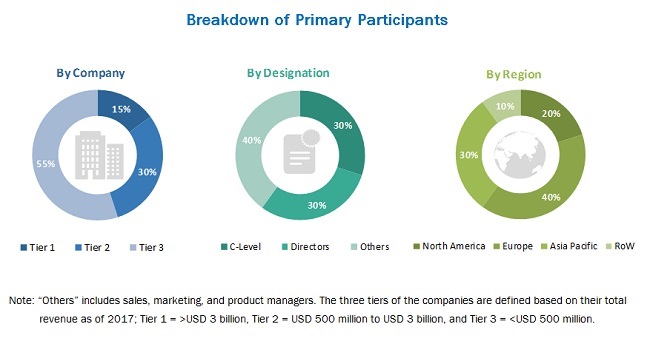
2.1.2.2 Breakdown of Primary Profiles
2.2 Secondary and Primary Research
2.2.1 Key Industry Insights
2.3 Market Size Estimation
2.3.1 Bottom-Up Approach
2.3.2 Top-Down Approach
2.4 Market Breakup and Data Triangulation
2.5 Research Assumptions
2.5.1 Assumptions
3 Executive Summary (Page No. - 30)
4 Premium Insights (Page No. - 34)
4.1 Attractive Market Opportunities in the Market
4.2 Market, By Product
4.3 Market in Asia Pacific, By Country and Vertical
4.4 Market, By Geography
5 Market Overview (Page No. - 37)
5.1 Introduction
5.2 Market Dynamics
5.2.1 Drivers
5.2.1.1 Improving Efficiency and Safety in Cleaning Operations of Components
5.2.1.2 Eco-Friendly Cleaning Process With Biodegradable Waste Discharge
5.2.2 Restraints
5.2.2.1 Lack of Skills and Expertise to Deploy and Design Ultrasonic Cleaning Systems
5.2.3 Opportunities
5.2.3.1 Increasing Demand for Customized Ultrasonic Cleaning Systems
5.2.4 Challenges
5.2.4.1 Lack of Product Differentiation By Industry Players
6 Industry Trends (Page No. - 40)
6.1 Value Chain Analysis
6.2 Emerging Trends
6.2.1 Deployment of the Robotic Automation Technology for the Precision Ultrasonic Cleaning Application
7 Ultrasonic Cleaning Market, By Product (Page No. - 42)
7.1 Introduction
7.2 Benchtop
7.2.1 Increasing Adoption of Benchtop Products Due to High Turnaround Time for Cleaning and Compact Size
7.3 Standalone
7.3.1 Increasing Adoption of Standalone Products for Effective Removal of Containminant From Inaccessable Areas
7.4 Multistage-2
7.4.1 Increasing Demand for Multistage-2 Products for Precision Cleaning Application
7.5 Multistage-4
7.5.1 Increasing Demand for Multistage-4 Products for Machined Component Cleaning to Drive the Market Growth
8 Ultrasonic Cleaning Market, By Power Output (Page No. - 55)
8.1 Introduction
8.2 Up to 250 W
8.2.1 Market for 250–500 W Power Output to Grow at A Significant Rate Due to Higher Adoption in Benchtop Products
8.3 250–500 W
8.3.1 Market for 250–500 W Power Output to Grow at A Significant Rate Due to Increasing Adoption in Jewelry & Gems Verticals
8.4 500–1000 W
8.4.1 Market for 500–1000 W Power Output to Hold Largest Share Due to Widely Adopted Across All Vertical
8.5 1000–2000 W
8.5.1 Market For1000–2000 W Power Output to Grow at Highest CAGR During Forecast Period
8.6 2000–5000 W
8.6.1 5000–10000 W Power Output Range Majorly Deployed at Multistage Products Due to High Power Requirement
8.7 5000–10000 W
8.7.1 Market for 5000–10000 W Power Output to Provide Significant Opportunities in Multistage-2 Products
8.8 More Than 10000 W
8.8.1 Market for More Than 10000 W Power Output to Grow at A Significant Rate Due to the Increasing Use of Multistage Products
9 Ultrasonic Cleaning Market, By Capacity (Page No. - 61)
9.1 Introduction
9.2 Up to 5 L
9.2.1 Market for 5 L Tank Capacity to Grow at the Highest CAGR for the Aerospace Vertical
9.3 10–50 L Capacity
9.3.1 Market for 10–50 L Tank Capcity to Held the Largest Market Size for the Medical & Healthcare Vertical
9.4 50–100 L Capacity
9.4.1 Market for 50–100 L Tank Capcity to Grow at the Highest CAGR for the Food & Beverage Vertical
9.5 100–150 L Capacity
9.5.1 Increasing Use of 100–150 L Tank Capcity for Industrial Component Cleaning to Offer Lucurative Opporunities
9.6 150–200 L Capacity
9.6.1 Increasing Adoption of 150–200 L Tank Capcity By Automotive and Metal & Machinery Vertical to Drive the Market Growth
9.7 200–250 L Capacity
9.7.1 Increasing Adoption of 200–250 L Tank Capcity By Multistage Products to Provide Efficent Cleaning of Components
9.8 250–300 L
9.8.1 Increasing Adoption of 250–300 L Tank Capcity By Multistage Products for Degrasing and Descaling Application
9.9 More Than 300 L
9.9.1 Growing Use of More Than 300 L Tank Capacity for Complex Component Cleaning in Decarbonizing Application
10 Ultrasonic Cleaning Market, By Vertical (Page No. - 72)
10.1 Introduction
10.2 Medical & Healthcare
10.2.1 Medical & Healthcare Vertical to Hold the Largest Market Size During Forecast Period
10.3 Automotive
10.3.1 Increasing Deployment of Ultrasonic Cleaner for Automotive Component Cleaning to Offer Promising Market Opporunities
10.4 Food & Beverage
10.4.1 Food & Beverage Vertical to Grow at the Highest CAGR During Forecast Period
10.5 Metal & Machinery
10.5.1 Adoption of Ultrasonic Cleaners for Efficcent Cleaning to Drive the Market Growth
10.6 Electrical & Electronics
10.6.1 Growing Demand From Component Manufacturers to Drive the Market Growth
10.7 Jewelry & Gems
10.7.1 Market for Jewelry & Gems Cleaning Offers Lucurative Opportunities for Benchtop Products
10.8 Optics
10.8.1 Growing Demand for Efficcent Cleaning Products to Drive the Market Growth
10.9 Aerospace
10.9.1 Growing Demand Precision Cleaning of Components to Drive Market for the Aerospace Vertical
10.10 Pharmaceuticals
10.10.1 Growing Demand From Drug Manufacturers to Drivre the Market Growth in the Pharmaceuticals Vertical
10.11 Other Verticals
10.11.1 Increasing Demand From Household and Commercial Application to Drive the Market for Other Vertical
11 Geographic Analysis (Page No. - 104)
11.1 Introduction
11.2 North America
11.2.1 United States
11.2.1.1 United States to Dominate the Largest Share of the North American Industry
11.2.2 Canada
11.2.2.1 Canada to Hold A Significant Share of the North American Market
11.2.3 Mexico
11.2.3.1 Mexico to Grow at A Significant CAGR During the Forecast Period
11.3 Europe
11.3.1 Germany
11.3.1.1 Growing Demand From the Automotive Industry to Drive the Market in Germany
11.3.2 France
11.3.2.1 Aerospace Vertical to Drive the Market in France
11.3.3 United Kingdom
11.3.3.1 Presence of Large Number of Ultrasonic Products and Service Providers to Drive the Market in the UK
11.3.4 Rest of Europe
11.3.4.1 Growing Demand From Oems and Manufacturers to Drive the Market in Rest of Europe
11.4 Asia Pacific
11.4.1 China
11.4.1.1 Major Industrial Base and Growing Manufacturing Activities to Drive the Market in China
11.4.2 Japan
11.4.2.1 Growing Demand From Optics and Electrical & Electronics Verticals to Drive the Market in Japan
11.4.3 South Korea
11.4.3.1 Growing Demand From Electronic Component Manufacturers to Drive the Market in South Korea
11.4.4 Rest of Asia Pacific
11.4.4.1 Growing Demand From End-Use Industries to Drive the Market in Rest of Asia Pacific
11.5 Rest of World
11.5.1 South America
11.5.1.1 Growing Manufacturing Activities to Drive the Market in South America
11.5.2 Middle East and Africa
11.5.2.1 Increasing Demand From the Aerospace Vertical to Drive the Market in Middle East and Africa
12 Competitive Landscape (Page No. - 117)
12.1 Introduction
12.2 Ultrasonics Cleaning Market Ranking Analysis, 2018
12.3 Competitive Leadership Mapping
12.3.1 Visionary Leaders
12.3.2 Dynamic Differentiators
12.3.3 Innovators
12.3.4 Emerging Companies
12.4 Strength of Product Portfolio (For All 25 Players)
12.5 Business Strategy Excellence (For All 25 Players)
12.6 Competitive Situations and Trends
12.6.1 New Product Launches
12.6.2 Expansions
12.6.3 Collaborations and Agreements
13 Company Profiles (Page No. - 126)
(Business overview, Products offered, Recent Developments, SWOT Analysis, MNM view)*
13.1 Key Players
13.1.1 Branson Ultrasonic Corporation
13.1.2 Blue Wave Ultrasonics
13.1.3 Crest Ultrasonics
13.1.4 GT Sonic
13.1.5 Omegasonics
13.1.6 Telsonic AG Group
13.1.7 Sharpertek
13.1.8 Mettler Electronics Corp.
13.1.9 Cleaning Technologies Group, LLC
13.1.10 Morantz Ultrasonics
13.2 Other Players
13.2.1 Tierratech
13.2.2 Caresonic
13.2.3 Roop Telsonics Ultrasonicx
13.2.4 Skymen Cleaning Equipment
13.2.5 Hilsonic
13.2.6 Alphasonic
13.2.7 Anmasi Precision Cleaning
13.2.8 Sonic Solutions
13.2.9 Steris PLC
13.2.10 Kemet International Limited
13.2.11 Limplusonic
*Details on Business overview, Products offered, Recent Developments, SWOT Analysis, MNM view might not be captured in case of unlisted companies.
14 Appendix (Page No. - 151)
14.1 Discussion Guide
14.2 Knowledge Store: Marketsandmarkets’ Subscription Portal
14.3 Available Customizations
14.4 Related Reports
14.5 Author Details
List of Tables (112 Tables)
Table 1 Ultrasonic Cleaning Market, Volume Shipment, 2016–2024 (Units)
Table 2 Market, By Product, 2016–2024 (USD Million)
Table 3 Benchtop: Ultrasonic Cleaning Market Size, By Power Output, 2016–2024 (USD Million)
Table 4 Benchtop: Market Size, By Capacity, 2016–2024 (USD Million)
Table 5 Benchtop: Market Size, By Vertical, 2016–2024 (USD Million)
Table 6 Standalone: Ultrasonic Cleaning Market Size, By Power Output, 2016–2024 (USD Million)
Table 7 Standalone: Market Size, By Capacity, 2016–2024 (USD Million)
Table 8 Standalone: Market Size, By Vertical, 2016–2024 (USD Million)
Table 9 Multistage-2: Ultrasonic Cleaning Market Size, By Power Output, 2016–2024 (USD Million)
Table 10 Multistage-2: Market, By Capacity, 2016–2024 (USD Million)
Table 11 Multistage-2: Market Size, By Vertical, 2016–2024 (USD Million)
Table 12 Multistage-4: Ultrasonic Cleaning Market Size, By Power Output, 2016–2024 (USD Million)
Table 13 Multistage-4: Market, By Capacity, 2016–2024 (USD Million)
Table 14 Multistage-4: Market, By Vertical, 2016–2024 (USD Million)
Table 15 Ultrasonic Cleaning Market, By Power Output, 2016–2024 (USD Million)
Table 16 Up to 250 W: Market Size, By Product, 2016–2024 (USD Million)
Table 17 250–500 W: Market Size, By Product, 2016–2024 (USD Million)
Table 18 500–1000 W: Market Size, By Product, 2016–2024 (USD Million)
Table 19 1000–2000 W: Market, By Product, 2016–2024 (USD Million)
Table 20 2000–5000 W: Market, By Product, 2016–2024 (USD Million)
Table 21 5000–10000 W: Market Size, By Product, 2016–2024 (USD Million)
Table 22 More Than 10000 W: Market Size, By Product, 2016–2024 (USD Million)
Table 23 Ultrasonic Cleaning Market, By Capacity, 2016–2024 (USD Million)
Table 24 Up to 5 L: Market Size, By Vertical, 2016–2024 (USD Million)
Table 25 Up to 5l: Market Size, By Product, 2016–2024 (USD Million)
Table 26 10–50 L: Market Size, By Vertical, 2016–2024 (USD Million)
Table 27 10–50 L: Market Size, By Product, 2016–2024 (USD Million)
Table 28 Up to 50–100 L: Market Size, By Vertical, 2016–2024 (USD Million)
Table 29 50–100 L : Market Size, By Product, 2016–2024 (USD Million)
Table 30 100–150 L: Market Size, By Vertical, 2016–2024 (USD Million)
Table 31 100–150 L: Market Size, By Product, 2016–2024 (USD Million)
Table 32 150–200 L: Market, By Vertical, 2016–2024 (USD Million)
Table 33 150–200 L: Market Size, By Vertical, 2016–2024 (USD Million)
Table 34 200–250 L: Market Size, By Vertical, 2016–2024 (USD Million)
Table 35 200–250 L: Market, By Vertical, 2016–2024 (USD Million)
Table 36 250–300 L: Market Size, By Vertical, 2016–2024 (USD Million)
Table 37 Ultrasonic Cleaning Market for 250–300 L Capacity, By Product, 2016–2024 (USD Million)
Table 38 More Than 300 L: Market Size, By Vertical, 2016–2024 (USD Million)
Table 39 More Than 300 L: Market , By Product, 2016–2024 (USD Million)
Table 40 Ultrasonic Cleaning Market, By Vertical, 2016–2024 (USD Million)
Table 41 Medical & Healthcare: Ultrasonic Cleaning Market, By Region, 2016–2024 (USD Million)
Table 42 Medical & Healthcare: Market Size in North America, By Country, 2016–2024 (USD Million)
Table 43 Medical & Healthcare: Market Size in Europe, By Country, 2016–2024 (USD Million)
Table 44 Medical & Healthcare: Market Size in Asia Pacific, By Country, 2016–2024 (USD Million)
Table 45 Medical & Healthcare: Market Size in RoW, By Region, 2016–2024 (USD Million)
Table 46 Medical & Healthcare: Market Size, By Product, 2016–2024 (USD Million)
Table 47 Automotive: Ultrasonic Cleaning Market Size, By Region, 2016–2024 (USD Million)
Table 48 Automotive: Market Size in North America, By Country, 2016–2024 (USD Million)
Table 49 Automotive: Market Size in Europe, By Country, 2016–2024 (USD Million)
Table 50 Automotive: Market Size in Asia Pacific, By Country, 2016–2024 (USD Million)
Table 51 Automotive: Market Size in RoW, By Region, 2016–2024 (USD Million)
Table 52 Automotive: Market Size, By Product, 2016–2024 (USD Million)
Table 53 Food & Beverage: Ultrasonic Cleaning Market Size, By Region, 2016–2024 (USD Million)
Table 54 Food & Beverage: Market Size in North America, By Country, 2016–2024 (USD Million)
Table 55 Food & Beverage: Market Size in Europe, By Country, 2016–2024 (USD Million)
Table 56 Food & Beverage: Market Size in Asia Pacific, By Country, 2016–2024 (USD Million)
Table 57 Food & Beverage: Market Size in RoW, By Region, 2016–2024 (USD Million)
Table 58 Food & Beverage: Market Size, By Product, 2016–2024 (USD Million)
Table 59 Metal & Machinery: Ultrasonic Cleaning Market Size, By Region, 2016–2024 (USD Million)
Table 60 Metal & Machinery: Market Size in North America, By Country, 2016–2024 (USD Million)
Table 61 Metal & Machinery: Market Size in Europe, By Country, 2016–2024 (USD Million)
Table 62 Metal & Machinery: Market Size in APAC, By Country, 2016–2024 (USD Million)
Table 63 Metal & Machinery: Market Size in RoW, By Region, 2016–2024 (USD Million)
Table 64 Metal & Machinery: Market Size, By Product, 2016–2024 (USD Million)
Table 65 Electrical & Electronics: Ultrasonic Cleaning Market Size, By Region, 2016–2024 (USD Million)
Table 66 Electrical & Electronics: Market Size in North America, By Country, 2016–2024 (USD Million)
Table 67 Electrical & Electronics: Market in Europe, By Country, 2016–2024 (USD Million)
Table 68 Electrical & Electronics: Market Size in Asia Pacific, By Country, 2016–2024 (USD Million)
Table 69 Electrical & Electronics: Market Size in RoW, By Region, 2016–2024 (USD Million)
Table 70 Electrical & Electronics: Market Size, By Product, 2016–2024 (USD Million)
Table 71 Jewelry & Gems: Ultrasonic Cleaning Market Size, By Region, 2016–2024 (USD Million)
Table 72 Jewelry & Gems: Market in North America, By Country, 2016–2024 (USD Million)
Table 73 Jewelry & Gems: Market Size in Europe, By Country, 2016–2024 (USD Million)
Table 74 Jewelry & Gems: Market Size in APAC, By Country, 2016–2024 (USD Million)
Table 75 Jewelry & Gems: Market Size in RoW, By Region, 2016–2024 (USD Million)
Table 76 Jewelry & Gems: Market Size, By Product, 2016–2024 (USD Million)
Table 77 Optics: Ultrasonic Cleaning Market Size, By Region, 2016–2024 (USD Million)
Table 78 Optics: Market in North America, By Country, 2016–2024 (USD Million)
Table 79 Optics: Market Size in Europe, By Country, 2016–2024 (USD Million)
Table 80 Optics: Market Size in APAC, By Country, 2016–2024 (USD Million)
Table 81 Optics: Market Size in RoW, By Region, 2016–2024 (USD Million)
Table 82 Optics: Market Size, By Product, 2016–2024 (USD Million)
Table 83 Aerospace: Ultrasonic Cleaning Market Size, By Region, 2016–2024 (USD Million)
Table 84 Aerospace: Market Size in North America, By Country, 2016–2024 (USD Million)
Table 85 Aerospace: Market Size in Europe, By Country, 2016–2024 (USD Million)
Table 86 Aerospace: Market Size in APAC, By Country, 2016–2024 (USD Million)
Table 87 Aerospace: Market Size in RoW, By Region, 2016–2024 (USD Million)
Table 88 Aerospace: Market Size, By Product, 2016–2024 (USD Million)
Table 89 Pharmaceuticals: Ultrasonic Cleaning Market Size, By Region, 2016–2024 (USD Million)
Table 90 Pharmaceuticals: Market in North America, By Country, 2016–2024 (USD Million)
Table 91 Pharmaceuticals: Market Size in Europe, By Country, 2016–2024 (USD Million)
Table 92 Pharmaceuticals: Market Size in Asia Pacific, By Country, 2016–2024 (USD Million)
Table 93 Pharmaceuticals: Market Size in RoW, By Region, 2016–2024 (USD Million)
Table 94 Pharmaceuticals: Market Size, By Product, 2016–2024 (USD Million)
Table 95 Others: Ultrasonic Cleaning Market Size, By Region, 2016–2024 (USD Million)
Table 96 Others: Market Size in North America, By Country, 2016–2024 (USD Million)
Table 97 Others: Market Size in Europe, By Country, 2016–2024 (USD Million)
Table 98 Others: Market Size in APAC, By Country, 2016–2024 (USD Million)
Table 99 Others: Market Size in RoW, By Region, 2016–2024 (USD Million)
Table 100 Others: Market Size, By Product, 2016–2024 (USD Million)
Table 101 Ultrasonic Cleaning Market, By Region, 2016–2024 (USD Million)
Table 102 North America: Market Size, By Country, 2016–2024 (USD Million)
Table 103 North America: Market Size, By Vertical, 2016–2024 (USD Million)
Table 104 Europe: Market Size, By Country, 2016–2024 (USD Million)
Table 105 Europe: Market Size, By Vertical, 2016–2024 (USD Million)
Table 106 Asia Pacific: Market Size, By Country, 2016–2024 (USD Million)
Table 107 Asia Pacific: Market Size, By Vertical, 2016–2024 (USD Million)
Table 108 RoW: Market Size, By Region, 2016–2024 (USD Million)
Table 109 RoW: Market Size, By Vertical, 2016–2024 (USD Million)
Table 110 New Product Launches, 2016–2018
Table 111 Expansions, 2016–2018
Table 112 Collaborations and Agreements, 2016–2018
List of Figures (39 Figures)
Figure 1 Ultrasonic Cleaning Market Segmentation
Figure 2 Market: Research Design
Figure 3 Market: Bottom-Up Approach
Figure 4 Market: Top-Down Approach
Figure 5 Data Triangulation
Figure 6 Benchtop Segment to Account for the Largest Size of the Market, By Product, in 2019
Figure 7 150–200 L Capacity Tanks to Witness the Highest CAGR in the Market During the Forecast Period
Figure 8 500–1000 W Power Output to Grow at the Largest Market Size During the Forecast Period
Figure 9 Medical & Healthcare Vertical to Account for the Largest Size of the Market in 2018
Figure 10 North America to Account for the Largest Share of the Market in 2018
Figure 11 Increasing Demand for Precision and Efficient Cleaning to Propel the Market Growth During the Forecast Period
Figure 12 Benchtop Segment to Account for the Largest Share of the Market By 2024
Figure 13 China and Automotive Vertical to Account for the Largest Shares of the Market in 2019
Figure 14 United States Accounted for the Largest Share of the Overall Market in 2018
Figure 15 Increasing Demand for Quality Assurance and Automation to Drive the Market Growth
Figure 16 Component Suppliers and Original Equipment Manufacturers Add Maximum Value to Ultrasonic Cleaning Value Chain
Figure 17 Benchtop Segment to Account for the Largest Market Size During the Forecast Period
Figure 18 Tank Capacity 50–100 L to Hold the Largest Market Size for Benchtop Products During the Forecast Period
Figure 19 2000–5000 W Power Output Range to Hold the Largest Market Size in 2019
Figure 20 Capacity of 250–300 L to Dominate the Market for Multistage- 2 Products During the Forecast Period
Figure 21 1000–2000 W Power Output to Grow at the Highest CAGR During the Forecast Period
Figure 22 500–1000 W Power Output Segment to Account for the Largest Market Size During Forecast Period
Figure 23 10–50 L Capacity Segment to Account for the Largest Market Size During Forecast Period
Figure 24 Food Beverage Vertical to Grow the Highest CAGR During the Forecast Period
Figure 25 Medical and Healthcare Vertical to Hold the Largest Size of Market During the Forecast Period
Figure 26 APAC to Dominate Ultrasonic Cleaning Market for the Automotive Vertical During the Forecast Period
Figure 27 APAC to Grow at the Highest CAGR During the Forecast Period in the Food & Beverage Vertical
Figure 28 China to Account for the Largest Size of the Market in APAC During the Forecast Period
Figure 29 United States to Account for the Largest Size of the Market for the Optics Vertical During the Forecast Period
Figure 30 France to Grow at the Highest CAGR for the Aerospace Vertical During the Forecast Period
Figure 31 Market in APAC to Grow at the Highest CAGR During the Forecast Period
Figure 32 North America: Market Snapshot
Figure 33 Europe: Market Snapshot
Figure 34 Asia Pacific: Market Snapshot
Figure 35 Market in South America to Grow at A Higher CAGR During the Forecast Period
Figure 36 Players in the Market Adopted Product Launches as Their Key Growth Strategy During 2016–2018
Figure 37 Ranking Analysis of Ultrasonic Cleaning Market Players, 2018
Figure 38 Market (Global) Competitive Leadership Mapping, 2018
Figure 39 New Product Launches and Acquisitions Emerged as Key Business Strategies Adopted By Market Players From 2016 to 2018
The study involved four major activities in estimating the current size of the ultrasonic cleaning market. Exhaustive secondary research has been done to collect information about the market, the peer market, and the parent market. Validating findings, assumptions, and sizing with industry experts across the value chain through primary research has been the next step. Both top-down and bottom-up approaches have been employed to estimate the complete market size. After that, market breakdown and data triangulation methods have been used to estimate the market size of segments and sub-segments.
Secondary Research
In the secondary research process, various secondary sources have been referred to for identifying and collecting information pertinent to this study. Secondary sources include annual reports; press releases; investor presentations; white papers; journals and certified publications; and articles from recognized authors, directories, and databases. Secondary research has been conducted to obtain important information about the industry’s supply chain, value chain, the total pool of key players, market segmentation according to the industry trends (to the bottommost level), geographic markets, and key developments from both market- and technology oriented perspectives.
Primary Research
Extensive primary research has been conducted after gaining knowledge about the ultrasonic cleaning market scenario through secondary research. Several primary interviews have been conducted with market experts from both demand (commercial application providers) and supply (equipment manufacturers and distributors) sides across four major regions: North America, Europe, APAC, and RoW. Approximately 20% and 80% primary interviews have been conducted with parties from demand and supply sides, respectively. The primary data has been collected through questionnaires, emails, and telephonic interviews.
To know about the assumptions considered for the study, download the pdf brochure
Market Size Estimation
In the complete engineering process, both top-down and bottom-up approaches, along with several data triangulation methods, have been used to estimate and validate the size of the ultrasonic cleaning market and other dependent submarkets. The key players in the market have been determined through primary and secondary research. This entire research methodology involves the study of the annual and financial reports of the top market players and extensive interviews with industry experts such as CEOs, VPs, directors, and marketing executives for key insights (both qualitative and quantitative) into the ultrasonic cleaning market.
Data Triangulation
All the percentage shares, splits, and breakdowns have been determined using secondary sources and verified through primary sources. All the possible parameters that affect the markets covered in this research study have been accounted for, viewed in extensive detail, verified through primary research, and analyzed to get the final quantitative and qualitative data. This data has been consolidated and supplemented with detailed inputs and analysis from MarketsandMarkets and presented in the report.
Report Objectives
- To define, describe, and forecast the global ultrasonic cleaning market segmented based on the product, capacity, power output, vertical, and geography
- To provide detailed information related to the major factors (drivers, restraints, opportunities, and challenges) influencing the growth of the market
- To analyze opportunities in the market for stakeholders by identifying high-growth segments of the global ultrasonic cleaning market
- To analyze the value chain of the ultrasonic cleaning market
- To strategically analyze the micromarkets1 with respect to individual growth trends, prospects, and contribution to the overall ultrasonic cleaning market
- To forecast the market size, in terms of value, for various segments in 4 main regions—North America, Europe, Asia Pacific (APAC), and RoW—along with their respective countries
- To analyze competitive developments, such as mergers & acquisitions, new product launches, partnerships & collaborations, and contract & agreement activities, in the global ultrasonic cleaning market
- To strategically profile key players and comprehensively analyze their ranking and core competencies2, along with an analysis of the competitive landscape of the market
Available Customizations
With the given market data, MarketsandMarkets offers customizations according to the company’s specific needs. The following customization options are available for the report:
Product Analysis
- Product matrix that gives a detailed comparison of the product portfolio of each company
Company Information
- Detailed analysis and profiling of additional market players (up to 5).


Growth opportunities and latent adjacency in Ultrasonic Cleaning Market