Non-Thermal Processing Market for Food by Technology (HPP, PEF, Irradiation, Ultrasound, Cold Plasma), Food Type (Meat, Beverages), Function (Microbial Inactivation, Quality Assurance), and Region - Global Forecast to 2022


[143 Pages Report] The non-thermal processing market, was valued at USD 760.7 Million in 2016. It is projected to reach USD 1,224.2 Million by 2022, at a CAGR of 8.4% from 2017. Non-thermal processing technology is used to extend the shelf life of the food products and to enhance their appearance. Non-thermal processing technologies perform the function of food safety and preservation by inactivating the microbial cells. The growth of the packaged food industry and R&D activities are driving the market for non-thermal processing technologies. Market players are responding to new opportunities by expanding their global presence and product offerings.
For More details on this research, Request Free Sample Report
The objectives of the study are:
- To define, segment, and forecast the size of the non-thermal processing market with respect to food product, technology, function, and region
- To analyze the market structure by identifying various sub segments of the non-thermal processing market
- To forecast the size of the non-thermal processing market and its various submarkets with respect to four main regions, namely, North America, Asia Pacific, Europe, and the Rest of the World (RoW)
- To provide detailed information about crucial factors that are influencing the growth of the market (drivers, restraints, opportunities, and challenges)
- To analyze opportunities in the market for stakeholders and provide details of the competitive landscape for market leaders
- To strategically profile key players and comprehensively analyze their market ranking and core competencies
- To analyze competitive developments such as expansions, new product & technology launches, acquisitions, agreements, collaborations, and partnerships in the non-thermal processing market
The years considered for the study are as follows:
- Base Year: 2016
- Estimated Year: 2017
- Projected Year: 2022
- Forecast Period: 2017 to 2022
This report includes estimations of the market size in terms of value (USD million). Both, top-down and bottom-up approaches have been used to estimate and validate the size of the non-thermal processing market and to estimate the size of various other dependent submarkets in the overall market. Key players in the market have been identified through secondary research through various sources such as the US Department of Agriculture (USDA), the European Federation of National Associations of Measurement, Testing and Analytical Laboratories (EUROLAB), the World Health Organization (WHO), I.E. Canada (Canadian Association of Importers and Exporters), the Environmental Protection Agency (EPA), the Food and Agricultural Organization (FAO), the Food Safety Council (FSC), and Statistics Canada, and their market ranking in the respective regions have been determined through primary and secondary research. All percentage shares, splits, and breakdowns have been determined using secondary sources and were verified through primary sources.
To know about the assumptions considered for the study, download the pdf brochure
The non-thermal processing ecosystem comprises non-thermal processing technology providers such as Bosch (Germany), Emerson (US), Bühler (Switzerland), Hiperbaric España (Spain), Avure Technologies (US), CHIC FresherTech (US), Elea Technology (Germany), Pulsemaster (Netherlands), Nordion (Canada), Gray*Star (US), Dukane (US), and Symbios Technologies (US).
Target Audience:
- R&D institutes
- Technology providers
- Non-thermal processing providers
- Intermediary suppliers
- Wholesalers
- Dealers
- Consumers
- End users
“The study answers several questions for stakeholders, primarily which market segments to focus on in the next two to five years for prioritizing efforts and investments.”
Scope of the report
This research report categorizes the non-thermal processing market based on food product, technology, function, and region.
Based on Food Product, the market has been segmented as follows:
- Meat & seafood
- Fruits & vegetables
- Beverages
- Others
Based on Technology, the market has been segmented as follows:
- HPP
- PEF
- Ultrasonic
- Irradiation
- Cold plasma
- Others
Based on Function, the market has been segmented as follows:
- Quality assurance
- Microbial inactivation
- Cutting
- Emulsification & homogenization
- Cleaning
- Others
Based on Region, the market has been segmented as follows:
- North America
- Europe
- Asia Pacific
- RoW (Brazil, Argentina, the Middle East, and Rest of the RoW)
Available Customizations
With the given market data, MarketsandMarkets offers customizations according to the company’s specific scientific needs.
The following customization options are available for the report:
Segmental Analysis
- Segmental analysis, which provides a further breakdown of the in the HPP, PEF, irradiation, ultrasonic, cold plasma, and other technologies segment.
- Further breakdown of non-thermal processing in food products such as meat, fruits & vegetables, juice & beverages, seafood, and other food products.
Geographic Analysis
- Further breakdown of the Rest of Asia Pacific non-thermal processing market, by countries.
- Further breakdown of other countries in the Rest of the World non-thermal processing market, by key countries
Company Information
- Detailed analyses and profiling of additional market players (up to five)
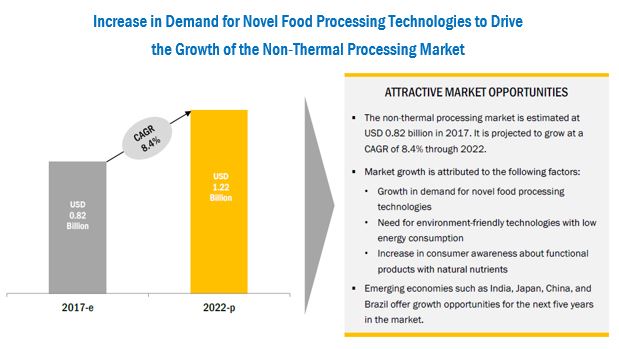
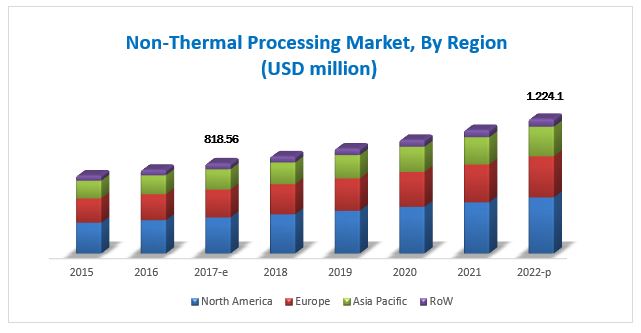
The global market for non-thermal processing market has grown exponentially in the last few years. The market is estimated to be valued at USD 818.6 Million in 2017, and is projected to reach USD 1,224.2 Million by 2022, at a CAGR of around 8.4% from 2017. Emerging economies such as India, China, and Brazil are the potential primary markets of the industry. Growing trend of novel technologies and process optimizaiton are driving the market for non-thermal processing. Latest trends in the food industry for processing, preservation, retention of sensory attributes without the application of heating techniques are fueling the research activities for the development of advanced non-thermal food processing technologies. The conventionally used thermal food processing technologies may lead to changes in product characteristics such as flavor, color, texture, or nutritional value due to the application of heat. Whereas, non-thermal food processing technologies help retain these characteristics in the food products with minimal or no changes to the product profile. This factor makes it advantageous to use non-thermal processing technologies over thermal technologies for processing food.
Energy consumption is very low in the non-thermal processing of food as compared to thermal processing. The food quality and safety can be assured using non-thermal technologies. Hence, these technologies are receiving wide acceptability from the government and federal bodies. To meet the market demand for safe, functional, and quality food products, the various companies and research institutes are extensively involved in the innovational programs to develop advanced and cost-effective non-thermal processing technologies.
The non-thermal processing market for food, based on food product, is segmented into meat & seafood, fruits & vegetables, beverages, and others. The meat & seafood segment is estimated to dominate the market with the largest share in 2017 since meat & seafood products are more prone to bacterial contamination. This is followed by the beverages segment as non-thermal technologies are widely used for the manufacturing of beverages for pasteurization, fortification, and other activities.
The non-thermal processing market for food, based on technology, is segmented into HPP, PEF, ultrasonic, cold plasma, irradiation, and others. The HPP segment is projected to grow at the highest CAGR among all non-thermal processing technologies from 2017 to 2022. The technique preserves the freshness of food products as well as aids in extending their shelf life. It also accommodates the current consumer demand for natural, fresh, and minimally processed foods, as no preservatives or additives are added to the products. Due to these factors, the market is projected to grow at a significant rate in the future.
Based on function, the ultrasonic market non-thermal processing is segmented into microbial inactivation, quality assurance, cutting, emulsification & homogenization, cleaning, and others. Among all, microbial inactivation is anticipated to be the largest segment. It is one of the widely used functions of non-thermal processing technologies for food preservation. Irradiation is an effective non-thermal technology used for microbial inactivation. Food products undergo high frequency radiation treatment, leading to the disintegration of the cells of microorganisms.
For More details on this research, Request Free Sample Report
The North American region is estimated to dominate the non-thermal processing market in 2017, and is further projected to grow at the highest CAGR during the review period. Non-thermal processing is developing more rapidly in North America due to the demand for extended, safe, refrigerated shelf life, novel food processing requirements, and favorable food preservation legislations. Food safety authorities have approved several non-thermal technologies for food processing due to their efficiency and minimum effect on the product’s nutritional and textural characteristics. However, high capital investment in non-thermal technologies might hamper the growth of the global non-thermal technologies market during the review period.
Expansions, new product & technology launches, acquisitions, agreements, collaborations, and partnerships are the key strategies adopted by the players to ensure their growth in the market. The market is dominated by players such as Bosch (Germany), Emerson (US), Bühler (Switzerland), Hiperbaric España (Spain), and Nordion (Canada). Other major players in the market include Avure Technologies (US), CHIC FresherTech (US), Elea Technology (Germany), Pulsemaster (Netherlands), Gray*Star (US), Dukane (US), and Symbios Technologies (US).
To speak to our analyst for a discussion on the above findings, click Speak to Analyst
 Exclusive indicates content/data unique to MarketsandMarkets and not available with any competitors.
Table of Contents
1 Introduction (Page No. - 13)
1.1 Objectives of the Study
1.2 Market Definition
1.3 Market Scope
1.4 Periodization Considered
1.5 Currency Considered
1.6 Stakeholders
2 Research Methodology (Page No. - 17)
2.1 Research Data
2.1.1 Secondary Data
2.1.2 Primary Data
2.1.2.1 Breakdown of Primaries
2.2 Market Size Estimation
2.3 Data Triangulation
2.4 Research Assumptions
2.5 Research Limitations
3 Executive Summary (Page No. - 24)
4 Premium Insights (Page No. - 29)
4.1 Opportunities in the Non-Thermal Processing Market
4.2 Market For Non-Thermal Processing : Key Countries
4.3 Market For Non-Thermal Processing, By Technology & Region
4.4 Developed vs Developing Markets for Non-Thermal Processing in Food
4.5 Non-Thermal Processing Market, By Technology & Food Product
4.6 North America: Market For Non-Thermal Processing, By Technology & Country, 2016
5 Market Overview (Page No. - 35)
5.1 Introduction
5.2 Market Dynamics
5.2.1 Drivers
5.2.1.1 Trend of Novel Technologies Over Conventional Ones
5.2.1.1.1 Retention of Nutrients and Sensory Attributes of Food
5.2.1.1.2 Food Safety Concerns
5.2.1.2 Process Optimization
5.2.1.2.1 Energy Saving “Green Technology”
5.2.1.3 Extensive R&D Activities and Technological Achievements Promoting Non-Thermal Processing
5.2.1.4 Growth of the Ready-To-Eat & Packaged Food Industry
5.2.1.4.1 HPP Technology Speeds Up Packaged Food Processing to Meet Growing Demand
5.2.1.4.2 Growth of the Processed Meat Sector
5.2.2 Restraints
5.2.2.1 Misconceptions Leading to Regulatory Compliance for Labelling Irradiated Food
5.2.2.2 High Capital Investment
5.2.3 Opportunities
5.2.3.1 Competitive Advantage for SMEs
5.2.3.2 Investments By Governments in Food Processing Machinery & Equipment
5.2.3.3 Greater Opportunities in Asian Countries
5.2.4 Challenges
5.2.4.1 Established Users Reluctant to Replace Conventional Technologies
6 Non-Thermal Processing Market, By Technology (Page No. - 46)
6.1 Introduction
6.2 High Pressure Processing (HPP)
6.2.1 By Orientation Type
6.2.2 By Vessel Volume
6.2.3 By End User
6.3 Pulsed Electric Field (PEF)
6.4 Irradiation
6.5 Ultrasonic
6.5.1 By Frequency Range
6.6 Cold Plasma
6.7 Others
7 Non-Thermal Processing Market, By Food Product (Page No. - 62)
7.1 Introduction
7.2 Meat & Seafood
7.3 Fruits & Vegetables
7.4 Beverages
7.5 Others
8 Non-Thermal Processing Market, By Function (Page No. - 70)
8.1 Introduction
8.2 Quality Assurance
8.3 Microbial Inactivation
8.3.1 Compression Through High Pressure
8.3.2 High Intensity Pulsed Electric Fields
8.3.3 Irradiation
8.3.4 Acoustic Cavitation
8.3.5 Other Techniques
8.4 Cutting
8.5 Emulsification & Homogenization
8.6 Cleaning
8.7 Others
8.7.1 Degassing
9 Non-Thermal Processing Market, By Region (Page No. - 75)
9.1 Introduction
9.2 North America
9.2.1 US
9.2.2 Canada
9.2.3 Mexico
9.3 Europe
9.3.1 Germany
9.3.2 UK
9.3.3 France
9.3.4 Italy
9.3.5 Spain
9.3.6 Rest of Europe
9.4 Asia Pacific
9.4.1 China
9.4.2 Japan
9.4.3 India
9.4.4 Australia & New Zealand
9.4.5 Rest of Asia Pacific
9.5 Rest of the World (RoW)
9.5.1 Brazil
9.5.2 Argentina
9.5.3 Middle East
9.5.4 Others in RoW
10 Competitive Landscape (Page No. - 108)
10.1 Overview
10.2 Market Ranking
10.3 Competitive Scenario
10.3.1 New Product & Technology Launches
10.3.2 Expansions
10.3.3 Acquisitions
10.3.4 Agreements, Collaborations, and Partnerships
11 Company Profiles (Page No. - 113)
(Business Overview, Products Offered, Recent Developments, SWOT Analysis & MnM View)*
11.1 Bosch
11.2 Emerson
11.3 Bühler
11.4 Hiperbaric España
11.5 Avure Technologies
11.6 Chic Freshertech
11.7 Elea Technology
11.8 Pulsemaster
11.9 Nordion
11.10 Gray*Star
11.11 Dukane
11.12 Symbios Technologies
*Details on Business Overview, Products Offered, Recent Developments, SWOT Analysis & MnM View Might Not Be Captured in Case of Unlisted Companies.
12 Appendix (Page No. - 132)
12.1 Discussion Guide
12.2 Additional Company Developments
12.2.1 Expansions
12.2.2 New Product and Technology Launches
12.2.3 Acquisitions
12.2.4 Agreements, Collaborations, and Partnerships
12.3 Knowledge Store: Marketsandmarkets’ Subscription Portal
12.4 Introducing RT: Real Time Market Intelligence
12.5 Available Customizations
12.6 Related Reports
12.7 Author Details
List of Tables (72 Tables)
Table 1 US Dollar Exchange Rate Considered for Study, 2014–2016
Table 2 Private Label Packaged Food Subsectors in the Us, 2007 & 2012 (USD Million)
Table 3 Non-Thermal Processing Market Size, By Technology, 2015–2022 (USD Million)
Table 4 HPP Market Size, By Region, 2015–2022 (USD Million)
Table 5 HPP Market Size, By Food Product, 2015–2022 (USD Million)
Table 6 HPP Market Size, By Orientation Type, 2015–2022 (USD Million)
Table 7 HPP Market Size, By Vessel Volume, 2015–2022 (USD Million)
Table 8 HPP Market Size, By End User, 2015–2022 (USD Million)
Table 9 PEF Processing Market Size, By Region, 2015–2022 (USD Million)
Table 10 PEF Market Size, By Food Product, 2015–2022 (USD Million)
Table 11 Irradiation Regulations in the Us
Table 12 Irradiation Processing Market Size, By Region, 2015–2022 (USD Million)
Table 13 Irradiation Market Size, By Food Product, 2015–2022 (USD Million)
Table 14 Applications of Ultrasound in Food Processing
Table 15 Ultrasonic Processing Market Size, By Region, 2015–2022 (USD Million)
Table 16 Ultrasonic Market Size, By Food Product, 2015–2022 (USD Million)
Table 17 Ultrasonic Market Size, By Other Food Products, 2015–2022 (USD Million)
Table 18 Ultrasonic Processing Market Size, By Frequency Range, 2015–2022 (USD Million)
Table 19 High-Frequency Low Intensity Ultrasonic Processing Market Size, By Region, 2015–2022 (USD Million)
Table 20 Low-Frequency High Intensity Ultrasonic Processing Market Size, By Region, 2015–2022 (USD Million)
Table 21 Cold Plasma Processing Market Size, By Region, 2015–2022 (USD Million)
Table 22 Cold Plasma Market Size, By Food Product, 2015–2022 (USD Million)
Table 23 Other Non-Thermal Processing Technologies Market Size, By Region, 2015–2022 (USD Million)
Table 24 Other Technologies Market Size, By Food Product, 2015–2022 (USD Million)
Table 25 Non-Thermal Processing Market Size, By Food Product, 2015–2022 (USD Million)
Table 26 Meat & Seafood: Market For Non-Thermal Processing Size, By Technology, 2015–2022 (USD Million)
Table 27 HPP: Non-Thermal Processing Market Size for Meat & Seafood, By Processing Status, 2015–2022 (USD Million)
Table 28 Fruits &Vegetables: Market For Non-Thermal Processing Size, By Technology, 2015–2022 (USD Million)
Table 29 HPP: Non-Thermal Processing Market Size for Fruits & Vegetables, By Processing Status, 2015–2022 (USD Million)
Table 30 Beverages: Market For Non-Thermal Processing Size, By Technology, 2015–2022 (USD Million)
Table 31 HPP: Market For Non-Thermal Processing Size for Beverages, By Processing Status, 2015–2022 (USD Million)
Table 32 Others: Non-Thermal Processing Market Size, By Technology, 2015–2022 (USD Million)
Table 33 Ultrasonic Processing Market Size, By Function, 2015–2022 (USD Million)
Table 34 Market For Non-Thermal Processing Size, By Region, 2015–2022 (USD Million)
Table 35 North America: Market For Non-Thermal Processing Size, By Country, 2015–2022 (USD Million)
Table 36 North America: Market For Non-Thermal Processing Size, By Technology, 2015–2022 (USD Million)
Table 37 North America: Ultrasonic Processing Market Size, By Frequency Range, 2015–2022 (USD Million)
Table 38 US: Non-Thermal Processing Market Size, By Technology, 2015–2022 (USD Million)
Table 39 Canada: Market For Non-Thermal Processing Size, By Technology, 2015–2022 (USD Million)
Table 40 Mexico: Market For Non-Thermal Processing Size, By Technology, 2015–2022 (USD Million)
Table 41 Europe: Market For Non-Thermal Processing Size, By Country, 2015–2022 (USD Million)
Table 42 Europe: Non-Thermal Processing Market Size, By Technology, 2015–2022 (USD Million)
Table 43 Europe: Ultrasonic Processing Market Size, By Frequency Range, 2015–2022 (USD Million)
Table 44 Germany: Non-Thermal Processing Market Size, By Technology, 2015–2022 (USD Million)
Table 45 UK: Market For Non-Thermal Processing Size, By Technology, 2015–2022 (USD Million)
Table 46 France: Market For Non-Thermal Processing Size, By Technology, 2015–2022 (USD Million)
Table 47 Italy: Market For Non-Thermal Processing Size, By Technology, 2015–2022 (USD Million)
Table 48 Spain: Non-Thermal Processing Market Size, By Technology, 2015–2022 (USD Million)
Table 49 Rest of Europe: Market For Non-Thermal Processing Size, By Technology, 2015–2022 (USD Million)
Table 50 Asia Pacific: Market For Non-Thermal Processing Size, By Country, 2015–2022 (USD Million)
Table 51 Asia Pacific: Market For Non-Thermal Processing Size, By Technology, 2015–2022 (USD Million)
Table 52 Asia Pacific: Ultrasonic Processing Market Size, By Frequency Range, 2015–2022 (USD Million)
Table 53 China: Non-Thermal Processing Market Size, By Technology, 2015–2022 (USD Million)
Table 54 Japan: Market For Non-Thermal Processing Size, By Technology, 2015–2022 (USD Million)
Table 55 India: Market For Non-Thermal Processing Size, By Technology, 2015–2022 (USD Million)
Table 56 Australia & New Zealand: Market For Non-Thermal Processing Size, By Technology, 2015–2022 (USD Million)
Table 57 Rest of Asia Pacific: Non-Thermal Processing Market Size, By Technology, 2015–2022 (USD Million)
Table 58 RoW: Market For Non-Thermal Processing Size, By Country/Region, 2015–2022 (USD Million)
Table 59 RoW: Market For Non-Thermal Processing Size, By Technology, 2015–2022 (USD Million)
Table 60 RoW: Ultrasonic Processing Market Size, By Frequency Range, 2015–2022 (USD Million)
Table 61 Brazil: Non-Thermal Processing Market Size, By Technology, 2015–2022 (USD Million)
Table 62 Argentina: Market For Non-Thermal Processing Size, By Technology, 2015–2022 (USD Million)
Table 63 Middle East: Non-Thermal Processing Market Size, By Technology, 2015–2022 (USD Million)
Table 64 Others in RoW: Market For Non-Thermal Processing Size, By Technology, 2015–2022 (USD Million)
Table 65 New Product & Technology Launches, 2017–2018
Table 66 Expansions, 2016–2017
Table 67 Acquisitions, 2016–2018
Table 68 Agreements, Collaborations, and Partnerships, 2013–2015
Table 69 Expansions, 2013–2015
Table 70 New Product and Technology Launches, 2013–2017
Table 71 Acquisitions, 2013–2014
Table 72 Agreements, Collaborations, and Partnerships, 2013–2015
List of Figures (43 Figures)
Figure 1 Non-Thermal Processing Market: Market Segmentation
Figure 2 Market For Non-Thermal Processing: Geographic Segmentation
Figure 3 Research Design: Non-Thermal Processing
Figure 4 Market Size Estimation Methodology: Bottom-Up Approach
Figure 5 Market Size Estimation Methodology: Top-Down Approach
Figure 6 Data Triangulation Methodology
Figure 7 Non-Thermal Processing Market Snapshot, By Technology, 2017 vs 2022
Figure 8 Market For Non-Thermal Processing Size, By Food Product, 2017–2022
Figure 9 North America is Projected to Be the Fastest-Growing Regional Market By 2022
Figure 10 Non-Thermal Processing Market Share, By Region
Figure 11 Increase in Demand for Novel Food Processing Technologies to Drive the Growth of the Market For Non-Thermal Processing
Figure 12 Mexico to Be the Fastest-Growing Country Market for Non-Thermal Processing By 2022
Figure 13 HPP Segment Dominated the Market in 2016
Figure 14 Developing Countries to Emerge at the Highest Growth Rates During the Forecast Period
Figure 15 HPP Dominated the Non-Thermal Processing Market Across All Technologies in 2016
Figure 16 US Accounted for the Largest Share in 2016
Figure 17 Market Dynamics: Non-Thermal Processing Market
Figure 18 Companies Preferred Non-Thermal Processing for Better Nutrient/Sensory Quality
Figure 19 Food Safety Improvements & Increased Budget Allocation By the Fda, 2015
Figure 20 HPP Technology Was Highly Productive in Retaining Sensory Attributes
Figure 21 Non-Thermal Food Processing Technologies Under Experiment (%)
Figure 22 Private Label Trend of Packaged Food in the US (USD Million)
Figure 23 Meat Products Was the Major Segment for Use of Non-Thermal Techniques
Figure 24 Major Processed Meat Exporting Countries and Growth From 2012 to 2016
Figure 25 Limitations of Using Non-Thermal Processing Technologies in Food Industries
Figure 26 Net Trade of Processed Meat Products in the Philippines
Figure 27 FDI Inflows Were the Highest in the Food Processing Sector in India, 2015
Figure 28 Fund Allocation for the Development of the Food Processing Industry in India (USD Million)
Figure 29 Non-Thermal Processing Market Size, By Technology, 2017 vs 2022
Figure 30 HPP Market Size, By Region, 2017 vs 2022
Figure 31 Non-Thermal Processing Market Size, By Food Product, 2017 vs 2022
Figure 32 Meat & Seafood: Market For Non-Thermal ProcessingSize, By Technology, 2017 vs 2022
Figure 33 Ultrasonic Processing Market Size, By Function, 2017 vs 2022
Figure 34 US Held the Largest Share in the Non-Thermal Processing Market, 2016
Figure 35 North American Market Snapshot
Figure 36 European Market Snapshot
Figure 37 Asia Pacific Market Snapshot
Figure 38 Key Developments of the Leading Players in the Market For Non-Thermal Processing 2013-2017
Figure 39 Top Five Companies in the Market For Non-Thermal Processing, 2016
Figure 40 Market Evaluation Framework
Figure 41 Bosch: Company Snapshot
Figure 42 Emerson: Company Snapshot
Figure 43 Bühler: Company Snapshot


Growth opportunities and latent adjacency in Non-Thermal Processing Market