The study involved four major activities in estimating the current size of the V2X cybersecurity market. Exhaustive secondary research was done to collect information on the market, the peer market, and the child markets. The next step was to validate these findings, assumptions, and sizing with the industry experts across value chains through primary research. The top-down and bottom-up approaches were employed to estimate the complete market size. Thereafter, market breakdown and data triangulation processes were used to estimate the market size of segments and subsegments.
Secondary Research
In the secondary research process, various secondary sources such as company annual reports/presentations, press releases, industry association publications [for example, 5G Automotive Association, International Organization of Motor Vehicle Manufacturers (OICA), National Highway Traffic Safety Administration (NHTSA), International Energy Association (IEA)], articles, directories, technical handbooks, trade websites, technical articles, and databases (for example, Marklines, and Factiva) have been used to identify and collect information useful for an extensive commercial study of the global V2X cybersecurity market.
Primary Research
Extensive primary research was conducted after acquiring an understanding of the V2X cybersecurity market scenario through secondary research. Several primary interviews were conducted with market experts from both the demand (automotive OEMs) and supply (V2X cybersecurity providers, V2X providers, and technology providers) sides across major regions, namely, North America, Europe, and Asia Pacific. Approximately 30% and 70% of primary interviews were conducted from the demand and supply sides, respectively. Primary data was collected through questionnaires, emails, and telephonic interviews.
In the canvassing of primaries, various departments within organizations, such as sales, operations, and marketing, were covered to provide a holistic viewpoint in the report. After interacting with industry experts, brief sessions were also conducted with highly experienced independent consultants to reinforce the findings from primaries. This, along with the in-house subject matter experts’ opinions, led to the findings described in the remainder of this report.

To know about the assumptions considered for the study, download the pdf brochure
Market Size Estimation
The bottom-up approach was used to estimate and validate the size of the V2X cybersecurity market. This method was also used extensively to estimate the size of various subsegments in the market. The research methodology used to estimate the market size includes the following:
-
The key players in the industry and markets have been identified through extensive secondary research.
-
The industry’s supply chain and market size, in terms of volume, have been determined through primary and secondary research processes.
All percentage shares, splits, and breakdowns have been determined using secondary sources and verified through primary sources.

To know about the assumptions considered for the study, Request for Free Sample Report
Market Size Validation
The top-down approach was used to determine the size of the V2X cybersecurity market for the communication, propulsion, connectivity, security type, security framework, form and vehicle type. The total market size in value (USD million) was derived using the top-down approach.
For instance, the V2X cybersecurity market for the communication segment was derived using the top-down approach to estimate the hardware and software subsegments. Mapping was carried out at the regional level to understand the contribution by type of communication. The market size was derived at the regional level in terms of value. The total value of the market was multiplied by the cost penetration percentage of each segment at the regional level.

Data Triangulation
After arriving at the overall market size—using the market size estimation processes as explained above—the market was split into several segments and subsegments. To complete the overall market engineering process and arrive at the exact statistics of each market segment and subsegment, data triangulation, and market breakdown procedures were employed, wherever applicable. The data was triangulated by studying various factors and trends from both the demand and supply sides.
Market Definition
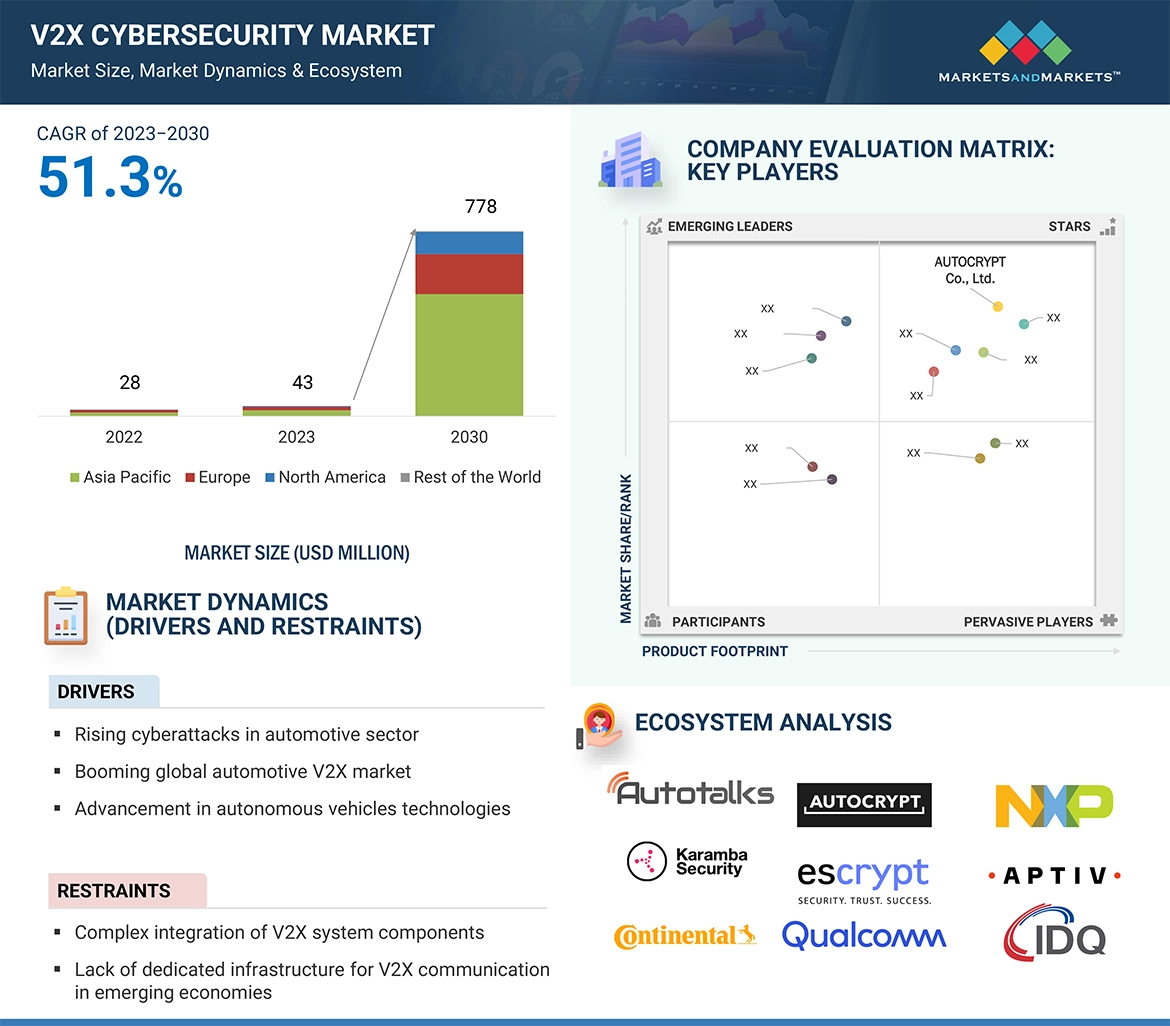
The term "V2X" refers to "Vehicle-to-Everything" communication, encompassing various types of communication within the transportation ecosystem. This includes communication between vehicles (V2V), vehicles and infrastructure (V2I), and vehicles and pedestrians (V2P), V2C (Vehicle-to-Cloud), and V2G (Vehicle-to-Grid). V2X technology is a crucial component of intelligent transportation systems, facilitating the exchange of information to enhance road safety, traffic efficiency, and overall transportation effectiveness. The V2X cybersecurity market specifically addresses the need for cybersecurity solutions tailored for V2X communication. As vehicles and infrastructure become increasingly connected, ensuring the security of these communication networks becomes paramount. The V2X cybersecurity market focuses on developing and implementing security measures to protect against cyber threats that could compromise the integrity and safety of the V2X ecosystem. Key components of the V2X cybersecurity market include security software and solutions, hardware security, risk assessment and management, regulatory compliance, training and consulting, and incident response and recovery.
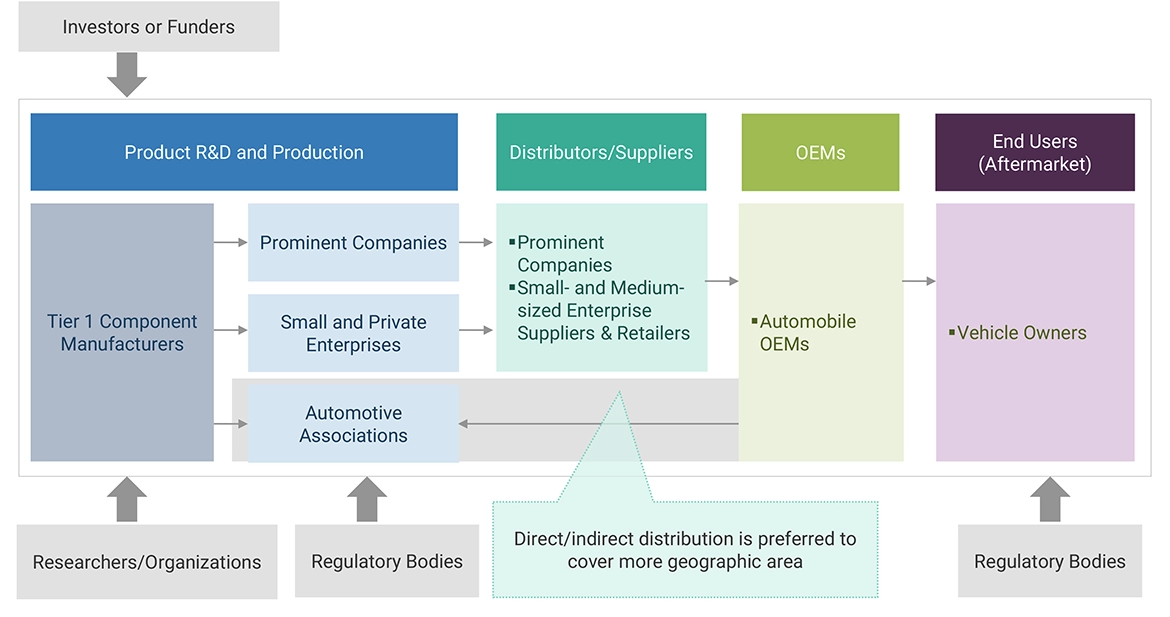
List of Key Stakeholders
-
Automotive Original Equipment Manufacturers (OEMs)
-
Distributors and Retailers
-
Manufacturers and Suppliers of V2X Technology Components
-
Navigation Devices and GPS Manufacturers
-
ODM and OEM Technology Solution Providers
-
Operating System (OS) Vendors
-
Organizations, Forums, Alliances, and Associations
-
Regulatory and Transportation Authorities
-
Software Providers
-
State & National Regulatory Authorities
-
V2X Solutions Providers
-
V2X Cybersecurity Providers
Report Objectives
-
To segment and forecast the V2X cybersecurity market in terms of value (USD million).
-
To analyze and forecast the market based on form, communication, propulsion, connectivity, vehicle type, security type, security framework, and region.
-
To segment the V2X cybersecurity market and forecast the market size, by value (USD million), based on communication (V2V, V2I, V2P, and V2G)
-
To segment the V2X cybersecurity market and forecast the market size, by value (USD million), based on security (PKI and embedded)
-
To segment the V2X cybersecurity market and forecast the market size, by value (USD million), based on form (in-vehicle and external cloud services)
-
To segment the automotive V2X market and forecast the market size, by value (USD million), based on connectivity (DSRC and cellular)
-
To segment the V2X cybersecurity market and forecast the market size, by value (USD million), based on vehicle type (passenger car and commercial vehicle)
-
To segment the V2X cybersecurity market and forecast the market size, by value (USD million), based on propulsion (ICE vehicles and electric vehicles)
-
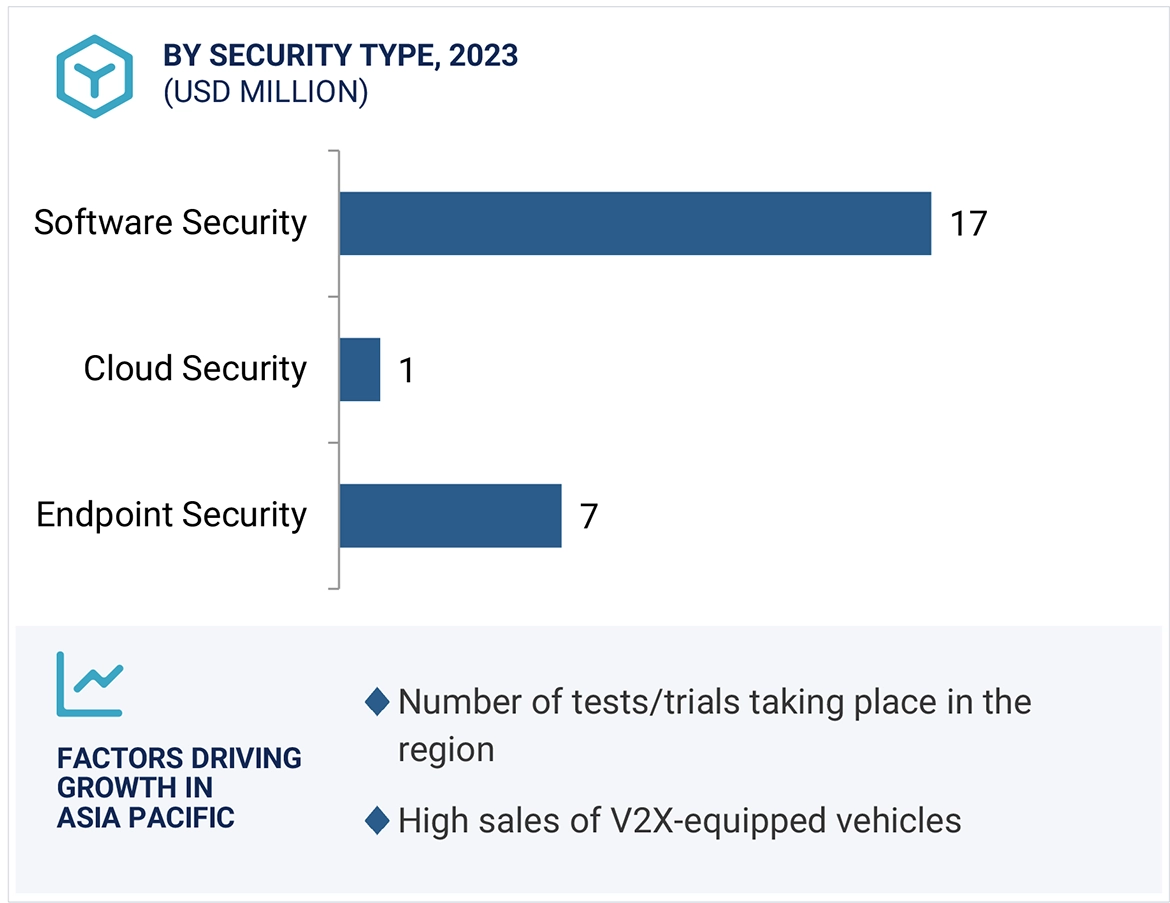
To segment the V2X cybersecurity market and forecast the market size, by value (USD million), based on security type (endpoint security, software security, and cloud security)
-
To segment the V2X cybersecurity market and forecast its size, by value, based on region (Asia Pacific, Europe, North America, and the Rest of the world (RoW))
-
To analyze the technological developments impacting the market
-
To analyze the opportunities for stakeholders and the competitive landscape for market leaders
-
To provide detailed information regarding the major factors influencing the market growth (drivers, challenges, restraints, and opportunities)
-
To strategically analyze the market with respect to individual growth trends, prospects, and contributions to the total market
-
To study the following with respect to the market
-
Supply Chain Analysis
-
Ecosystem Analysis
-
Technology Analysis
-
Case Study Analysis
-
Patent Analysis
-
Buying Criteria
-
To strategically profile the key players and comprehensively analyze their market rankings and core competencies
-
To track and analyze the competitive developments such as joint ventures, mergers & acquisitions, new product launches, expansions, and other activities carried out by key industry participants
Available Customizations
With the given market data, MarketsandMarkets offers customizations in line with the company’s specific needs.
-
V2X cybersecurity market, by communication type, at the country level (for countries covered in the report)
-
Company Information
-
Profiling of additional market players (up to five)
-
Additional Countries for Region (Up to 3)


Growth opportunities and latent adjacency in V2X Cybersecurity Market